Week 6 - Data analysis
Objective:
- To create a data visualizer which would take column numbers as the input and plot the respective columns as separate images. Each file should be saved by the name of the column and the plot labels should be extracted from the file itself
- The code should be compatible to the file. If a non-compatible file is provided as an input. It should say something like "File not recognized. Please provide a valid CONVERGE output file"
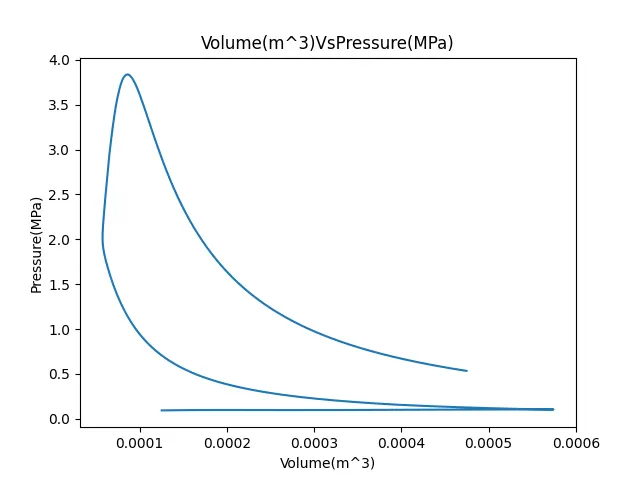
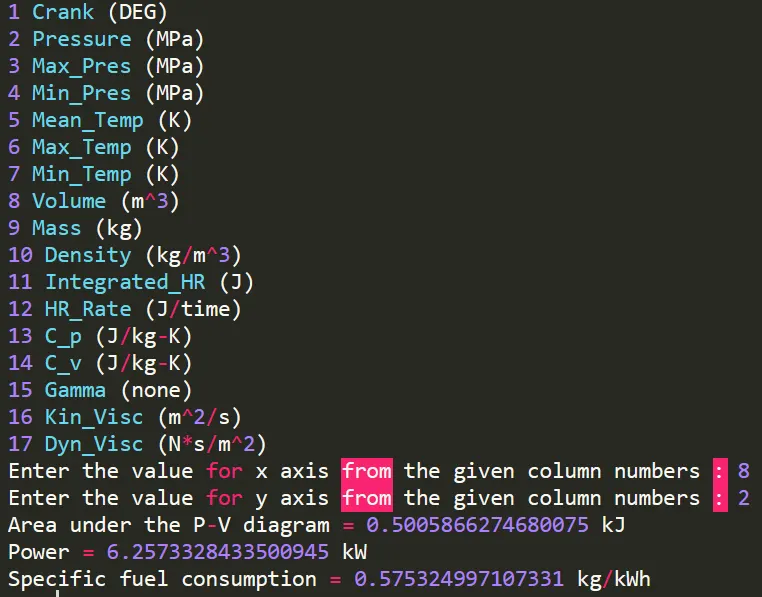
- Perform basic performance claculations for area under P-V diagram, Power @ 1500 rpm and specific fuel consumption @ 1500 rpm
Procedure:
Step 1: Read the file in for loop line by line and detergmine the column numbers through
Step 2: read and define the parametrs in the data along with inputs
Step 3: Read the column number, parameter and unit
Step 4: determine inputs for x and y axis based on column number
Step 5: Check the compatibility of the file
Step 6: Execute the code with the respective values of x and y for paramter, unit and values
Step 7: Plot the data based on the inputs given for x and y
Step 8: Calculate the area under PV diagram using trapz from numpy module
Step 9: Calculate power and specific fuel consumption
Step 10: Display the performance parameters
Code:
"""
			File Parsing using Python for data analysis

"""

import matplotlib.pyplot as plt
import math
import numpy as np

# Reading the file

line_count = 1
for line in open('engine_data.out'):
	if '#' not in line:
		values = line.split()
		number_of_columns = len(values)
		line_count = line_count + 1


# Extracting the Parameters and respective units:

line_number = 1
# Extarcting parameters:
for line in open('engine_data.out'):
	if line_number == 3:
		parameter = line.split()

# Extracting units:
	if line_number == 4:
		unit = line.split()

	line_number = line_number + 1

# Displaying column count, parameter and respective unit:
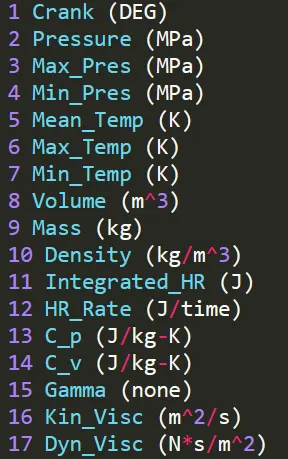
for i in range(1,18):
	print(i, parameter[i], unit[i])

# Defining the input for plots:

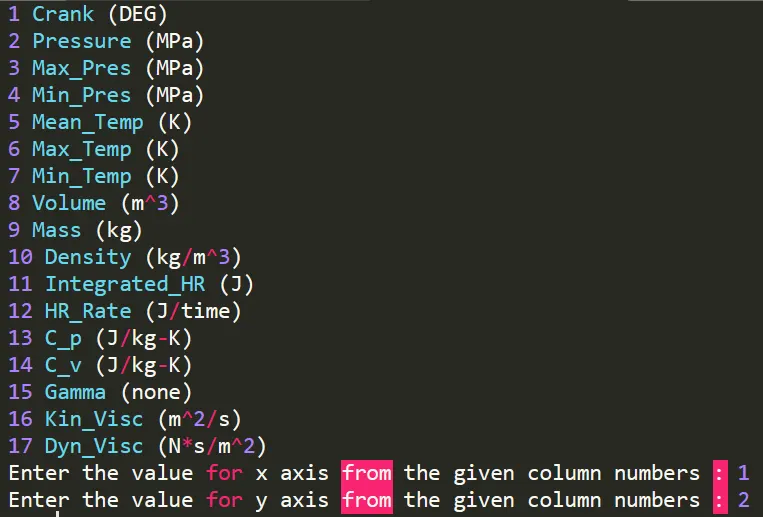
x = int(input('Enter the value for x axis from the given column numbers : '))
y = int(input('Enter the value for y axis from the given column numbers : '))

# File compatibility check:
if x > 17 or y > 17:
	print('File not recognized. Please provide a valid CONVERGE output file')

# Main Code:

X = []
Y = []

ct = 1
for line in open('engine_data.out'):
	if ct == 3:
		x_parameter = line.split()[x]
		y_parameter = line.split()[y]

	if ct == 4:
		x_axis = x_parameter + line.split()[x]
		y_axis = y_parameter + line.split()[y]

	if '#' not in line:
		X.append(float(line.split()[x-1]))
		Y.append(float(line.split()[y-1]))

	ct = ct + 1

# Data Plotting:

plt.plot(X,Y)
plt.xlabel(x_axis)
plt.ylabel(y_axis)
plt.title(x_axis+ 'Vs' +y_axis)
plt.savefig(x_axis+'Vs'+y_axis+'.png')
plt.show()

# Basic Performance calculation:

# Area under the P-V diagram:

area_under_PV_Diagram = np.trapz(Y,X)

rpm = 1500

work_done = area_under_PV_Diagram*(1e+3)

Power = (work_done*rpm)/(2*60)

specific_fuel_consumption = (rpm*2*60*20e-6)/Power


if x == 8:
	if y == 2:
		print('Area under the P-V diagram =', work_done, 'kJ')
		print('Power =', Power, 'kW')
		print('Specific fuel consumption =', specific_fuel_consumption, 'kg/kWh')
Plots:
- Display the column number along with parameter and units:
- Plot the data based on inputs given:
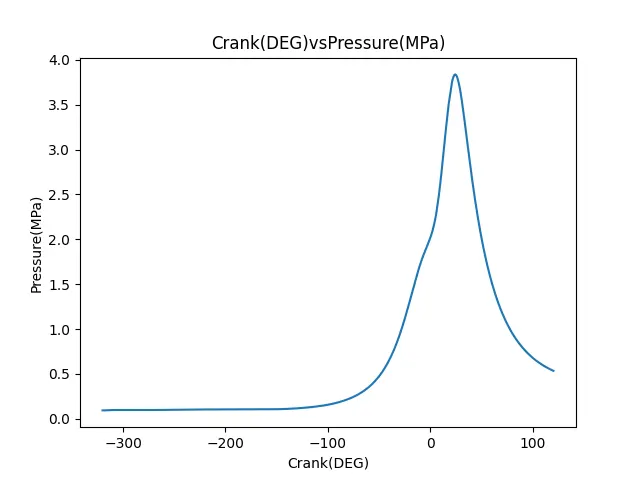
- Perform data compatibility check:

- Plot the Pressure Vs Volume diagram and determine performance parameters: