Week 6 - Data analysis
#Aim:1.)To write a program for data analysis of engine_data.out file (thermo.out file in Converge) of an engine simulation.
2.)Calculate the area under the P-V diagram.Power output,Specific fuel oil consumption.
------------------------------------******************************--------------------------------------
#Problem statement:
In the given problem,thermo.out file of an engine simulation is studied,named in the program as 'engine_data.out'.
Data present in the file is read and extracted as columns.
At last plots between different variables created those chosen by user.
Work done,Power and SFOC for this engine also calculated.
----------------------------------**********************************-----------------------------------
#Solution procedure:
1.All required modules matplotlib,numpy imported.
2.An empty list of all the variables present in the defined.
3.Line count variable created.
4.'try' and 'except' statement used for handling error,program will only run if suitable file would be used(in this program 'engine_data.out')
5.File opened and all the lines not having '#' splitted into columns and each column assigned to a variable(like crank-column 1 etc)
6.All these extracted columns are then arranged in one array as columns.
7.From PV diagram,work done calculated and from it, power and SFOC calculated.
8.Variables list created.
9.Two input functions created ,assigned to 'a' and 'b'.
10.Whichever variable user would choose to be plotted on X and Y axis,would be plotted and saved in the location where program is saved.
------------------------------------------*********************************----------------------------
#Program:
"""
Data analysis challenge Python
"""

import matplotlib.pyplot as plt
import numpy as np


#Empty list for variables defined
crank=[]
pressure=[]
Max_Pres=[]
Min_Pres=[]
Mean_Temp=[]
Max_Temp =[]
Min_Temp=[]
Volume  =[]
Mass=[]
Density=[]
Integrated_HR=[]
HR_Rate=[]
C_p =[]
C_v =[]
Gamma=[]
Kin_Visc=[]
Dyn_Visc=[]

#Line counter variable
line_count=1

#For compatibility check,only accept engine_data.out
try:
	for line in open('engine_data.out'):
		if '#' not in line:

			crank.append(float(line.split()[0]))
			pressure.append(float(line.split()[1]))
			Max_Pres.append(float(line.split()[2]))
			Min_Pres.append(float(line.split()[3]))
			Mean_Temp.append(float(line.split()[4]))
			Max_Temp.append(float(line.split()[5]))
			Min_Temp.append(float(line.split()[6]))
			Volume.append(float(line.split()[7]))
			Mass.append(float(line.split()[8]))
			Density.append(float(line.split()[9]))
			Integrated_HR.append(float(line.split()[10]))
			HR_Rate.append(float(line.split()[11]))
			C_p.append(float(line.split()[12]))
			C_v.append(float(line.split()[13]))
			Gamma.append(float(line.split()[14]))
			Kin_Visc.append(float(line.split()[15]))
			Dyn_Visc.append(float(line.split()[16]))

			line_count=line_count+1


	#Number of columns
	n_column=17

	#Arrays of zeros defined for storing variables value in the form of column
	Column=np.zeros((len(crank),n_column))

	for i in range(len(crank)):
		Column[i,0]=crank[i]
		Column[i,1]=pressure[i]
		Column[i,2]=Max_Pres[i]
		Column[i,3]=Min_Pres[i]
		Column[i,4]=Mean_Temp[i]
		Column[i,5]=Max_Temp[i]
		Column[i,6]=Min_Temp[i]
		Column[i,7]=Volume[i]
		Column[i,8]=Mass[i]
		Column[i,9]=Density[i]
		Column[i,10]=Integrated_HR[i]
		Column[i,11]=HR_Rate[i]
		Column[i,12]=C_p[i]
		Column[i,13]=C_v[i]
		Column[i,14]=Gamma[i]
		Column[i,15]=Kin_Visc[i]
		Column[i,16]=Dyn_Visc[i]


	"""
	Work done Calculation:

	Work done= Area under PV curve=Sum of(P1V1,P2V2,P3V3,.......PnVn)
	"""

	#Creating Pressure array and converting Pressure in MPa into N/m^2
	Pressure_array=np.array(pressure)*1e6

	#Volume array defined
	Volume_array=np.array(Volume)

	#trapz function used for calculating area which is work done
	Work_done=np.trapz(Pressure_array,Volume_array)
	print('Work done by the engine : {0} Joules'.format(Work_done))


	"""
	Power generated by engine in one complete cycle

	"""
	Time_taken_for_one_power_stroke_in_sec=0.08

	Power_generated_in_watts=Work_done/Time_taken_for_one_power_stroke_in_sec
	print('Power generated by engine in one complete cycle : {0} Watts'.format(Power_generated_in_watts))

	Power_generated_in_KW=Power_generated_in_watts/1000

	"""
	SFOC(Specific fuel oil consumption calculation)

	SFOC=Mass of fuel consumed per hour/Power developed (in KW)
	"""
	Mass_of_fuel_consumed_per_hour_in_grams=20*1e-6
	SFOC=Mass_of_fuel_consumed_per_hour_in_grams/Power_generated_in_KW
	print('Specific fuel oil consumption calculation : {0} (g/KW-hr)'.format(SFOC))


	#Variables list
	variables_list=['Crank angle (degrees)','Pressure (MPa)','Max_Pres (MPa)','Min_Pres (MPa)','Mean_Temp (K)','Max_Temp (K)','Min_Temp (K)',\
	'Volume (m3)','Mass (kg)','Density (kg/m3)','Integrated_HR (Joule)','HR_Rate (Joule/Time)','C_p (J/kg-K)','C_v (J/kg-K)'\
	,'Gamma','Kin_Visc (m^2/s)','Dyn_Visc (N*s/m^2)']


	#Input function used to take input from user
	a=input(' 1.Column1 - Crank angle (degrees)\n 2.Column2 - Pressure(MPa)\n 3.Column3 - Max_Pres(MPa)\
		\n 4.Column4 - Min_Pres(MPa)\n 5.Column5 - Mean_Temp(K)\n 6.Column6 - Max_Temp(K)\n 7.Column7 - Min_Temp(K)\
		\n 8.Column8 - Volume(m3)\n 9.Column9 - Mass(kg)\
		\n 10.Column10 - Density(kg/m3)\n 11.Column11 - Integrated_HR(Joule)\n 12.Column12 - HR_Rate(Joule/Time)\
		\n 13.Column13 - C_p(J/kg-K)\n 14.Column14 - C_v(J/kg-K)\
		\n 15.Column15 - Gamma\n 16.Column16 - Kin_Visc(m^2/s)\n 17.Column17 - Dyn_Visc(N*s/m^2)\
		\nEnter variable column number to be plotted on X-axis: ')

	b=input(' 1.Column1 - Crank angle (degrees)\n 2.Column2 - Pressure(MPa)\n 3.Column3 - Max_Pres(MPa)\
		\n 4.Column4 - Min_Pres(MPa)\n 5.Column5 - Mean_Temp(K)\n 6.Column6 - Max_Temp(K)\n 7.Column7 - Min_Temp(K)\
		\n 8.Column8 - Volume(m3)\n 9.Column9 - Mass(kg)\
		\n 10.Column10 - Density(kg/m3)\n 11.Column11 - Integrated_HR(Joule)\n 12.Column12 - HR_Rate(Joule/Time)\
		\n 13.Column13 - C_p(J/kg-K)\n 14.Column14 - C_v(J/kg-K)\
		\n 15.Column15 - Gamma\n 16.Column16 - Kin_Visc(m^2/s)\n 17.Column17 - Dyn_Visc(N*s/m^2)\
		\nEnter variable column number to be plotted on Y-axis: ')

	print('Variables selected for plot are {0} and {1}:'.format(variables_list[int(a)-1],variables_list[int(b)-1]))
	plt.plot(Column[:,int(a)-1],Column[:,int(b)-1])
	plt.xlabel(variables_list[int(a)-1])
	plt.ylabel(variables_list[int(b)-1])
	plt.title(variables_list[int(a)-1]+' vs ' +variables_list[int(b)-1]+ ' plot')
	plt.savefig(variables_list[int(a)-1] + ' vs '+variables_list[int(b)-1] + '.png')
	plt.show()


except FileNotFoundError:
	print("File not recognized. Please provide a valid CONVERGE output file")
#Results:
1.Compatibility check:
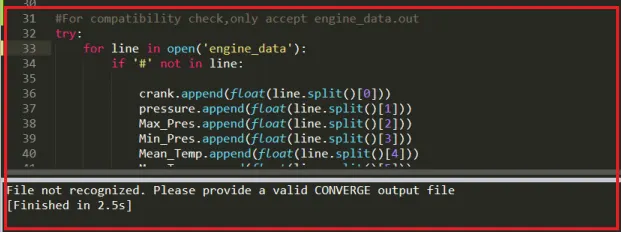
See.when inappropiate file would be given to program,it will exit telling
"File not recognized. Please provide a valid CONVERGE output file".
2.Plots between variables:
a.PV plot:
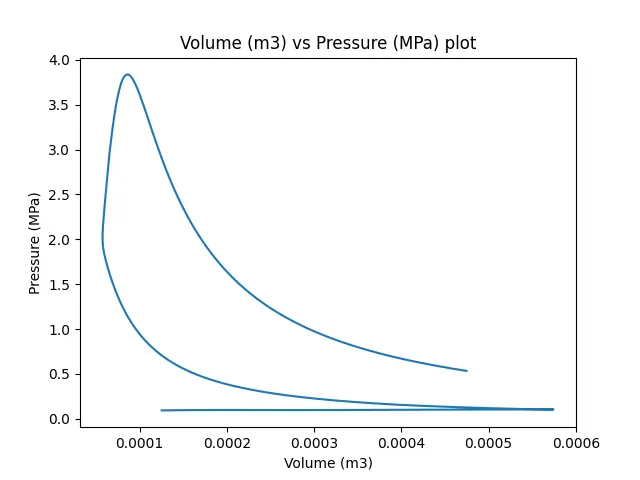
Above plot is not complete,as data was not available for one complete cycle.So it is open.
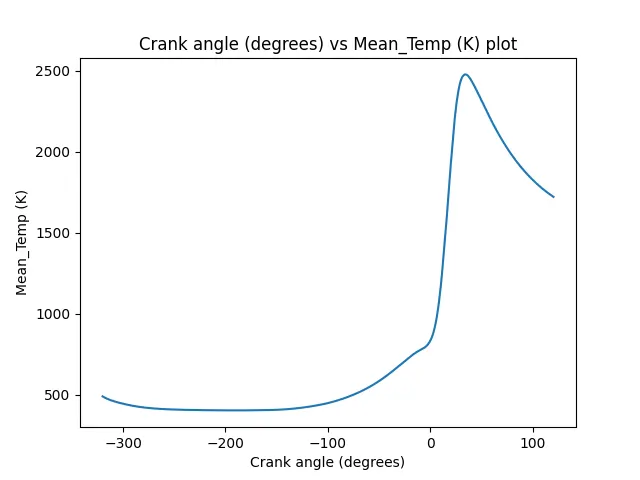
b.)Crank angle vs Mean temp plot.
#Performance parameter :

----------------------------------------****************************-----------------------------