Week 6 - Data analysis
Data Analysis
Aim :
To write a program to create a visualizer tool which will read the given data and the required information is taken from that data file.
import matplotlib.pyplot as plt
import math
import numpy as np
import sys
from numpy import inf


try:
	file = open('engine_data.out','r')

except:
	print('"file is not recognized"')
	sys.exit()

Column1 = []
Column2 = []
row_ct=0
col_ct=0

column_title = []
column_unit =[]
ct_header =0
file_name = 'engine_data.out'
for line in open(file_name,'r'):
	if '#' not in line:
		row_ct += 1
		col_ct = len(str.split(line))
	else:
		ct_header+=1
		if ct_header==3:
			line_content = str.split(line)
			for i in range(1,len(line_content)):
				column_title.append((line_content[i]))

		elif ct_header==4:
			line_content = str.split(line)
			for j in range(1,len(line_content)):
				column_unit.append(line_content[j])

c=1
for c in range(1,17):
	c=c+1

a=8
b=2
x_axis =[]
y_axis = []

for i in open(file_name,'r'):
	if '#' not in i:
		x=i.split()
		x_axis.append(float(x[a-1]))
for j in open(file_name,'r'):
	if '#' not in j:
		y=j.split()
		#print(y)
		y_axis.append(float(y[b-1]))

plt.plot(y_axis,x_axis)
plt.xlabel(column_title[a-1]+column_unit[a-1])
plt.ylabel(column_title[b-1]+column_unit[b-1])
plt.show()

#Calculating Area
area = np.trapz(y_axis,x_axis)
print("The area under the p-v  is",area)

workdone= area*pow(10,6)
n=1500
power = 2*math.pi*n*workdone/(60)
print("the power  is", power)

fuel =20*pow(10,-6)

sfc = 3600*fuel*n/(60*power)
#sfc[sfc == -inf] = 0
print("specific fuel consumption is",sfc)
Steps involved in Coding:
- Initially, trying an exception for file which is to be read is located in this directory or not. Try command open the file and on the other hand, if the file not there then it is an except where it prints file is not recognized.
- Several parameters are initialized such as row counter (row_ct) , column counter(col_ct) , Column title and row title.
- Using the for loop , we are reading every line in the readable file.
- If ‘#’ is not in the particular line, then we will read the line and extract the data using the split command and on the other hand , in the else statement by adding the counter header in the line 3 is the appropriate title for the x and y axis and counter header = 4 is the units of the title.
- By giving the two columns for which the plots should be displayed, the same for loop logic previously used is repeated but the values of x axis and y axis are appended using the append command.
- Program is taking the column no as the input and generate the plot between the given two column numbers.
- The plot is generated between and accumulated values of x and y axes and also x and y labels are generated.
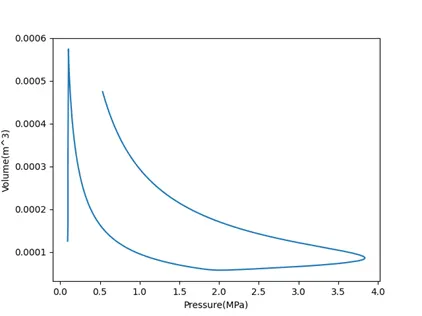
- Using the imported numpy library, the trapz function is used to find the area under the p-v curve.
- Parameters like power, specific fuel consumption are also calculated using the written formula.
Plot between the Pressure and Volume
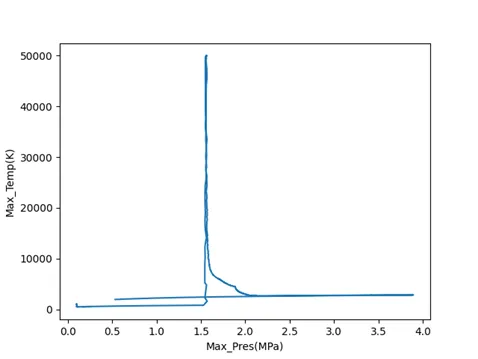
Plot between the max pressure and max temperature
Results and discussion:
The area under the p-v is 0.0005005866274680075
the power is 78631.96356693914
specific fuel consumption is 2.2891454293490526e-05
Error :
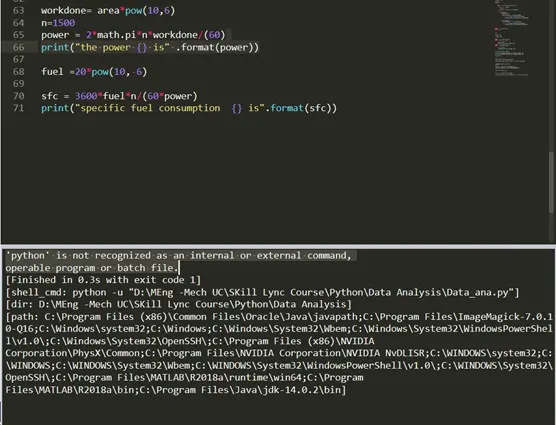
I had faced the problem of internal command and I fixed by changing the path in environment variables settings.