Week 6 - Data analysis
OBJECTIVES :- To write a script to analyzing data visualizations.
PROBLEM STATEMENT :-
Our task is to write a script that does the following-
- Data visualizer :-
- Our script should take column numbers as the input and plot the respective column as seperate images.
- Each file should be saved by the name of the column.
- The plot labels should be extracted from the file. If somebody request for the plot between column 1 and(crank angle) and column 8(volume), then the label information should automatically be extracted and must appear as label in the plots.
2. Compatibility check :-
Our code should be exit gracefully, if a non-compatible file is provided as an input. It should say something like “File not recognized. Please provide a valid CONVERGE output file”.
- Basic performance calculation :-
- Calculate area under the P-V diagram. P is in column 2 and V is in column 8.
- Calculate the power output of this engine. Assume that RPM(revolution per minute) is 1500.
- This engine consumed 20 micro grams of fuel (per 1 stroke cycle). Calculate it’s specific fuel consumption (sfc).
Providing engine data file is- https://drive.google.com/open?id=1L8GY56d-M8mB1KfceM-xVhGNvnCIqxjm
SOLUTION PROCEDURE :-
Detail solution procedure which I adopted for this challenge I described below-
- First off all I download the engine data file which provided on skill lync challenge page.
- Then I analyzed that file, there have total 8671 lines (I.e. rows) and single column.
- But in single column there have multiple values upto 17 and each value’s column consist of different quantity like crank angle, pressure, temperature, volume …etc. (for more details see above attached files).
- Then I write the code by importing matplotlib and numpy module.
- Then I open the engine data file.
- According to problem statements, I print quantity.
- Then I check input files wheather is it compatible or not by entering user’s itself.
- Then I calculate each and every value which is related to engine and problem statement according to formulae.
- Then I plots different graphs to showing relation between them.
PYTHON CODE WITH STEPWISE EXPLAINATIONS :-
import matplotlib.pyplot as plt
import numpy as np

#Demonstrating file parsing in python

#Basic initialization
line_count = 1
crank = []
pressure = []
temperature = []
volume = []

#File parsing starts here
for line in open("engine_data.out"):

	if "#" not in line:
		#if line_count is 1:
		crank.append(float(line.split()[0]))
		pressure.append(float(line.split()[1]))
		temperature.append(float(line.split()[4]))
		volume.append(float(line.split()[7]))
		line_count = line_count + 1

# Data visualizations
   print(pressure)
   print(crank)
   print(temperature)
   print(volume)

# To check compatible file
 compatible_file= input("Enter a file with any extensions: ")
 if "." in compatible_file:
  	print("Well!, It is a compatible file")
 else:
 	print("file not recognized. Please provide a valid CONVERGE output file")

# Calculations
#To calculate area
#trapz function is used to calculate area or any quantity
 Pressure = 1e6*np.array(pressure)
 Volume = np.array(volume)
 Area = np.trapz(Pressure,Volume)
 print("Workdone(area under P-V diagram) = ", Area, "J")

#Calculating power, P = 2*pi*N*T/60 or = work done*time
#Cycle per second = 1500/60
 Power = (Area*(1500/60))/1000
 print("Power output of the engine = ", Power, "KW")

#Calculating specific fuel consumpion
#20 micro grams of fuel(per 1 stroke cycle)
#mass_flow = 20e-6
 sfc = (20*pow(10,-6)*3600)/Power
 print("Specific fuel consumption = ", sfc, "g/KWh")

#figures
plt.plot(crank,pressure,linewidth=3)
plt.xlabel("Crank angle")
plt.ylabel("pressure")
plt.savefig("Crank vs Pressure plot")
plt.show()

plt.plot(crank,temperature,linewidth=3)
plt.xlabel("Crank angle")
plt.ylabel("Temperature")
plt.savefig("Crank vs Temperature plot")
plt.show()

plt.plot(volume,pressure,linewidth = 3)
plt.xlabel("Volume")
plt.ylabel("Pressure")
plt.savefig("Volume vs Pressure plot")
plt.show()- First off all I importing all required module so that I can run my program softly.
- Then I consider some empty quantity so that, I will append required quantity.
- Then I parsing the file and opened it out.
- I neglect those lines which are in “#” (I.e. pounds tag).
- Then I split each quantity with their column number and appended it in empty quantity.
- I use here float function because of if there some decimal quantity then that also taken into considerations.
- Then I print each quantity which I want, this is the problem statement of data visualizations.
- Then I try to check compatible file.
- For that I consider a input file by which user defined, and if the file will compatible I.e. in that any dot extension present then there showing file is compatible, otherwise not.
- Then I does some basic calculations.
- Converting unit quantity arrange in array format by using numpy
- Then I use trapz(I.e. trapezoidal) function to calculate area under the P-V diagram.
- “trapz” function comes under numpymodule and it is use to calculate area or anything in between abacus shape or any shape.
- This area it means workdone in P-V diagram.
- From this area and cycle per second which we have already given, I calculate power.
- The formula for power is- Power = (Area*cycle per sec)/1000.
- From this power, mass flow and stroke cycle I calculate specific fuel consumption.
- Finally, I plotted different figures like crank angle vs pressure, crank angle vs temperature and volume vs pressure.
- We can install here REPL i.e. sublime package.
1. DATA VISUALIZER CODE :-
import matplotlib.pyplot as plt
import numpy as np

#Demonstrating file parsing in python

#Basic initialization
line_count = 1
crank = []
pressure = []
temperature = []
volume = []

#File parsing starts here
for line in open("engine_data.out"):

	if "#" not in line:
		#if line_count is 1:
		crank.append(float(line.split()[0]))
		pressure.append(float(line.split()[1]))
		temperature.append(float(line.split()[4]))
		volume.append(float(line.split()[7]))
		line_count = line_count + 1

   print(pressure)
   print(crank)
   print(temperature)
   print(volume)
2. COMPATIBILITY CHECK CODE :-
import matplotlib.pyplot as plt
import numpy as np

#Demonstrating file parsing in python

#Basic initialization
line_count = 1
crank = []
pressure = []
temperature = []
volume = []

#File parsing starts here
for line in open("engine_data.out"):

	if "#" not in line:
		#if line_count is 1:
		crank.append(float(line.split()[0]))
		pressure.append(float(line.split()[1]))
		temperature.append(float(line.split()[4]))
		volume.append(float(line.split()[7]))
		line_count = line_count + 1

 # To check compatible file
 compatible_file= input("Enter a file with any extensions: ")
 if "." in compatible_file:
  	print("Well!, It is a compatible file")
 else:
 	print("file not recognized. Please provide a valid CONVERGE output file")
3. BASIC PERFORMANCE CALCULATION CODE :-
import matplotlib.pyplot as plt
import numpy as np

#Demonstrating file parsing in python

#Basic initialization
line_count = 1
crank = []
pressure = []
temperature = []
volume = []

#File parsing starts here
for line in open("engine_data.out"):

	if "#" not in line:
		#if line_count is 1:
		crank.append(float(line.split()[0]))
		pressure.append(float(line.split()[1]))
		temperature.append(float(line.split()[4]))
		volume.append(float(line.split()[7]))
		line_count = line_count + 1


 # Calculations
 #To calculate area
 #trapz function is used to calculate area or any quantity
 Pressure = 1e6*np.array(pressure)
 Volume = np.array(volume)
 Area = np.trapz(Pressure,Volume)
 print("Workdone(area under P-V diagram) = ", Area, "J")

 #Calculating power, P = 2*pi*N*T/60 or = work done*time
 # Cycle per second = 1500/60
 Power = (Area*(1500/60))/1000
 print("Power output of the engine = ", Power, "KW")

 #Calculating specific fuel consumpion
 #20 micro grams of fuel(per 1 stroke cycle)
 #mass_flow = 20e-6
 sfc = (20*pow(10,-6)*3600)/Power
 print("Specific fuel consumption = ", sfc, "g/KWh")
4. PLOTTING CODE :-
import matplotlib.pyplot as plt
import numpy as np

#Demonstrating file parsing in python

#Basic initialization
line_count = 1
crank = []
pressure = []
temperature = []
volume = []

#File parsing starts here
for line in open("engine_data.out"):

	if "#" not in line:
		#if line_count is 1:
		crank.append(float(line.split()[0]))
		pressure.append(float(line.split()[1]))
		temperature.append(float(line.split()[4]))
		volume.append(float(line.split()[7]))
		line_count = line_count + 1

#figures
plt.plot(crank,pressure,linewidth=3)
plt.xlabel("Crank angle")
plt.ylabel("pressure")
plt.savefig("Crank vs Pressure plot")
plt.show()

plt.plot(crank,temperature,linewidth=3)
plt.xlabel("Crank angle")
plt.ylabel("Temperature")
plt.savefig("Crank vs Temperature plot")
plt.show()

plt.plot(volume,pressure,linewidth = 3)
plt.xlabel("Volume")
plt.ylabel("Pressure")
plt.savefig("Volume vs Pressure plot")
plt.show()
DISCUSSION AND RESULTS :-
Plots between different quantity :-
- Crank angle vs Pressure plot :-
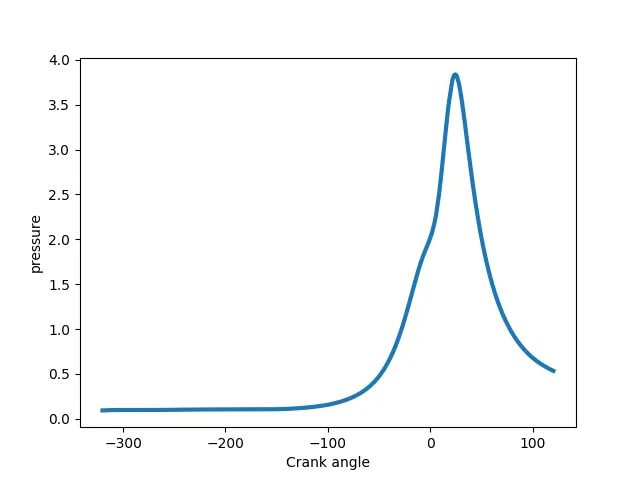
Above figure shows pressure vs crank angle. Maximum pressure at zero crank angle it means this is a compression stroke. Upto -100 degree crank angle it constant and from -100 degree to +100 degree it goes up and goes down.
- Crank angle vs temperature plot :-
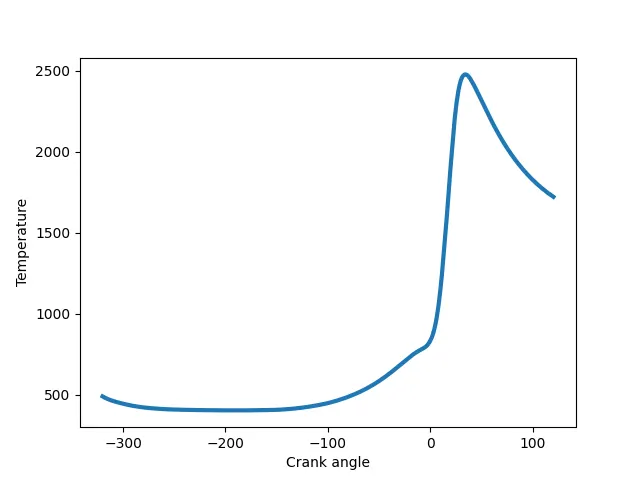
Above figure denotes pressure vs crank angle plot. Maximum temperature is after zero degree crank angle it means this is expansion stroke and later on it goes down the temperature.
- Volume vs Pressure plot :-
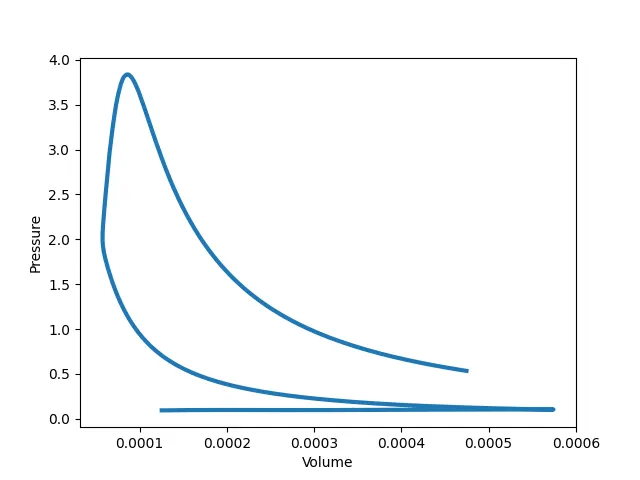
Above plots shows pressure vs volume. As we know that pressure and volume are inversaly proportional quantity, it means when pressure goes up then volume goes down and vice-versa. In this figure at start pressure is maximum and then it goes down. At compression pressure increases and at expansion presssure decreases which we can see from above figure.
SCREENSHOTS :-
- Comptability check check :-


From this screenshots we can see that and understood that which one file is compatible and which one not.
If file with “.” extensions, then we can say that file is compatible and otherwise file is not be compatible.
This is the best command to check up our file. Input is fully depends on users only.
2. Performance value check :-

From this screenshot we can see that, calculations of engine quantity like workdone, power and specific fuel consumption from pressure volume plot by which calculated area under P-V diagram.
From our output we can consider that our engine is in normal range.
CONCLUSIONS :-
From above python program code and results we can conclude that following points are-
- Such scripts are quite commonly used in companies for data analysis.
- We can not seperated column from single combine column without split command as shown in code.
- Matplotlib command is use for plotting graph
- numpy command is used to do calculations.
- “trapz” function we can’t use without numpy module.
- “trapz” command is used to calculate area or anything between two or multiple quantities.
- For appending anything we need empty quantity.
- Pressure is maximum at zero degree crank angle.
- Temperature is maximum at just after zero degree crank angle.
- Pressure and volume are inversaly proportional to each other, it can be proved by pressure vs volume plots.
- From output of this engine we can conclude that our engine is in normal range.
In this way I successfully completed this project by describing everything like data visualizer, comptability check and basic performance calculations.
Firstly, I write whole challenge processor, then step by step python code explainations, different plots and snapshots of comptability and performance value. And finally I concluded everything from all process.