Data Analysis for Engine data file using Python Script
AIM: Data analysis of an Engine data file using Python script.
ABSTRACT: We need to write a script in python which will Analyse the data in the engine_data.out file and will plot versus plot between the engine parameters. The x-axis and y-axis input will user specified from the list.
INTRODUCTION:
Why parse file?
We live in a world where there is a wide variety of formats. So to convert a type of format to another which can be utilized, analyzed, and can be used in a simple way with the help of a program.
Parse means to Analyse (a string or text )into a logical syntactic component.
or
In a better way we can say that ' Convert data in a certain format into a more usable format.'
Parsing a file means reading in a data stream of some sort and building an in-memory model of the semantic content of that data. This aims at facilitating performing some kind of transformation on the data.
In this challenge, we have to do the following task:
- Data visualization- Extracting data from different parameter column
- Compatibility check- If any incompatible file or file not recognized should display relevant info.
- Basic performance calculation-Performs calculations for engine output power for 1500RPM engine, work done by calculating the area under the curve(Pressure vs volume), specific fuel consumption value for 20 microgram/cycle.
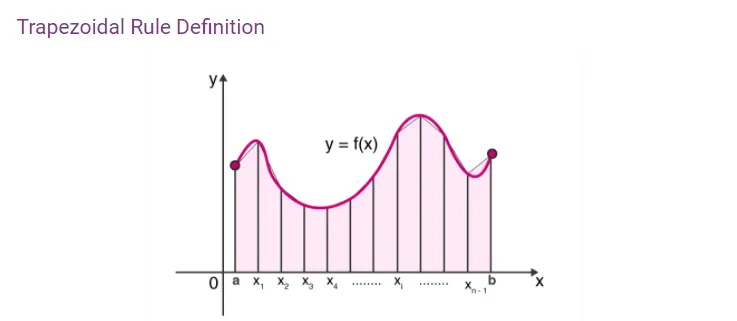
For the calculation of the Area under the curve, we will use the Trapezoidal method.
In Calculus, the Trapezoidal Method is one of the important integration rules. The name trapezoidal is because when the area under the curve is evaluated, then the total area is divided into small trapezoids instead of rectangles. This rule is used for approximating the definite integral where it uses the linear approximations of the functions.
In Python, we can use by from numpy import trapz by Area= np.trapz(variable1, variable2)

PROCEDURE:
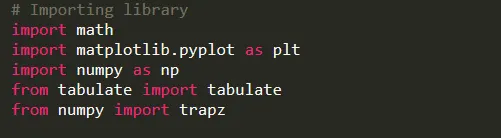
- Import required libraries
- Check file formate compatibility
- Plot the guidance table
- Take user input
- Extracted data for the specified colomn
- Calculate workdone, power and sfc
- Print the required data values
- Plot and save data for the pressure vs volume and user defined variable
Python script for Data Extraction and Analysis
"""
Demonstarting the File Parsing
"""
# Importing library
import math
import matplotlib.pyplot as plt
import numpy as np
from tabulate import tabulate
from numpy import trapz


# Expection handling statment
try:
	# compatibilty check for the file
	f=open('engine_data.out','r')     # read file formate 'r'
	print('File succesfully opened  ')


	# Basic initialization
	pressure=[]
	volume=[]
	X=[]
	Y=[]
	line_count = 1

	# Table list for user which will make easy to make choice between ther varibles

	print(' Refer the table below to enter the Coloum No. for plotting graph for X-xis and Y-axis ')
	cn=['1','2','3','4','5','6','7','8','9','10','11','12','13','14','15','16','17']
	p=['crank','pressure','max_pre','min_pre','mean_temp','max_temp','min_temp','volume','mass','density','int_HR','HR_rate','Cp','Cv','gamma','kin_vis','dyn_vis']
	units= ['(DEG)','(MPa)','(MPa)','(MPa)','(K)','(K)','(K)','(m^3)','(kg)','(kg/m^3)','(J)','(J/time)','(J/kg-K)','(J/kg-K)','(non)','(m^2/s)','(N*s/m^2)']
	table=zip(cn,p,units)
	print(tabulate(table))


	# input from the user

	x_in = int(input('Enter the coloum No. for X-axis data:'))
	y_in = int(input('Enter the coloum No. for Y-axis data:'))

	# coloum position in array
	x_data=x_in-1
	y_data=y_in-1


	# File parsing starts here

	for line in open( 'engine_data.out'):
		if '#' not in line:

			pressure.append(float(line.split()[1]))
			volume.append(float(line.split()[7]))
			X.append(float(line.split()[x_data]))
			Y.append(float(line.split()[y_data]))
			line_count =line_count+1


	# Area under the curve
	PRESSURE= 1e6* np.array(pressure) # Mpa to pa also list to np array type conversion
	VOLUME=np.array(volume)           # list to np array type conversion
	area= np.trapz(PRESSURE,VOLUME)   # Trapezoidal method of integration method
	print('Area under the curve is i.e. work done =',area,'J')


	# Power Calculation

	cycle= 1500                # Given RPM (angular speed)
	speed= cycle/60            # RPS
	power= area*speed/1000     # power in KW

	print( 'The power output of the Engine is= ', power,'KW')

	#sfc Calculation
	mass_flow= 20e-6             # micro gram to g (*10-6)
	sfc= mass_flow*3600/power     # g/KWh

	print('The specific fuel consumption= ',sfc,'g/KWh')


	#plotting pressure vs volume graph
	plt.plot(volume,pressure)
	plt.ylabel( 'Pressue (Mpa)')
	plt.xlabel('Volume(m^3)')
	plt.title('pressure vs volume' )
	plt.savefig('pressure vs volume')
	plt.show()
	plt.close()

	# user input colomn file name, labels and title
	title= str(p[y_data])+'  vs  '+str(p[x_data])
	xlabel=str(p[x_data])+str(units[x_data])
	ylabel=str(p[y_data])+str(units[y_data])

	# plotting user input versus plot
	plt.plot(X,Y)
	plt.xlabel(xlabel )
	plt.ylabel(ylabel)
	plt.title(title)
	plt.savefig(title)
	plt.show()
	plt.close()
	plt.show()

except Exception:
	print('File not recognized. Please provide a valid CONVERGE output file')
RESULT:
The figure window below you can see is the display window which is made user interactive with table displaying the variable name with colomn and units.
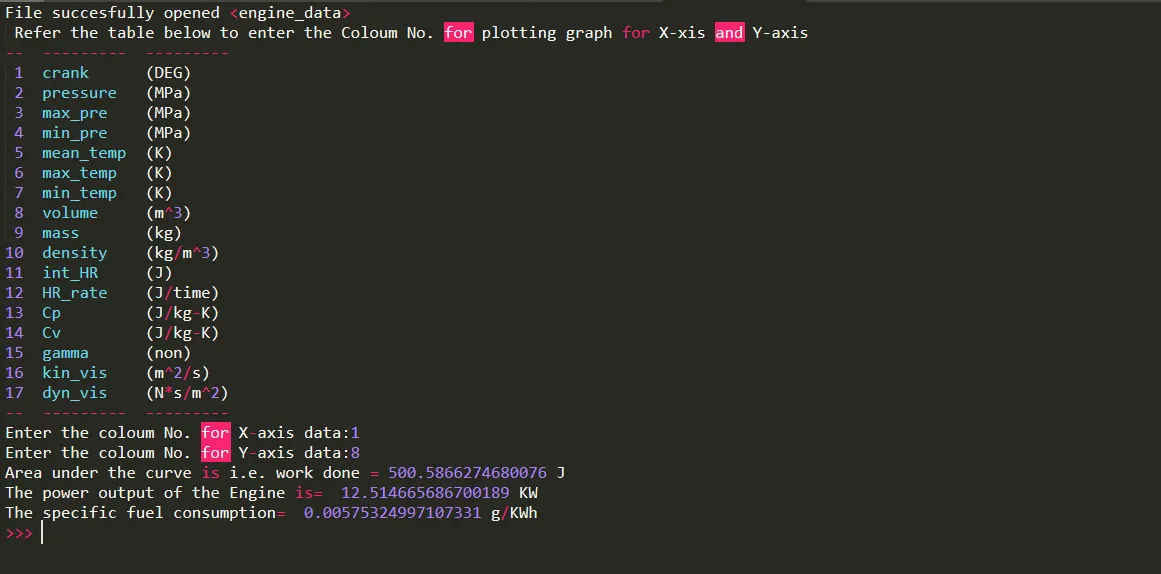
Display window
As you can see through the above display window the work done is 500.58 J, power output of the engine is 12.51 KW and the sfc value is 0.00575 g/KWh
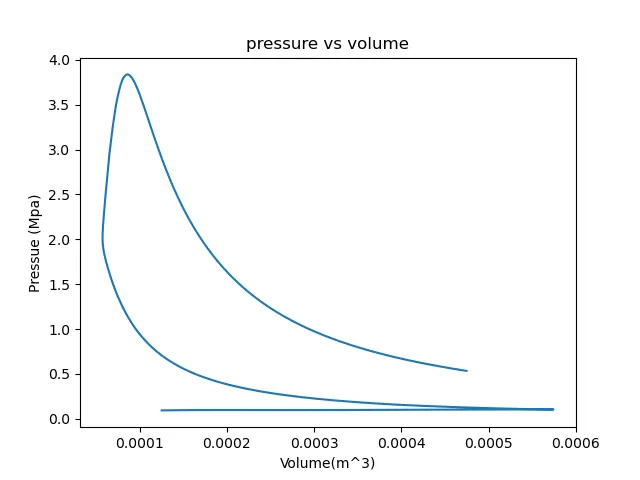
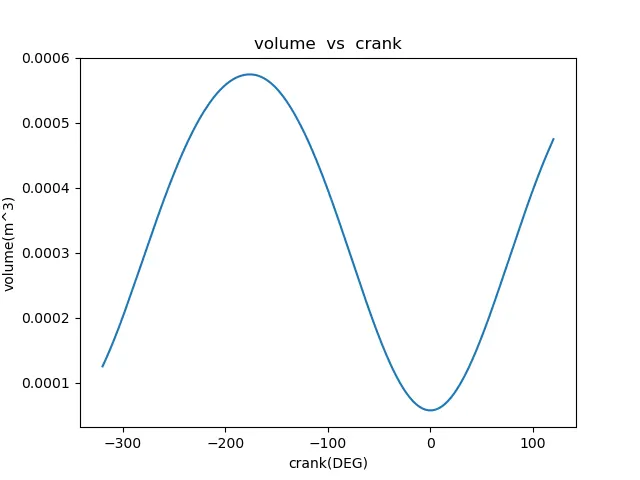
There are two versus plot
1) pressure vs volume
2) volume vs crank
CONCLUSION:
The script successfully extract data from the engine_data.out file. The result are much relevant. This type of scripting can be used for any type of format data file to analyse and utilize data from it.