Week 6 - Data analysis
Objective
To write a script, performing the following actions:
- Visualizing Data with taking care of following points:
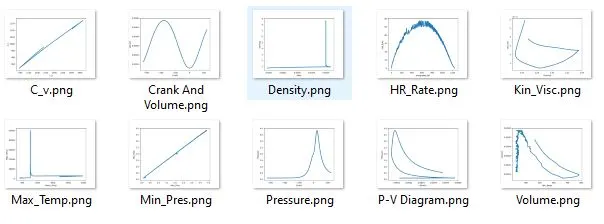
- The script should take column numbers as the input and plot the respective columns as separate images
- Each plot should be saved by the name of the column
- The plot labels should be extracted from the file
- Checking Compatibility (whether correct File is present or not):
- The code should exit gracefully if a non-compatible file is provided as an input. It should say something like "File not recognized. Please provide a valid CONVERGE output file"
- Calculating Basic Performance Parameters:
- Determine the area under the P-V diagram (P is in column 2 and V is in column 8)
- Determine the power output of this engine (assume that RPM is 1500)
- Determine the specific fuel consumption
Description
A valid compatible file can be parsed and data can be extracted from it using basic pre-defined functions like open (), split (), and for loop. The Pathlib.Path () function is used to confirm whether the file exists or not. Plots are created for visualizing the data using the pre-defined functions. The area under the P-V diagram is calculated using the trapz() function.
Given
- The out file is provided.
- Fuel consumption of the engine is 20 micrograms of fuel (per 1 stroke cycle).
- The RPM of the engine is 1500.
Assumption
The provided Data file contains data for the four strokes engine.
Code
# Script for Extracting and Visualizing Data from the Data File
import matplotlib.pyplot as plt
import numpy as np
import pathlib
# Checking File Status
file=pathlib.Path("engine_data.out")
if file.exists():
	print("File Exists")
else:
	print("File not recognized. Please provide a valid CONVERGE output file")
#Extracting column headers for plots' labelling
name=[]
fb=open("engine_data.out", 'r')
i=0
for line in fb:
	if '#' in line and i == 2:
		name=line.split()
	i=i+1


# Extracting Data from File
Crank=[]
Pressure=[]
Max_Pres=[]
Min_Pres=[]
Mean_Temp=[]
Max_Temp=[]
Min_Temp=[]
Volume=[]
Mass=[]
Density=[]
Integrated_HR=[]
HR_Rate=[]
C_p=[]
C_v=[]
Gamma=[]
Kin_Visc=[]
Dyn_Visc=[]
da=open("engine_data.out", 'r')
for line in da:
	if '#' not in line:
		Crank.append(float(line.split()[0]))
		Pressure.append(float(line.split()[1]))
		Max_Pres.append(float(line.split()[2]))
		Min_Pres.append(float(line.split()[3]))
		Mean_Temp.append(float(line.split()[4]))
		Max_Temp.append(float(line.split()[5]))
		Min_Temp.append(float(line.split()[6]))
		Volume.append(float(line.split()[7]))
		Mass.append(float(line.split()[8]))
		Density.append(float(line.split()[9]))
		Integrated_HR.append(float(line.split()[10]))
		HR_Rate.append(float(line.split()[11]))
		C_p.append(float(line.split()[12]))
		C_v.append(float(line.split()[13]))
		Gamma.append(float(line.split()[14]))
		Kin_Visc.append(float(line.split()[15]))
		Dyn_Visc.append(float(line.split()[16]))
# Plotting Graph between Columns
plt.plot(Crank, Pressure, linewidth="3")
plt.xlabel(name[1])
plt.ylabel(name[2])
plt.savefig('Pressure.png')
plt.show()
plt.plot(Max_Pres, Min_Pres, linewidth="3")
plt.xlabel(name[3])
plt.ylabel(name[4])
plt.savefig('Min_Pres.png')
plt.show()
plt.plot(Mean_Temp, Max_Temp, linewidth="3")
plt.xlabel(name[5])
plt.ylabel(name[6])
plt.savefig('Max_Temp.png')
plt.show()
plt.plot(Min_Temp, Volume, linewidth="3")
plt.xlabel(name[7])
plt.ylabel(name[8])
plt.savefig('Volume.png')
plt.show()
plt.plot(Mass, Density, linewidth="3")
plt.xlabel(name[9])
plt.ylabel(name[10])
plt.savefig('Density.png')
plt.show()
plt.plot(Integrated_HR, HR_Rate, linewidth="3")
plt.xlabel(name[11])
plt.ylabel(name[12])
plt.savefig('HR_Rate.png')
plt.show()
plt.plot(C_p, C_v, linewidth="3")
plt.xlabel(name[13])
plt.ylabel(name[14])
plt.savefig('C_v.png')
plt.show()
plt.plot(Gamma, Kin_Visc, linewidth="3")
plt.xlabel(name[15])
plt.ylabel(name[16])
plt.savefig('Kin_Visc.png')
plt.show()
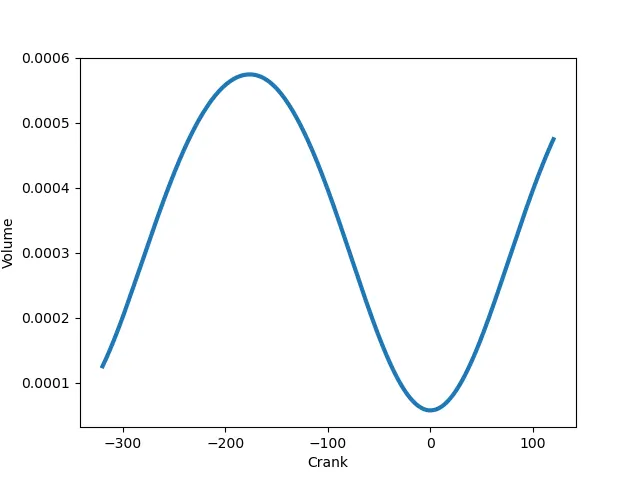
plt.plot(Crank, Volume, linewidth="3")
plt.xlabel(name[1])
plt.ylabel(name[8])
plt.savefig('Crank And Volume.png')
plt.show()

# Creating PV Diagram
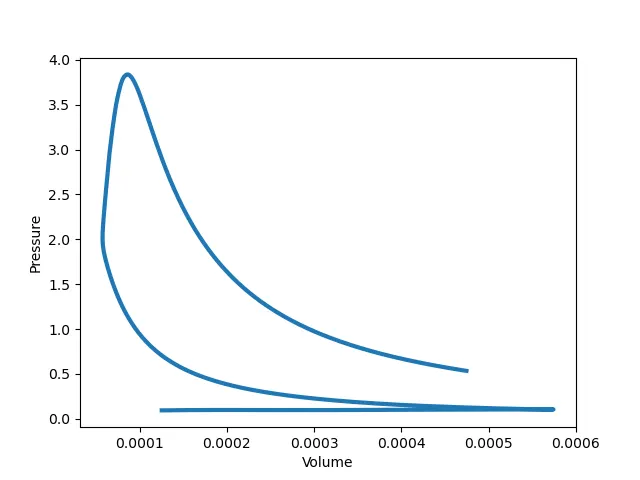
plt.plot(Volume, Pressure, linewidth="3")
plt.xlabel(name[8])
plt.ylabel(name[2])
plt.savefig('P-V Diagram.png')
plt.show()

#calculating area under pv diagram to obtain work done per cycle
area=np.trapz(Pressure, Volume)
area=area*pow(10, 6)
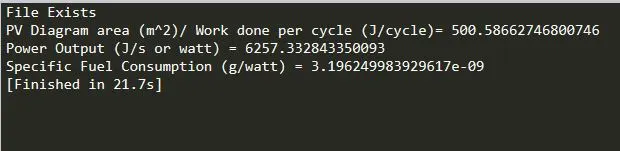
print("PV Diagram area (m^2)/ Work done per cycle (J/cycle)=", area)

# rpm is provided
rpm=1500
#assumed 4 stroke engine, calculating work done per second using no. of revolutions per minute
power_output=(area*rpm)/120
print("Power Output (J/s or watt) =", power_output)
#fuel consumption in micro grams per stroke cycle (given)
fuel_consumption=20*pow(10,-6)
spe_fuel=fuel_consumption/power_output
print("Specific Fuel Consumption (g/watt) =", spe_fuel)
Output
- Plots
- The plot between Pressure and Volume
- The plot between Crank angle and volume
- Plots between different Columns
Conclusion
The script has run successfully; all the desired parameters are calculated. Outputs are mentioned below: