Data analysis
Objective:
To write a program to analyze various data plots for a converge engine output data file and calculate the required parameters.
Problem Statement:
To write a script that does the following:
- Data Extraction
The data is to be stored a 2D array which contains for all parameters individually
- Data visualizer
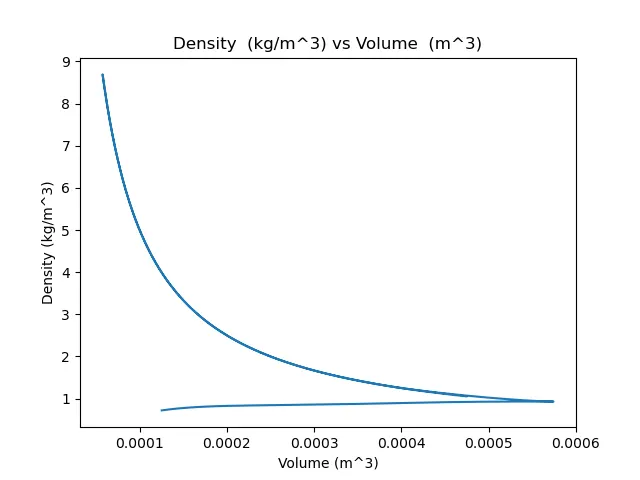
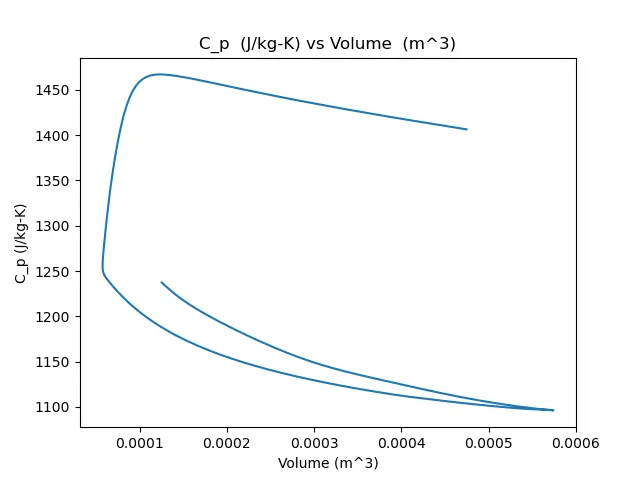
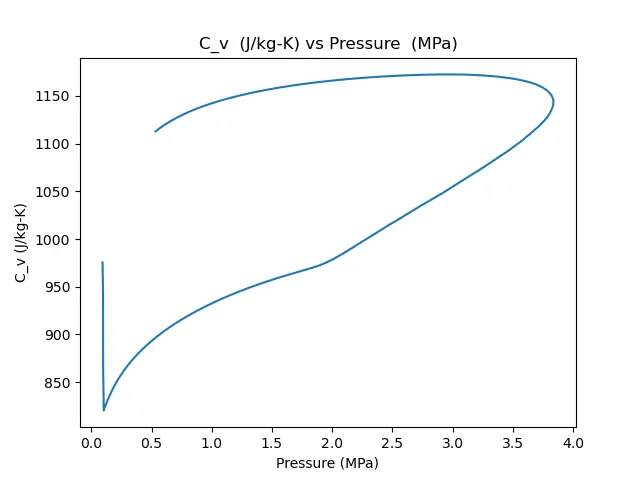
To plot custom plots between the given data in the source file as per user input. The plot generated with the label information and title for each plot extracted automatically.
- Compatibility check
To check the validity of the file given as input for processing the required data. If file is not present or saved by a different name, it throws an error that is then conveyed to the user as an error statement, and the program exits.
- Engine performance calculation
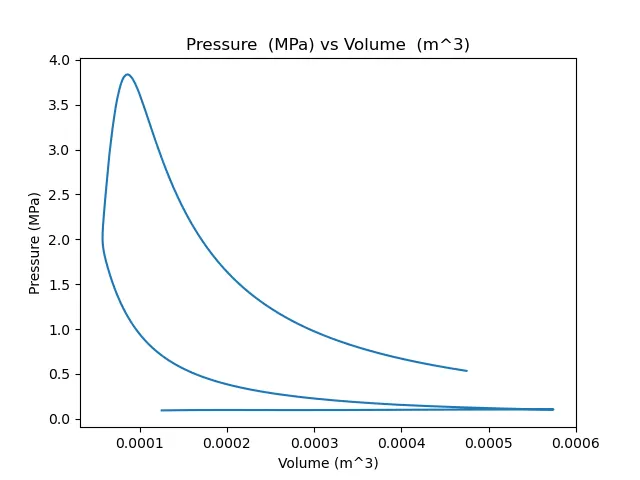
Calculate the area under the P-V diagram, the power output of this engine, and specific fuel consumption. The program shall calculate the area under the PV diagram using both the trapezium and Simpson's rule and then power is calculated from it.
Concepts involved:
Area= Area under the P-V curve= Work done per cycle (MJ)
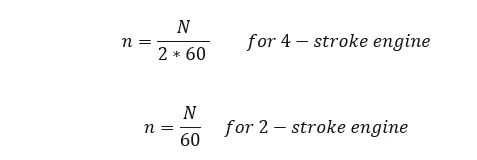
Where, n= Number of cycles per second
Where, N= Rotations per min

Given Data:
Assume that:
1.RPM is 1500.
2. This engine consumed 20 micrograms of fuel (per 1 stroke cycle).
Given output filename= "engine_data.out"
Solutions:
Compatibility Check:
Input:
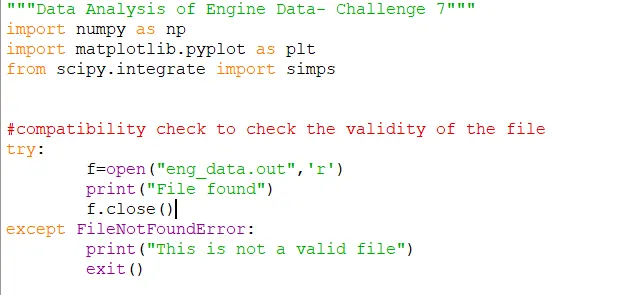
Output:
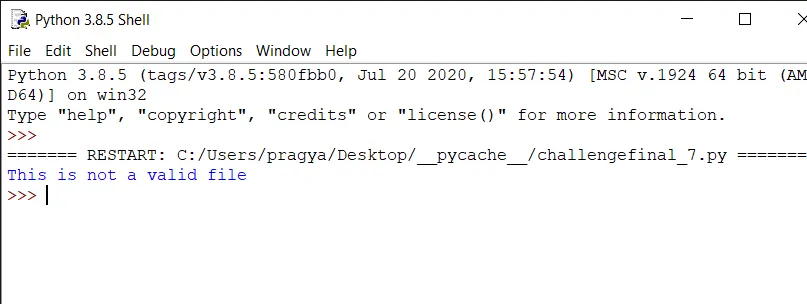
Input:
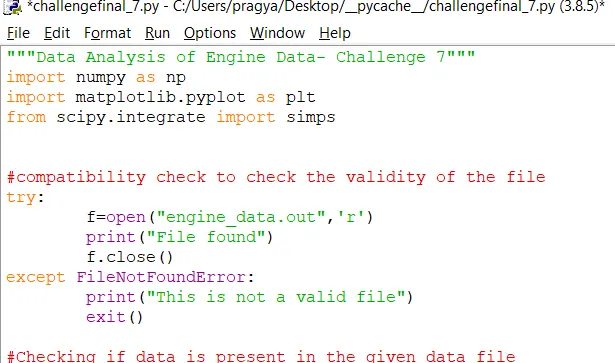
Output:
Code:
"""Data Analysis of Engine Data- Challenge 7"""
import numpy as np
import matplotlib.pyplot as plt
from scipy.integrate import simps


#compatibility check to check the validity of the file
try:
	f=open("engine_data.out",'r')
	f.close()
except FileNotFoundError:
	print("This is not a valid file")
	exit()

#Checking if data is present in the given data file
i=0
for line in open("engine_data.out"):
	if '#' not in line:
		break
	i=i+1

j=0
for line in open("engine_data.out"):
	j=j+1
	if j>1:
		break
if j==1:
	print("no data present in the file")
	exit()

#Data extraction process
i=0
for line in open ("engine_data.out"):
	if i==2:
		c=line.split()
		i=0
		break
	if i==1:
		b=line.split()
		i=i+1
	if 'column' in line.split():
		a=line.split()
		i=1

a.remove("column")
a.remove("#")
a=np.array(a, dtype=np.int)
b.remove("#")
c.remove("#")
num_col=len(a)

#Getting Data
num_data=0
data=np.arange(0,num_col)
for line in open("engine_data.out"):
	if '#' not in line :
		d=line.split()
		d=np.array(d, dtype=np.float32)
		data=np.vstack([data,d])
		num_data=num_data+1
data=np.delete(data,0,0)

#Data visualizer
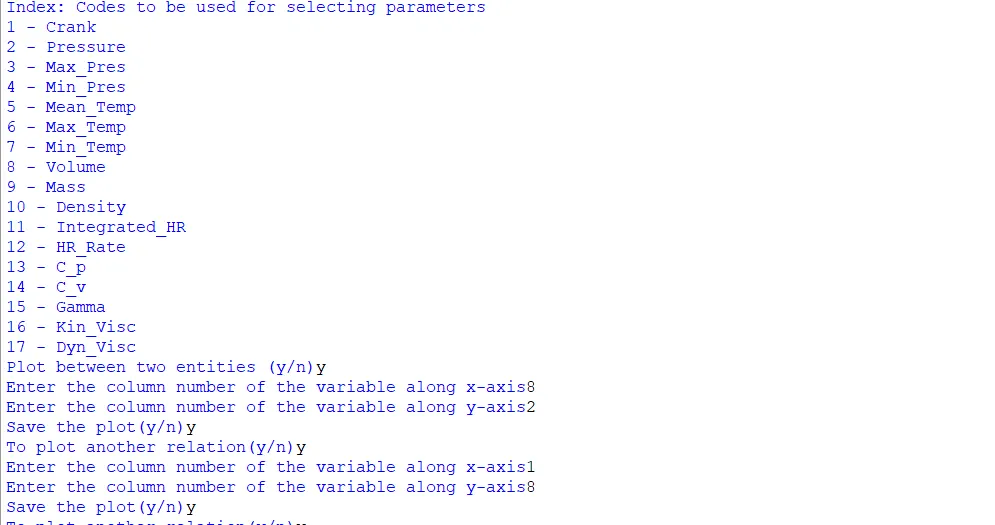
print('Index: Codes to be used for selecting parameters')
for i in a:
	print('{} - {}'.format(i,b[i-1]))
x='y'
x=input("Plot between two entities (y/n)")
while(x=='y'):
	h=input("Enter the column number of the variable along x-axis")
	j=input("Enter the column number of the variable along y-axis")
	h=int(h)
	j=int(j)
	plt.figure()
	plt.plot(data[:,h-1],data[:,j-1])
	plt.xlabel('{} {}'.format(b[h-1],c[h-1]))
	plt.ylabel('{} {}'.format(b[j-1],c[j-1]))
	plt.title('{}  {} vs {}  {}'.format(b[j-1],c[j-1],b[h-1],c[h-1]))
	z="n"
	z=input("Save the plot(y/n)")
	if(z.lower()=='y'):
		plt.savefig("{}-{}.png".format(b[j-1], b[h-1]))
	plt.show()
	print
	x=input("To plot another relation(y/n)")

x='n'
x=input("Plot variation of a parameter (y/n)")
while(x.lower()=='y'):
	n= input("Enter the column number of the varible")
	n=int(n)
	plt.figure()
	plt.plot(np.arange(0,num_data), data[:, n-1])
	plt.xlabel('Data')
	plt.ylabel('{} {}'.format(b[n-1],c[n-1]))
	plt.title('{}  {} '.format(b[n-1],c[n-1]))
	z="n"
	z=input("Save the plot(y/n)")
	if(z.lower()=='y'):
		plt.savefig("{}.png".format(b[n-1]))
	plt.show()
	x=input("Plot another variation? (y/n)")


#Basic performance calculation

print('PERFORMANCE OF ENGINE')
m=[i.lower() for i in b]
pressure_column=m.index('pressure')
volume_column=m.index('volume')
pressure=data[:,pressure_column]
volume=data[:, volume_column]
Area=0
Area=simps(pressure,volume,even='first')*np.power(10,6)
RPM=input("RPM of Engine")
f=input("Value of fuel consumed pe cycle in micro-grams:")
RPM=float(RPM)
f=float(f)
n=RPM/(2*60)
P=Area*n
f=(f*n*3600)/np.power(10,9)
s= (f*1000)/P
print("Area under the P-V curve i.e work done per cycle={} J". format(Area))
print("Power output at {} RPM={} W".format(RPM,P))
print("Specific fuel consumption = {} kg/kW.hr".format(s))
Output:
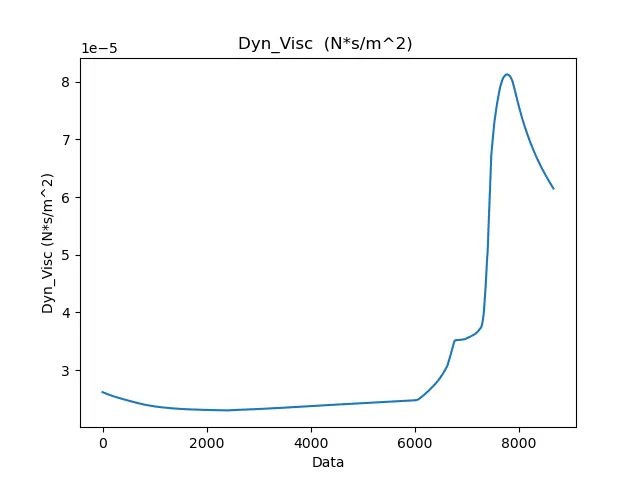
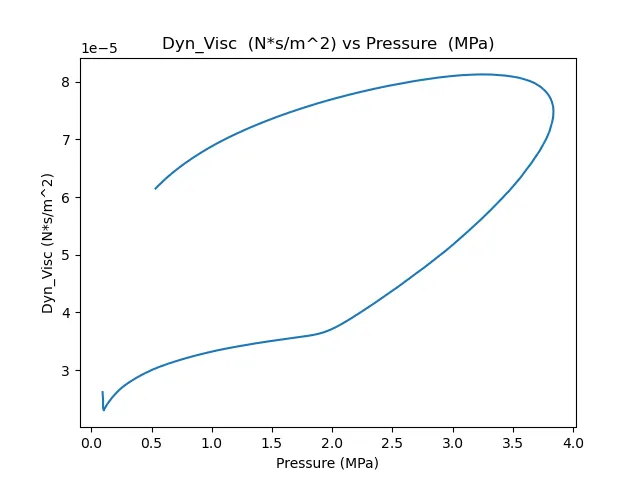
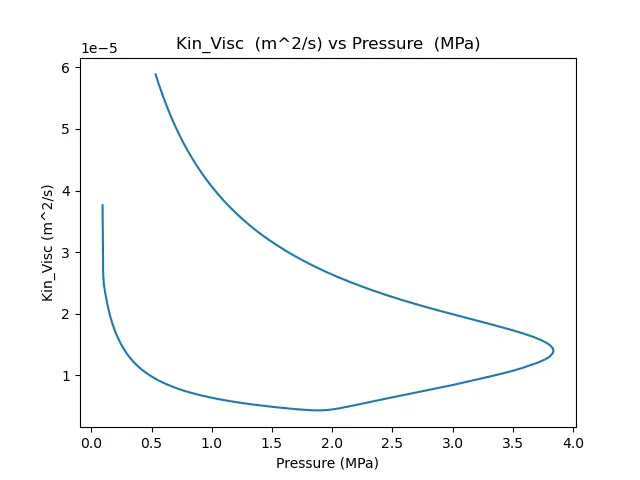
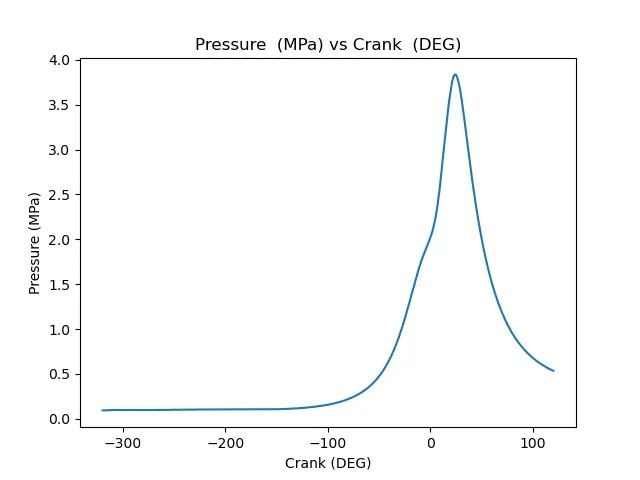
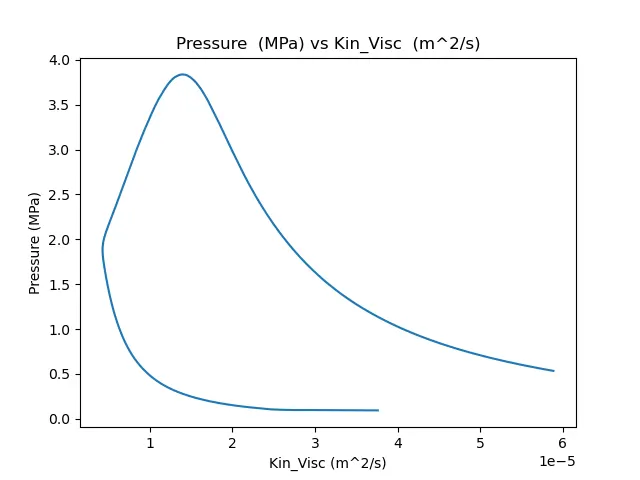
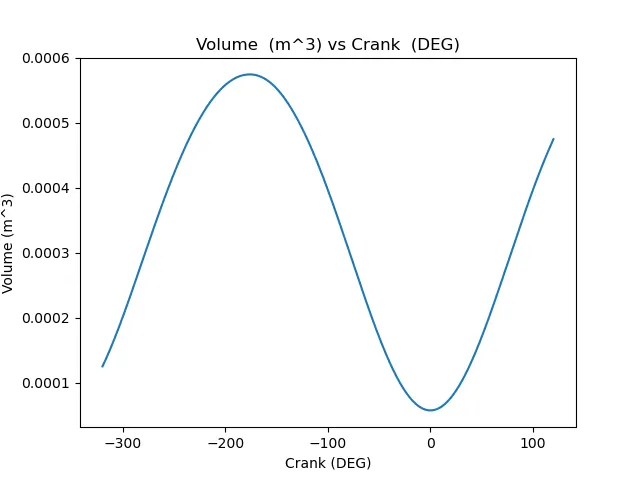
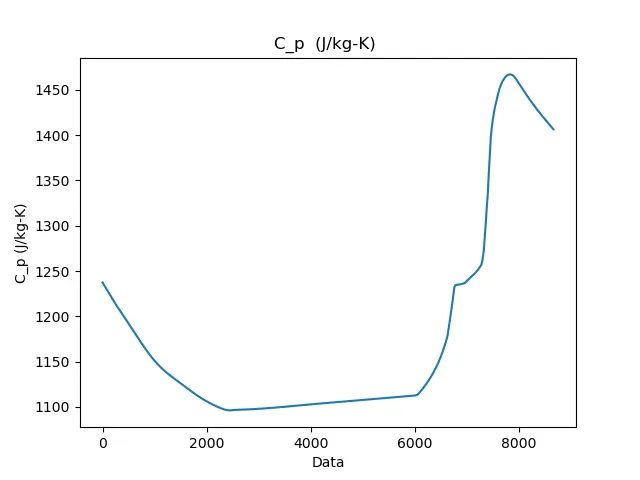
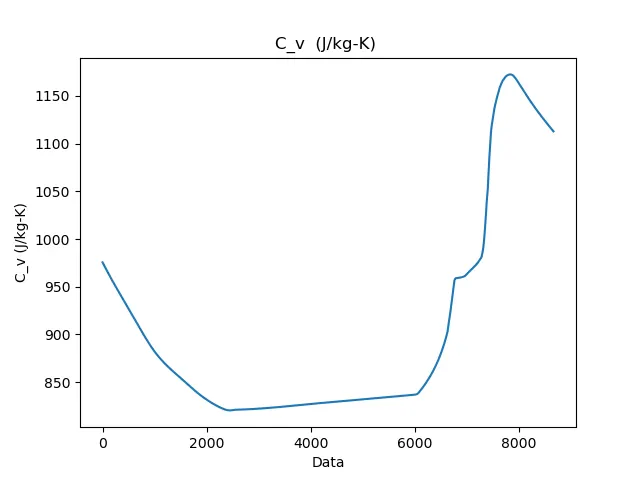
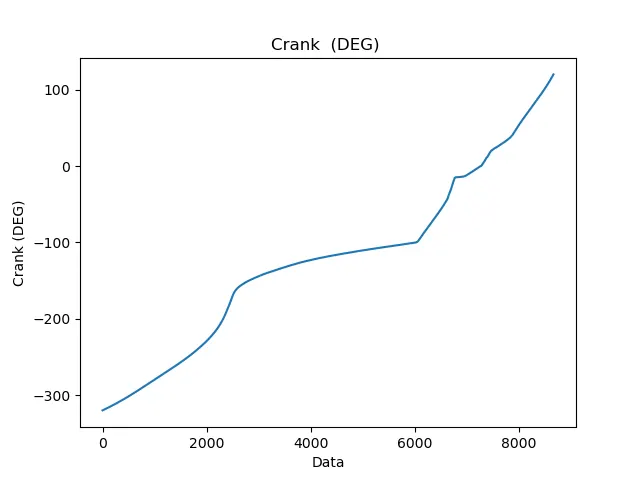
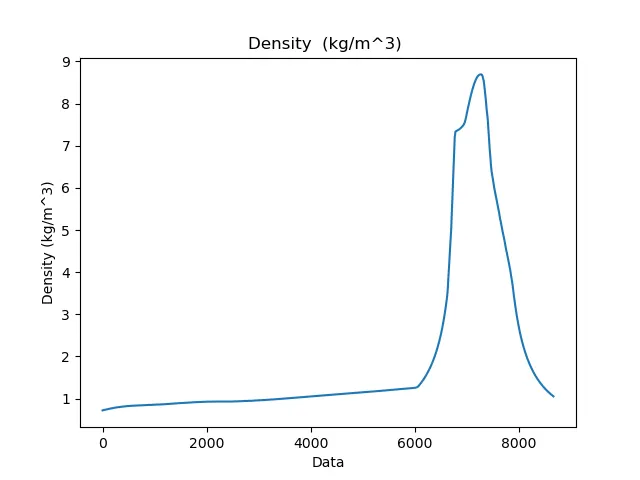
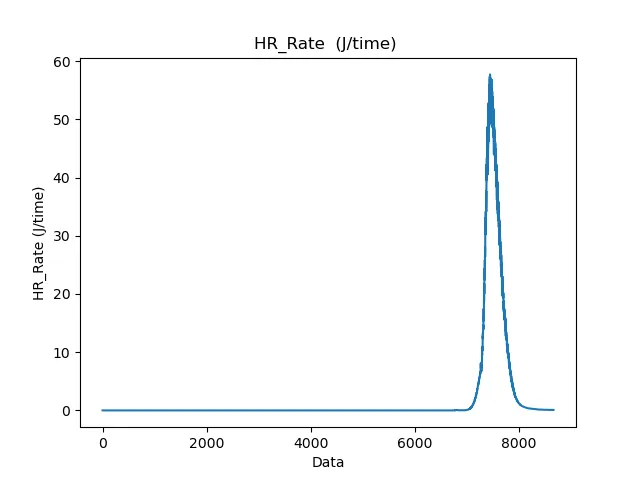
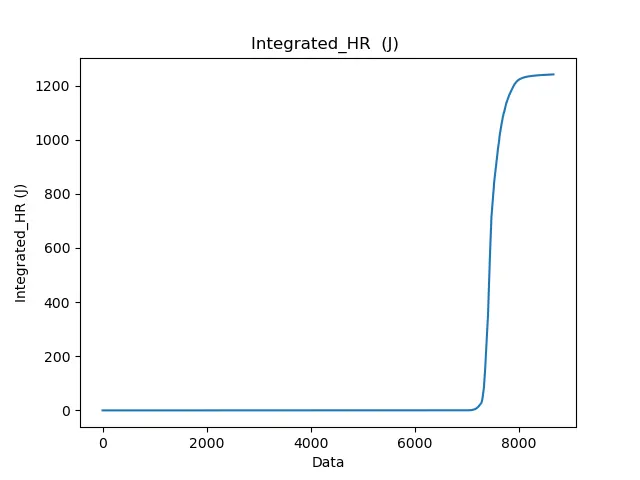
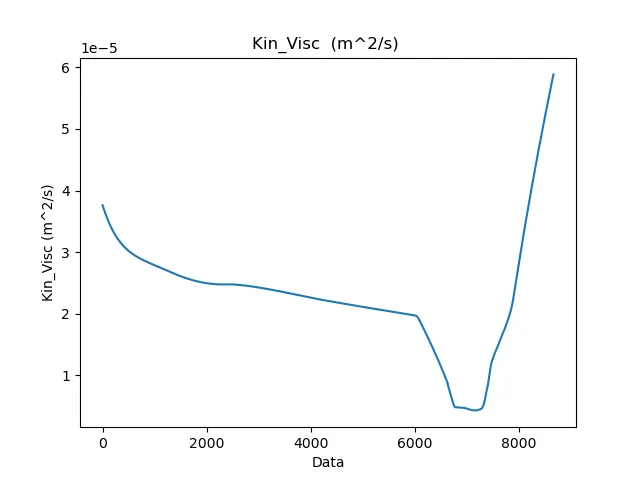
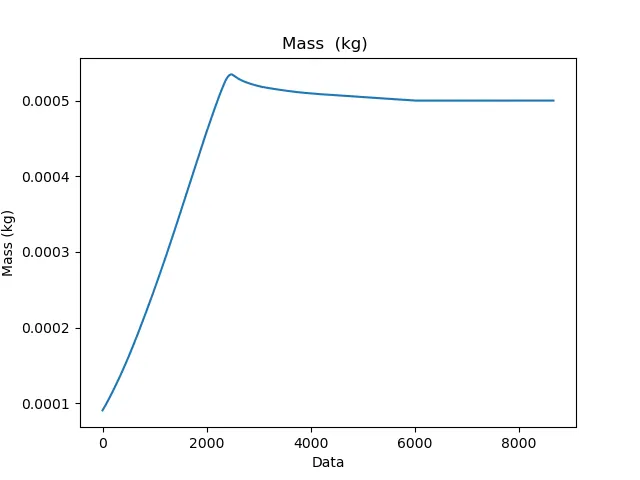
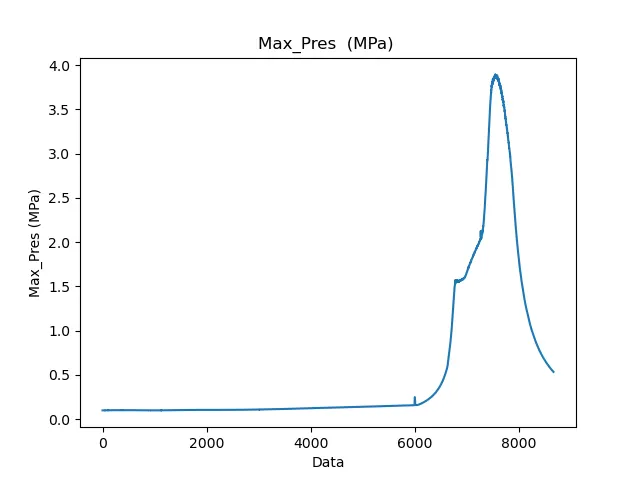
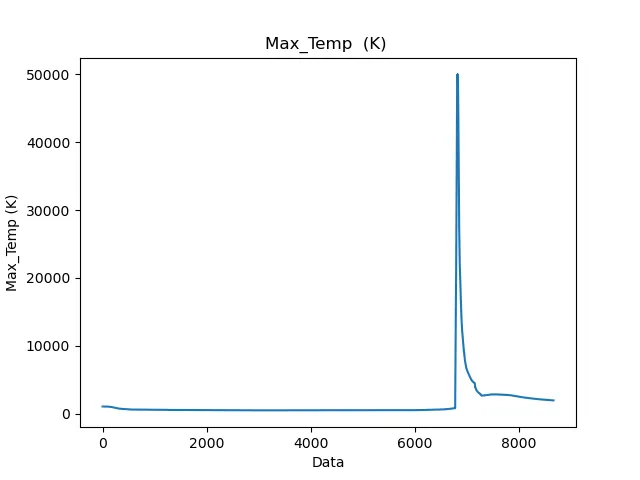
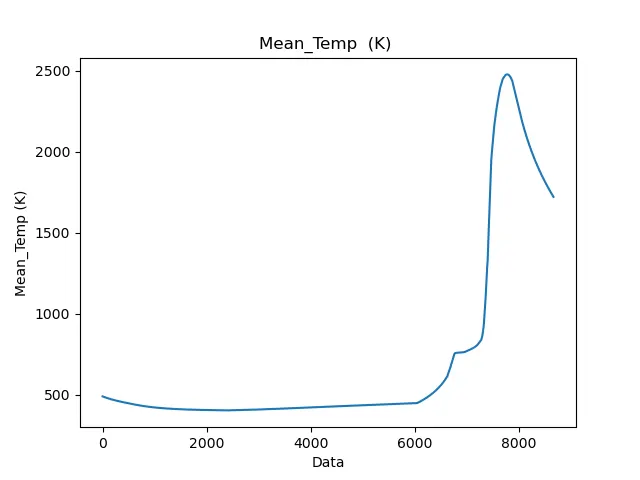
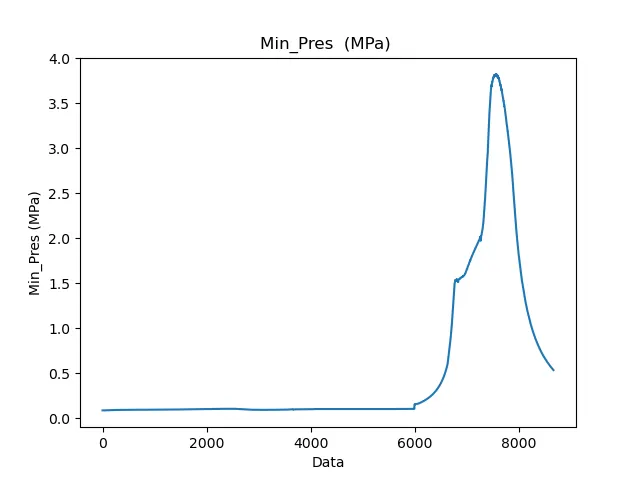
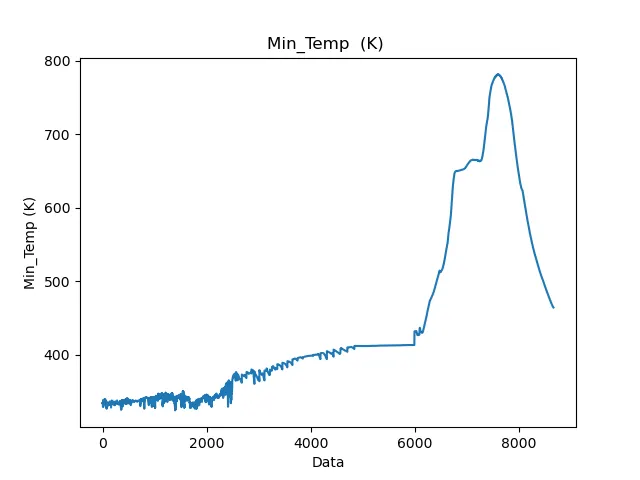
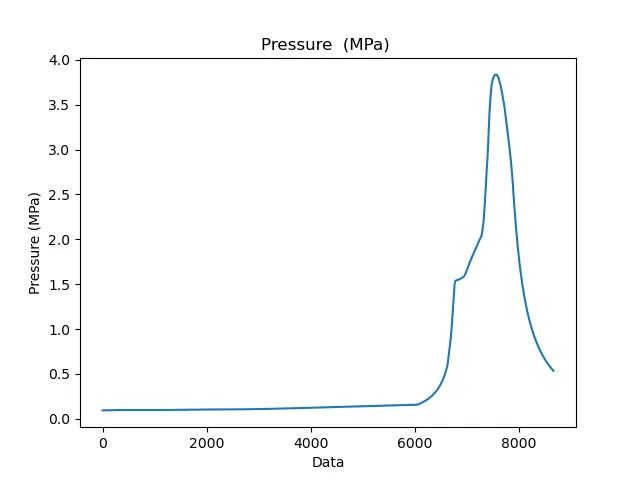
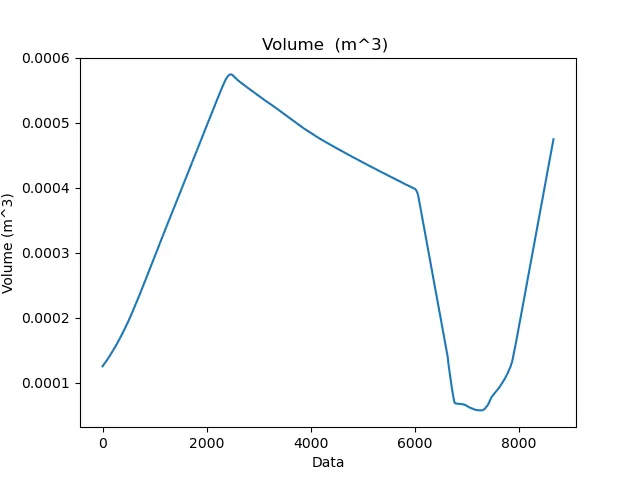
Engine Performance:
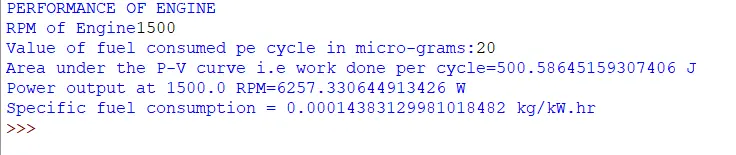
Result:
Work done per cycle= 500.586451 J
Power output= 6257.330644 W
Specific fuel consumption= 0.0001438312 kg/kW.hr