Week 6 : Consider the following engine parameters for a typical 4-cylinder engine. (DHEV)
Q1. Consider the following engine parameters for a typical 4-cylinder engine.
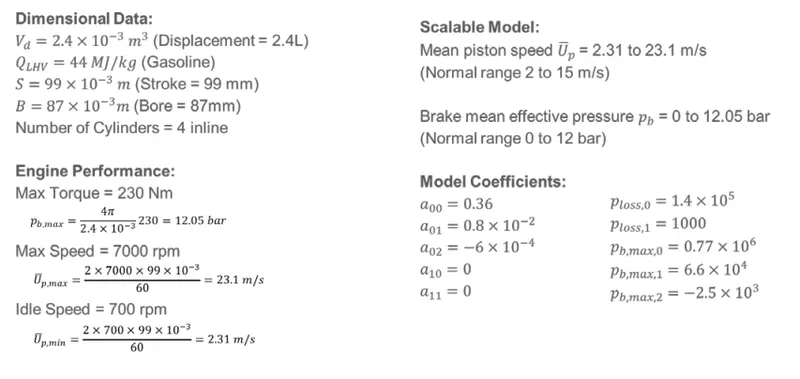
Using the Willans line model, generate the engine efficiency map, fuel consumption map and max torque curve. Plot the maps with engine speed on x-axis and engine brake torque on y-axis, and the efficiency and fuel consumption points represented using contour lines (contour function in Matlab). Also plot the peak torque and power curves with engine speed on x-axis and brake torque and power on y-axis respectively.
close all
clear all
clc

% Engine Parameter
vd = 2.4*10^-3;
B = 87*10^-3;
Q = 44*10^6;
k = 4;
S = 99*10^-3;
N = linspace(700,7000,20);
Z = 1;
% Expression Constant
a00 = 0.36 ;
a01 = 0.8*10^-2;
a02 = -6*10^-4;
a10 = 0;
a11 = 0;
pl0 = 1.4*10^5;
pl1 = 1000;
pb0 = 0.77*10^6;
pb1 = 6.6*10^4;
pb2 = -2.5*10^3;

% Calculate of Mean piston Speed
Up = (2*N.*S)./60;

% Calculating efficiency , brake pressure and pressure loss
pl = pl0+pl1.*Up.^2;
eff =(a00+a01*Up+a02.*Up.^2);
pb = pb0+pb1*Up+pb2.*Up.^2;
pa = (pb+pl)./eff;

% Torque Calculation
T = (pb * vd)./12.56; % Brake Torque generated by Engine

% Power calculction
Pb = (4.*pb*vd.*N)./(2*60000); % Brake Power
Pl = (4.*pl*vd.*N)./(2*60000); % Power Loss
Pa = (4.*pa*vd.*N)./(2*60000); % Available Power

% Fuel Consumption
w = 3.14*Up./S;
mf = ((pa.*vd.*w)./Q*4*3.1);

% Potting

figure (1)
title('Power and Torque Curve')
hold on
yyaxis left
plot(N,T,'DisplayName','Torque Curve');
xlabel('Engine Speed in RPM')
ylabel('Torque in Nm')
yyaxis right
plot(N,Pb,'DisplayName','Power Curve')
ylabel('Power in kW')
grid on

figure (2)
title('Fuel Consumption Vs Efficiency')
hold on
plot(mf,eff);
xlabel('Fuel Consumption')
ylabel('Efficiency*100')
grid on

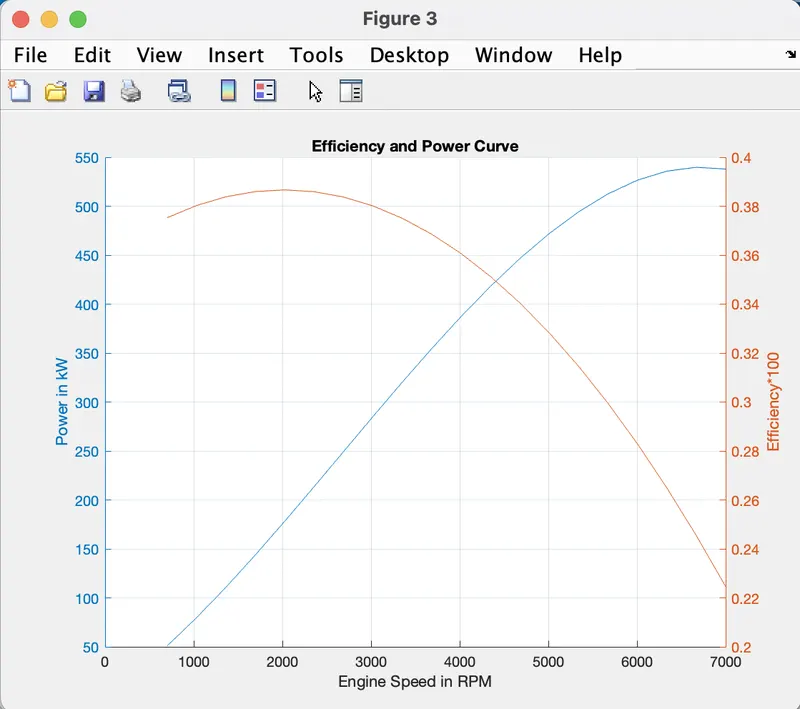
figure (3)
title('Efficiency and Power Curve')
hold on
yyaxis left
plot(N,Pb,'DisplayName','Power Curve')
xlabel('Engine Speed in RPM')
ylabel('Power in kW')
yyaxis right
plot(N,eff,'DisplayName','Efficiency Curve');
ylabel('Efficiency*100')
grid on

% figure (4)
% meshgrid(Pb,T)
% grid off
% contour (Pb,T,N,eff,mf,Z);
% colorbar
% xlabel('Engine Speed in RPM')
% ylabel('Engine Braking Torque')
% title('Contour Plot')
% hold on
Explantion :
- From the Given Data we take the values and Formula
- Which are to be calculated to plot curves and get result values.
- Also plotting curves using values obtained from calculating using formulas
- Plotting Power, Efficiency, Torque and Fuel Consumption.
- The Plotted Graphs are shown below.
Plotting :
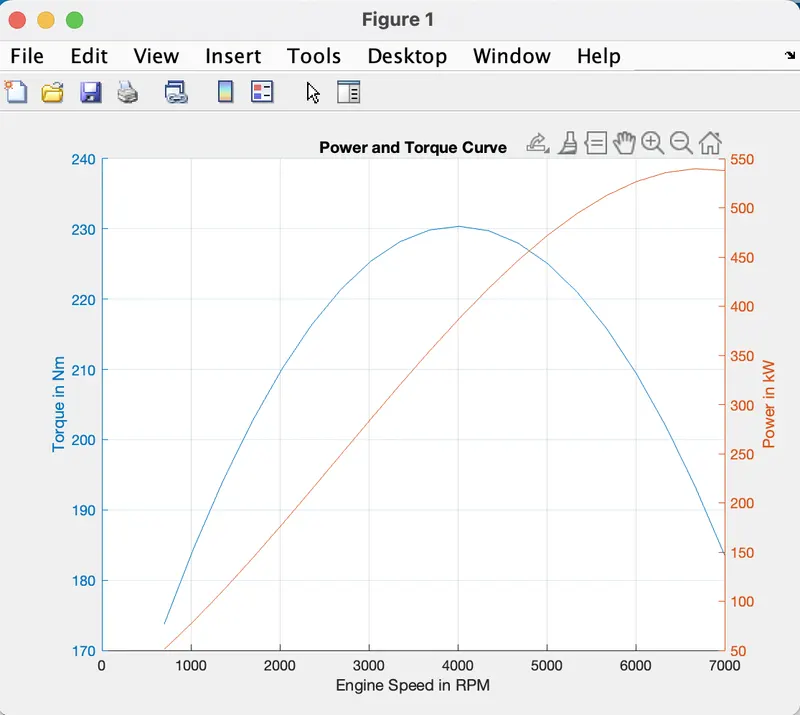
i. Power and Torque Curve :
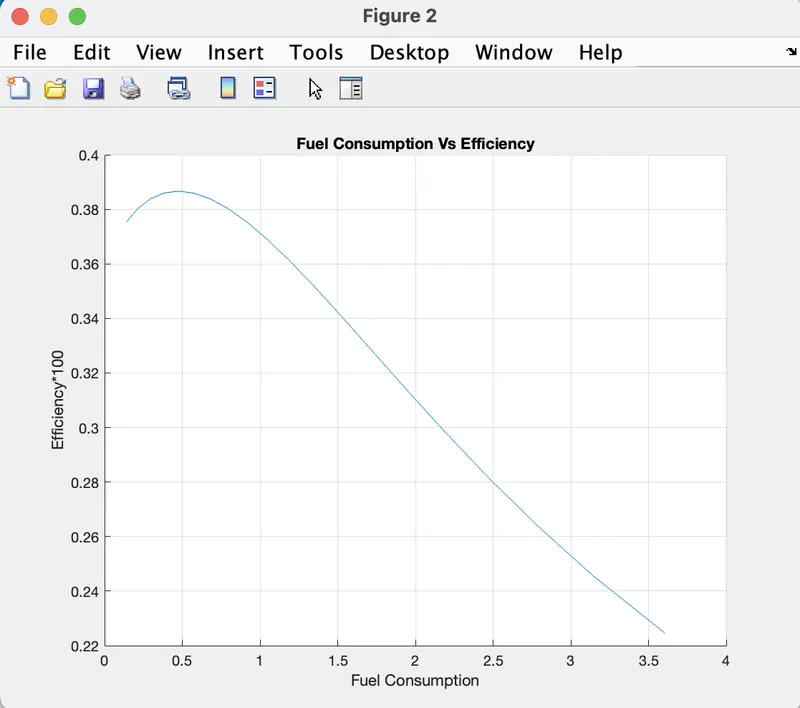
ii. Fuel Consumption Vs Efficiency Curve :
iii. Efficiency And Power Curve :