Week 6: Conjugate Heat Transfer Simulation
Baseline configuration
- Setup a flow simulation through a pipe
- Inlet Reynolds number should be 7,000
-
HINT : Use the below formula to calculate velocity for corresponding value of REYNOLD NUMBER and give DIRICHLET BC for velocity at inlet and specify the value for velocity calculated at INLET BC using below formula ,
Re = (rho*V*D)/(Dynamic viscosity)
-
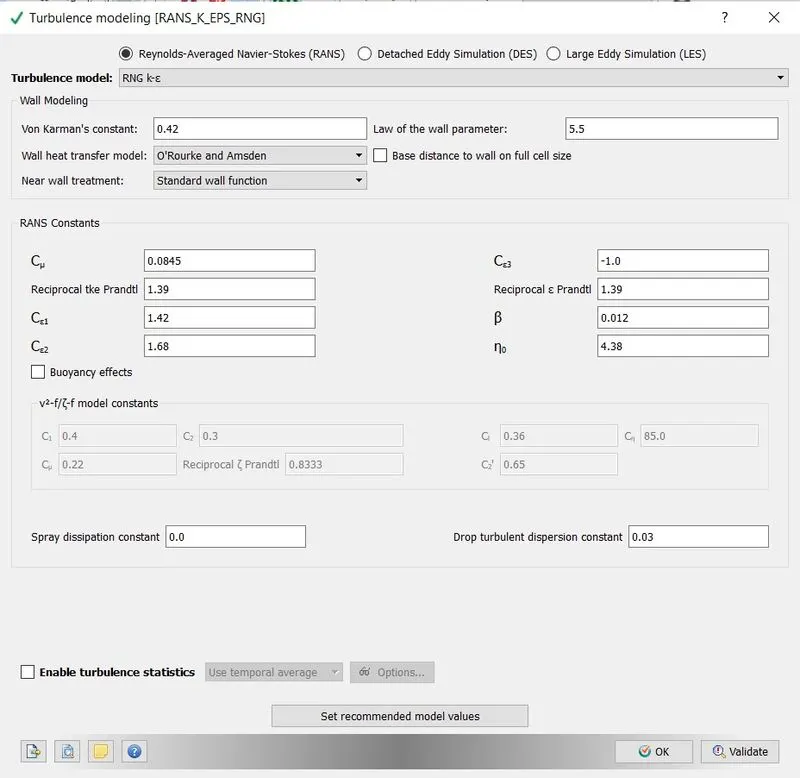
- Turbulence modelling - K-Epsilon
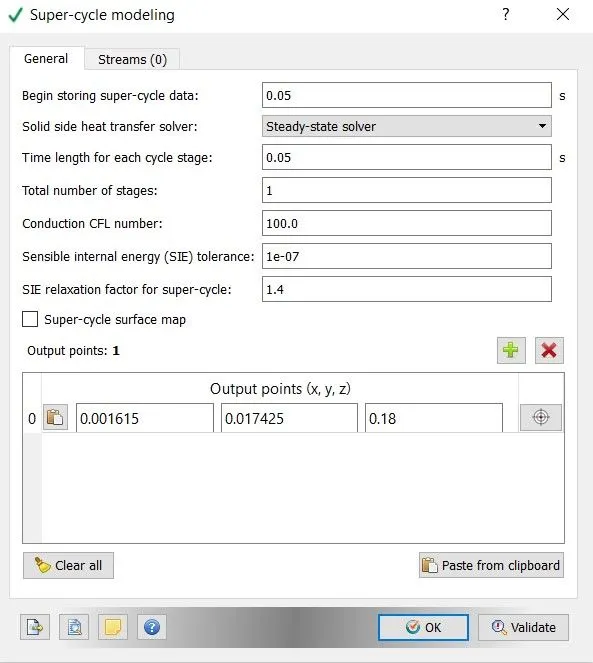
- Supercycling parameters - same as in the video
Additional 3D outputs
- Add Y+ to your post.in file
Grid dependence test
- Start with an initial base grid
- Run grid dependence test on 3 grids and show that the outlet temperature converges to a particular value
Effect of supercycle stage interval
- Set supercyle stage interval to 0.01,0.02 and 0.03
- For these three values, how does the total simulation time compare against the baseline configuration
Geometry:
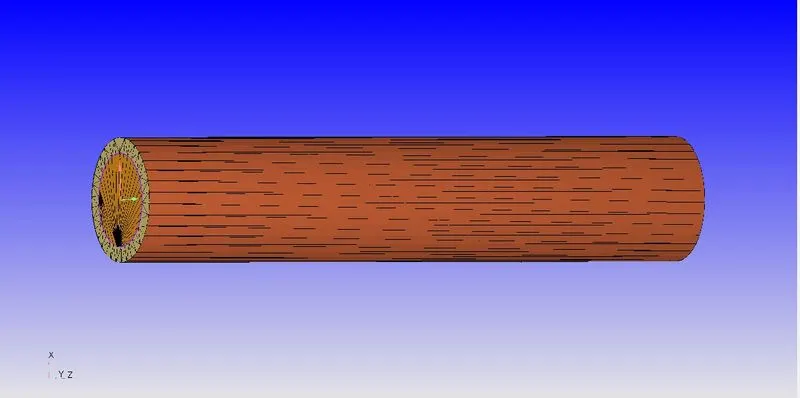
A cyliderical pipe is made to run the CHT stimualtion. The cylinderincal pipe is made using create==> cylinder option in converge.
Internal diameter: 0.015m
External diameter: 0.02m
Length: 0.2m
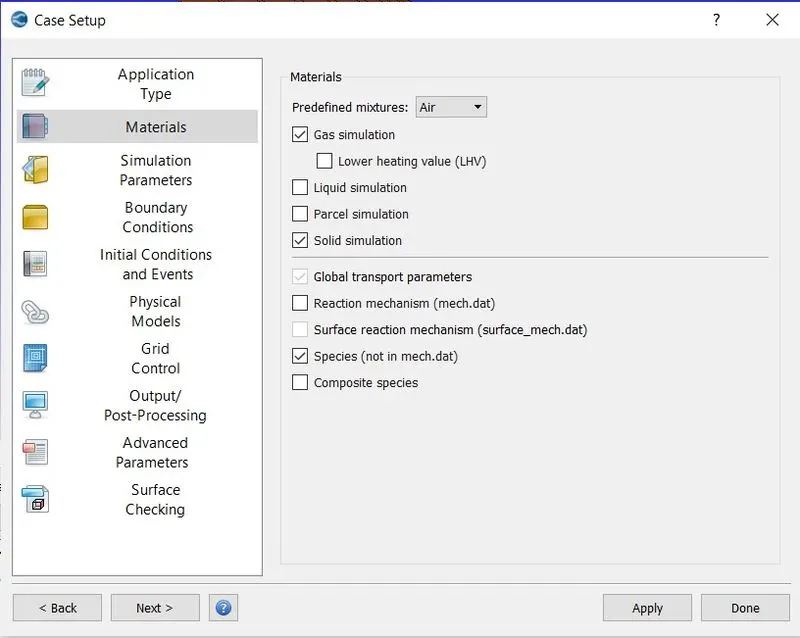
Material Case setup:
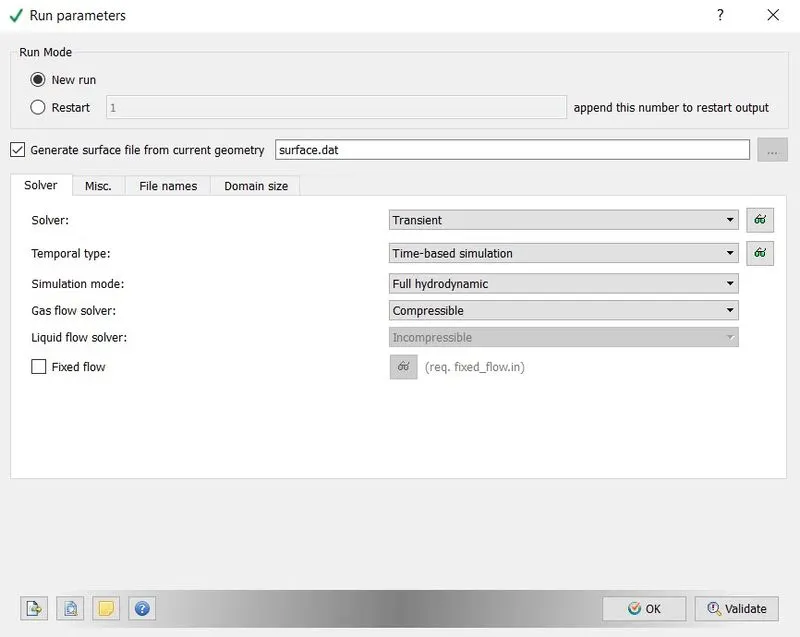
Run Parameters:
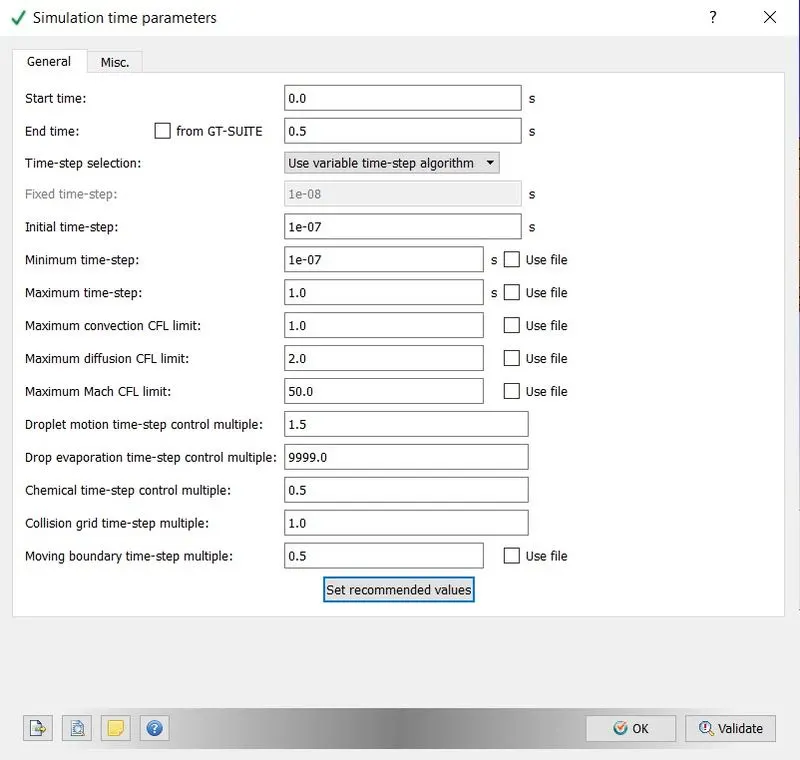
Stimulation time Parameters:
Boundary Condition:
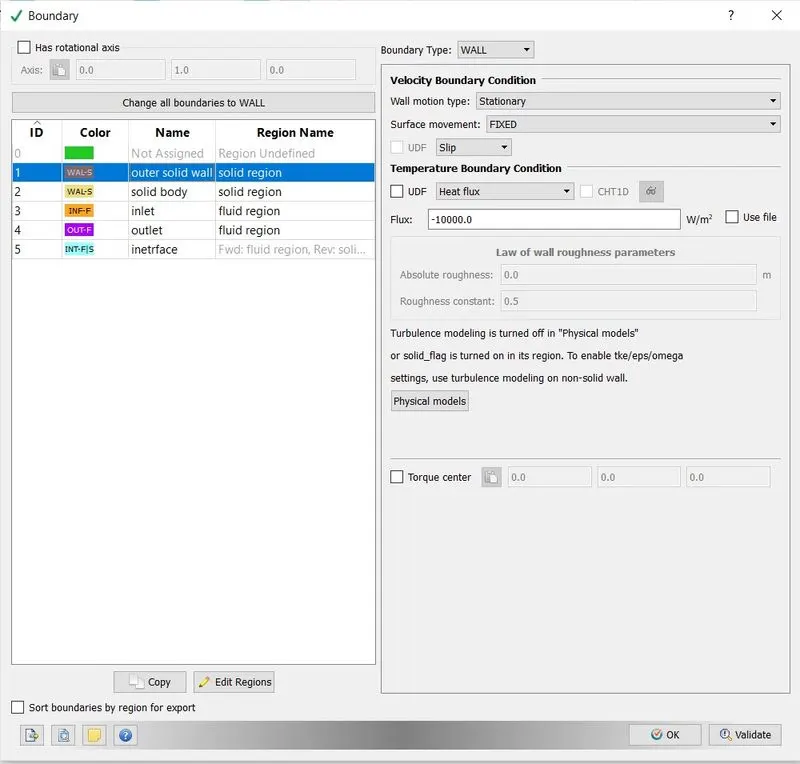
Inlet:
Calcuation:
Re = 7000
rho = 1.161Kgm^3
Inlet diameter = 0.015m
Dynamic viscosity = 1.846e-5 Kgm^-1s^-1
Implementing in formula given:
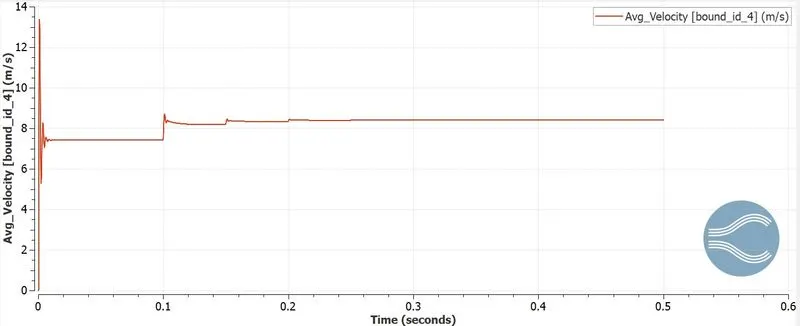
velocity = 7.42ms^-1
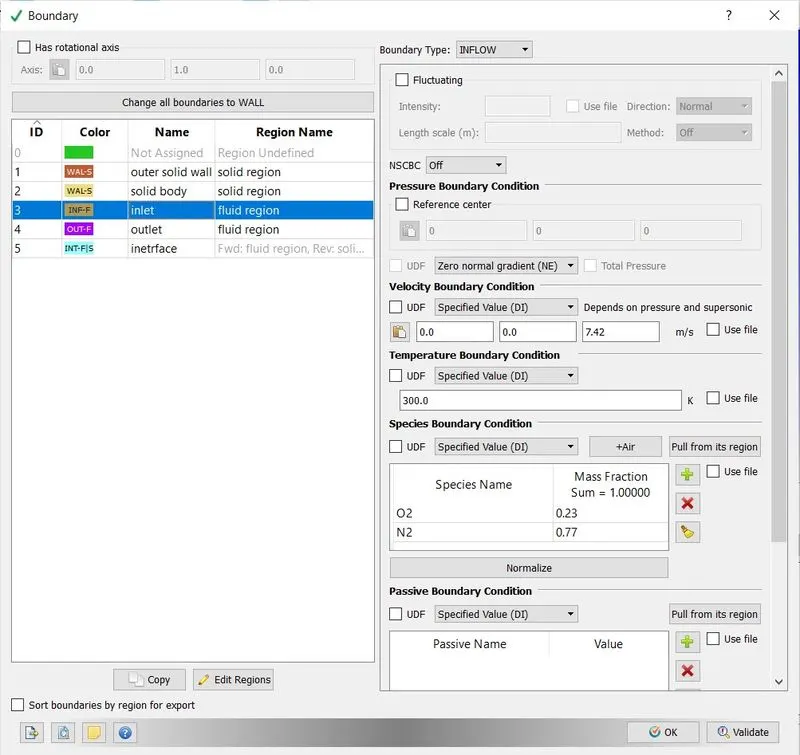
Interference BC forward:
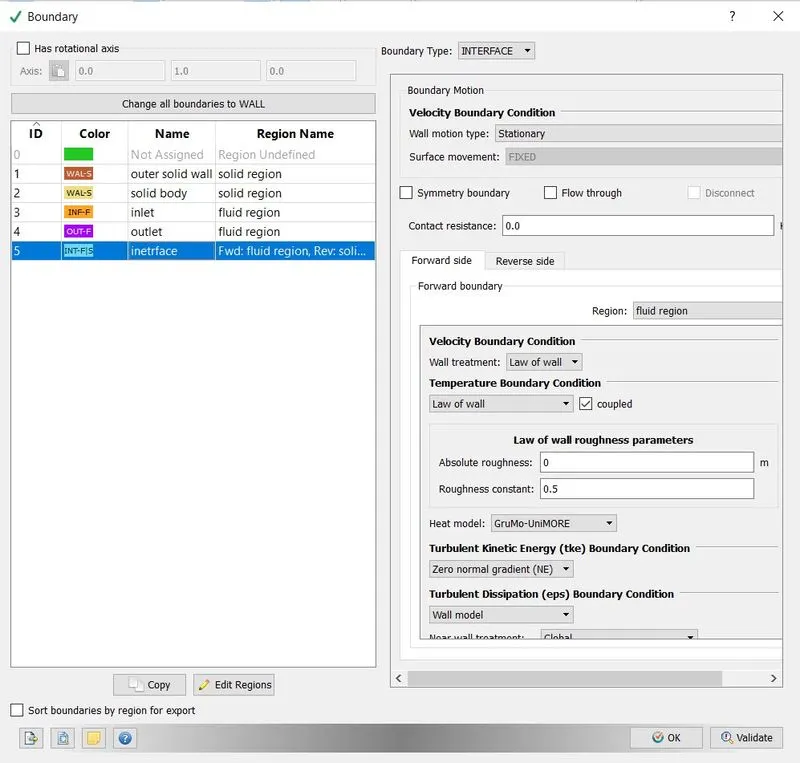
Interference BC Backward:
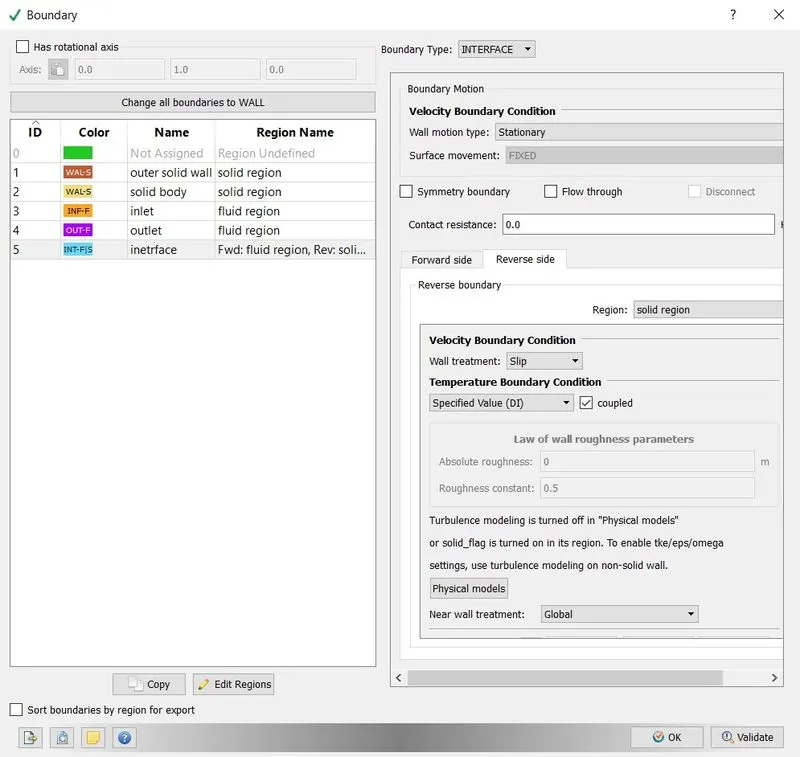
Fluid region:
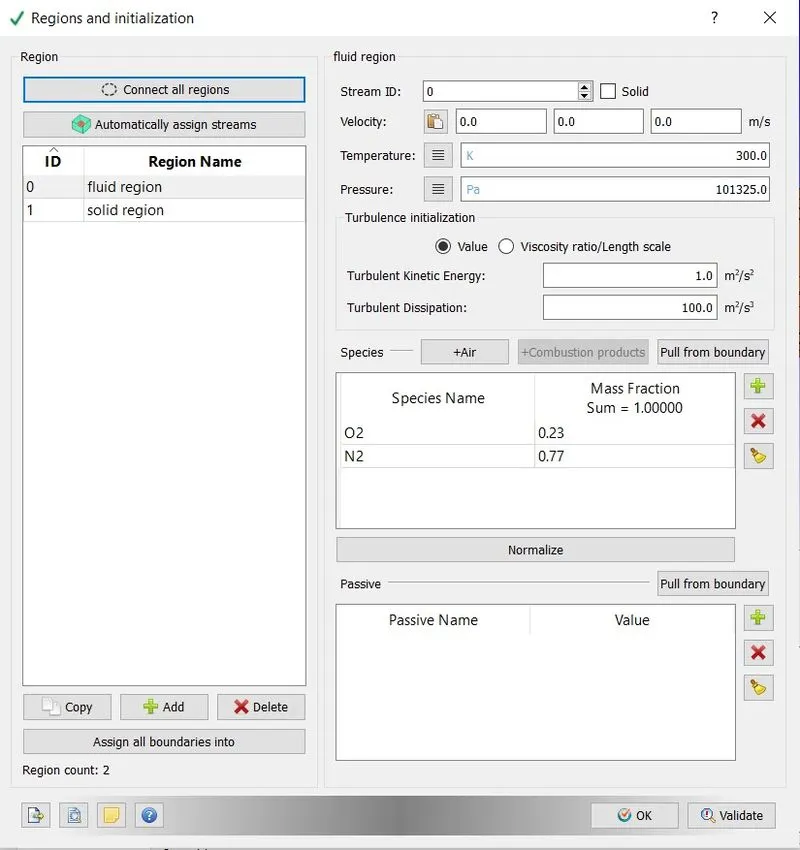
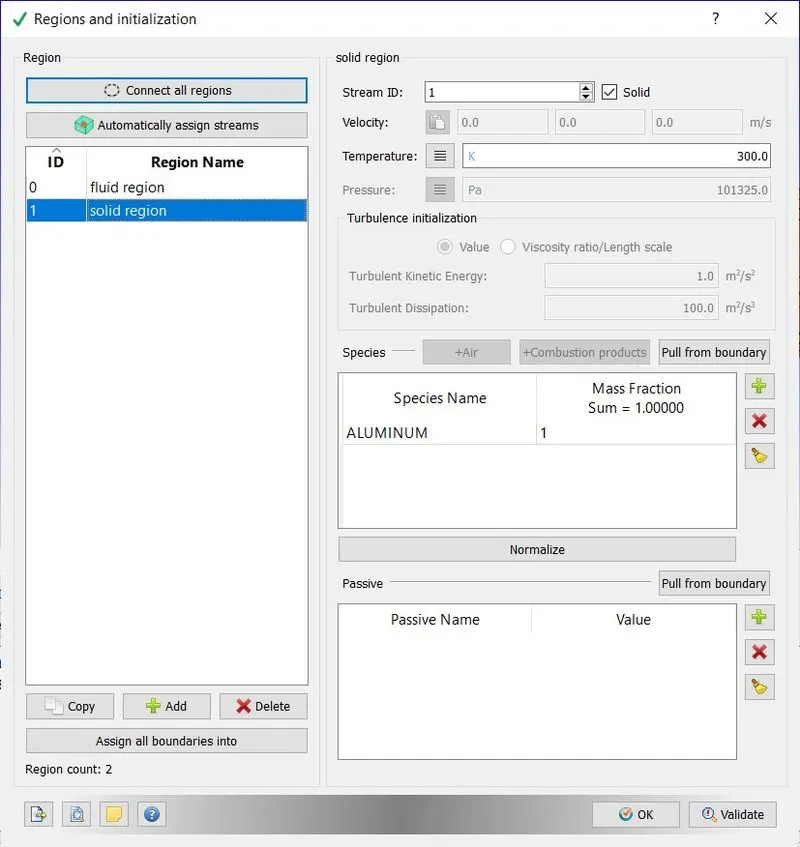
Solid region:
Turbulance model:
Supercycling parameters:
Results:
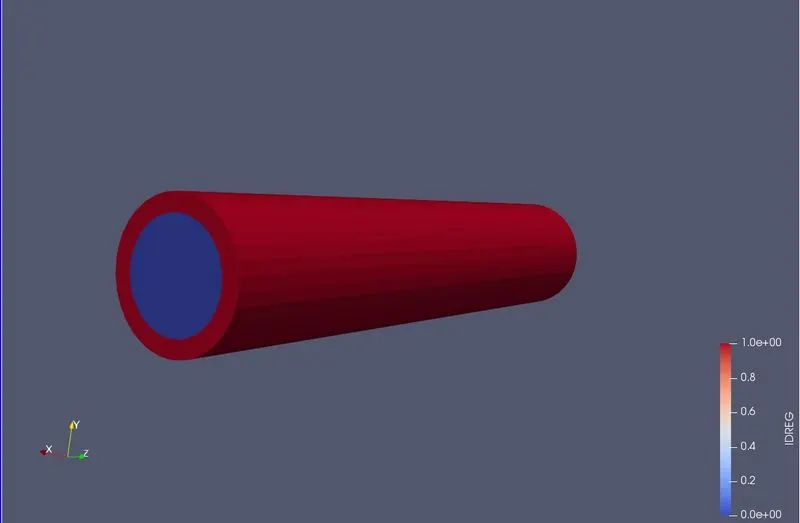
Region ID solid:
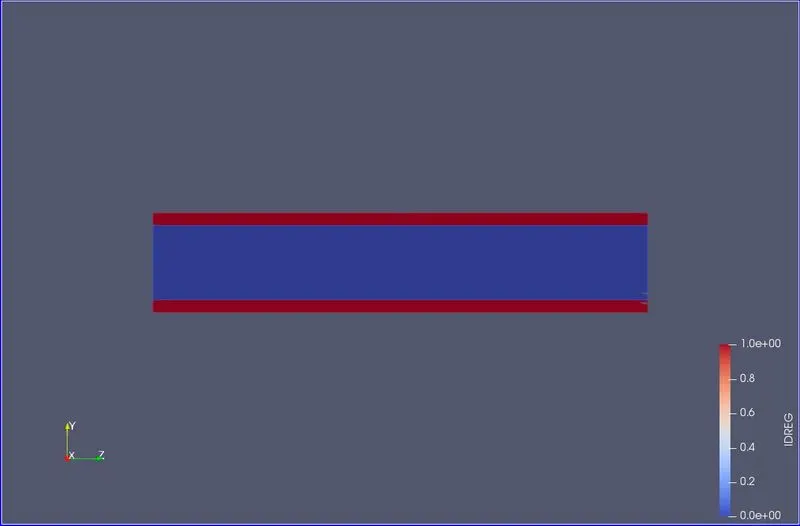
Region ID 2D:
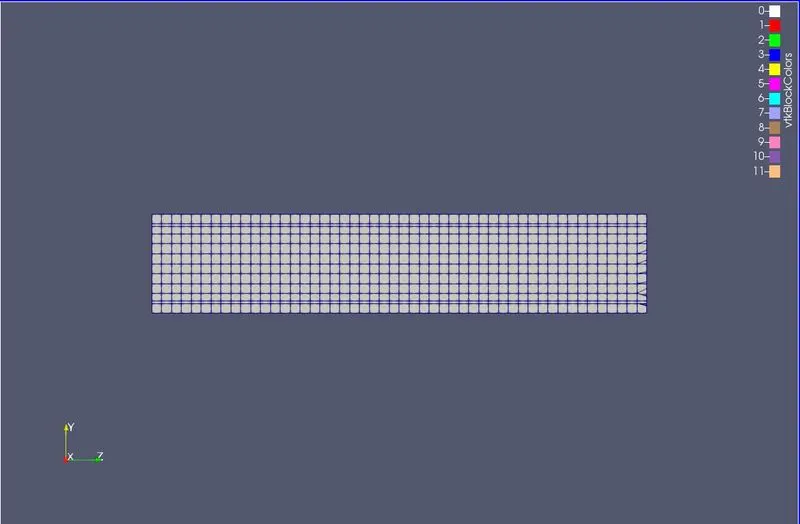
Case: Base grid(0.004m) & supercycle stage interval = 0.05
Mesh:
Velocity plot:
Velocity Contour:
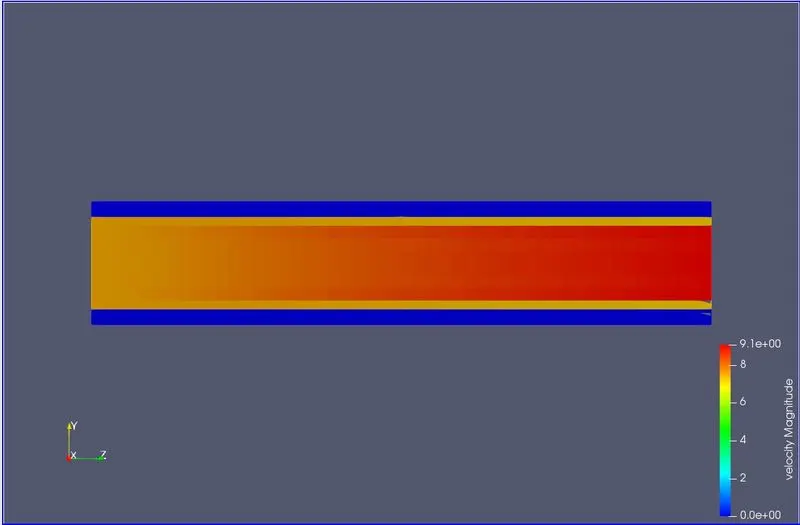
Velocity animation:
Pressure plot:
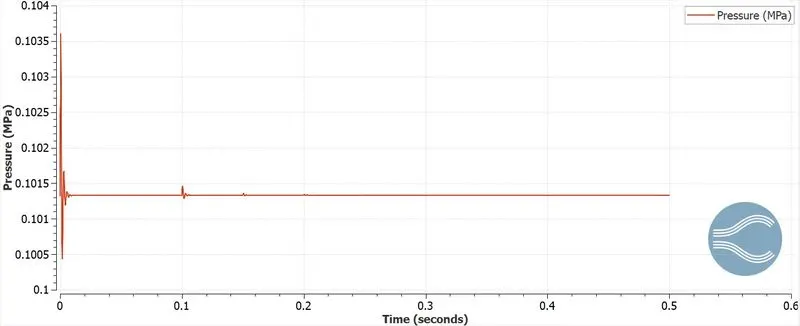
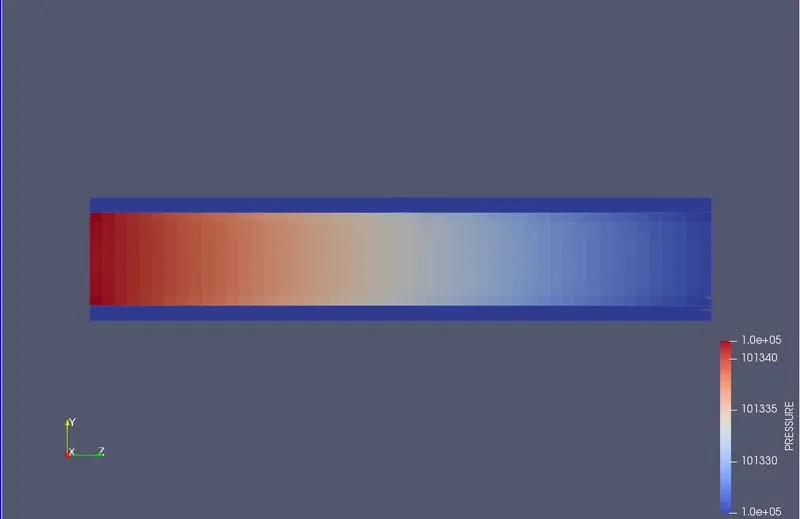
pressure contour:
Temperature plot:
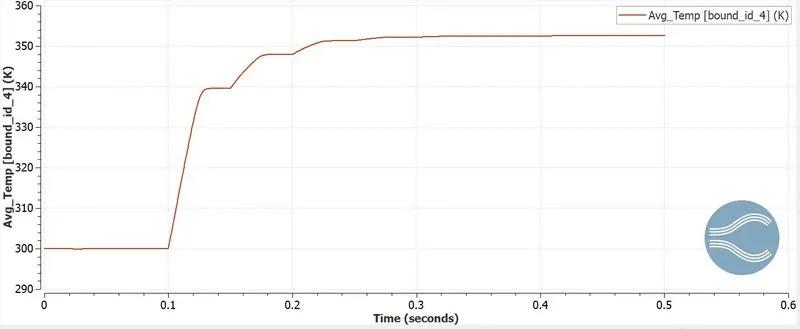
Temperature contour:
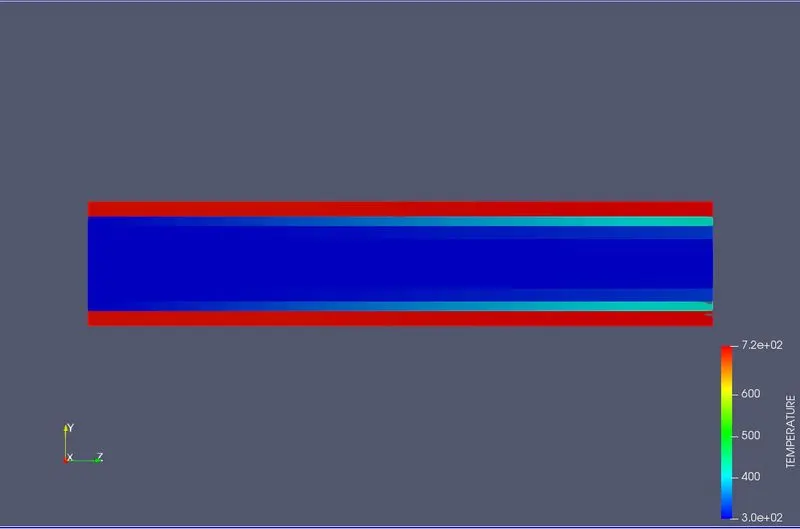
Temperature animation:
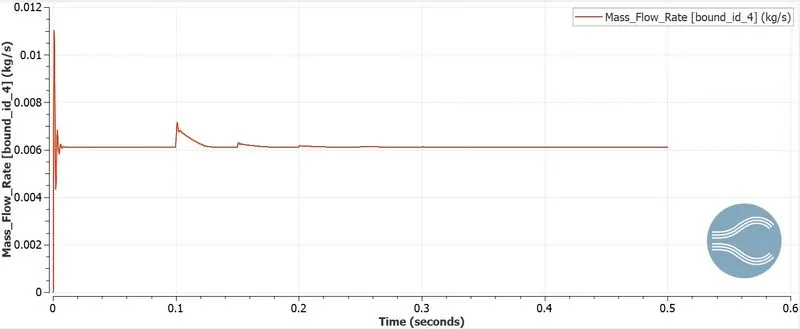
Mass flow rate plot:
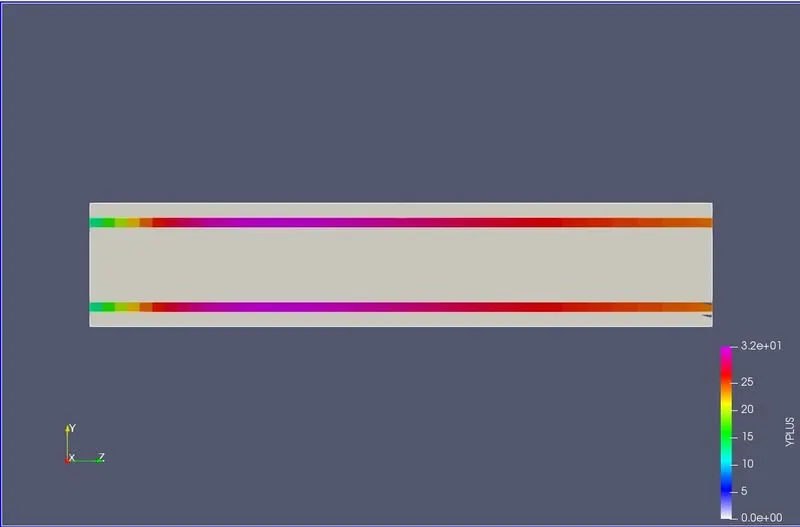
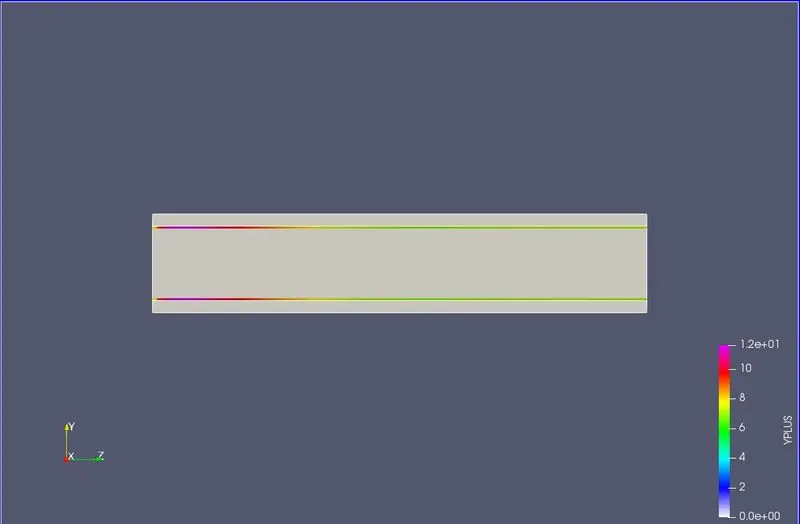
Y+ contour:
Case:grid=0.003m & supercycle stage interval = 0.05
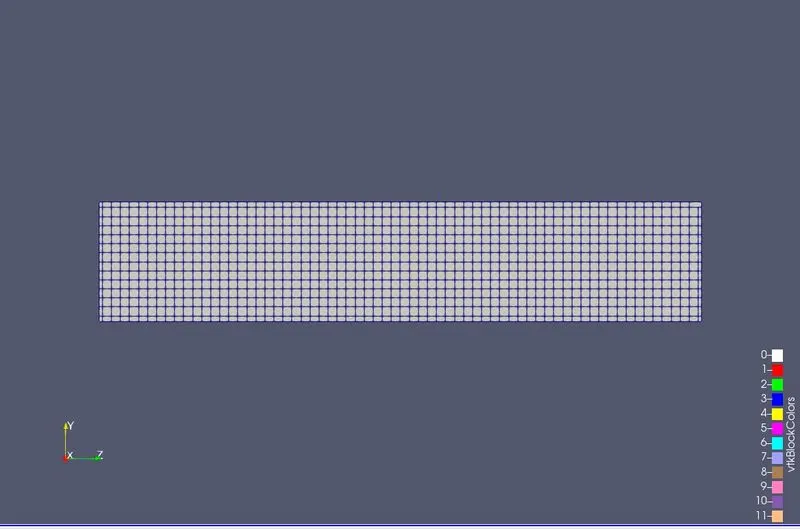
Mesh:
Velocity plot:
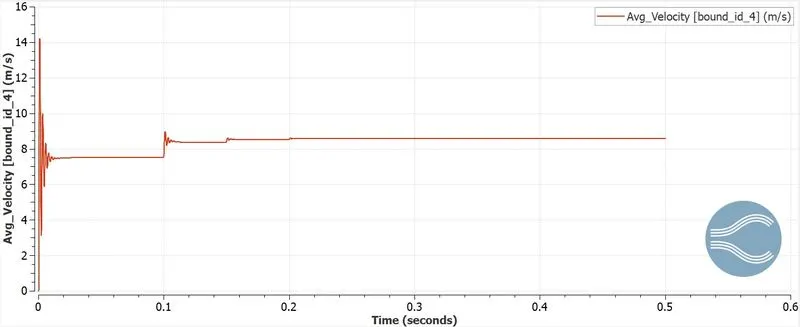
Velocity Contour:
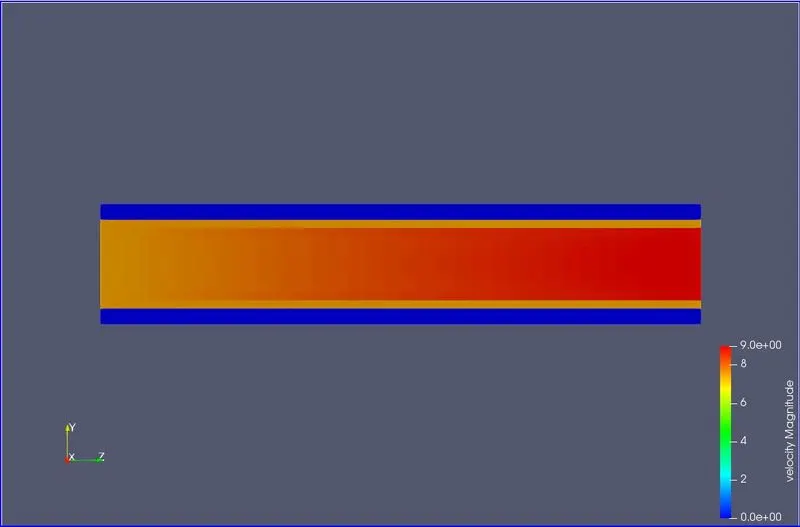
Velocity animation:
Pressure plot:
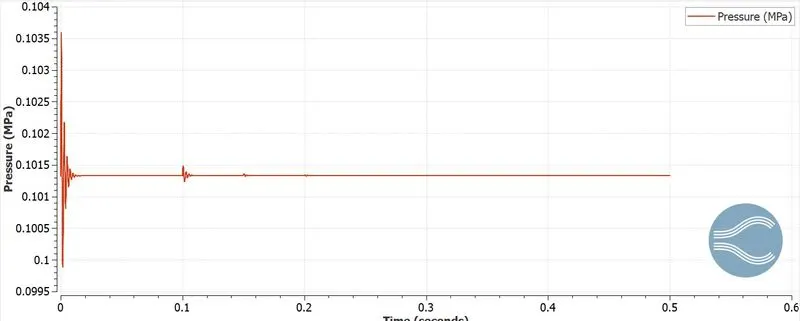
pressure contour:
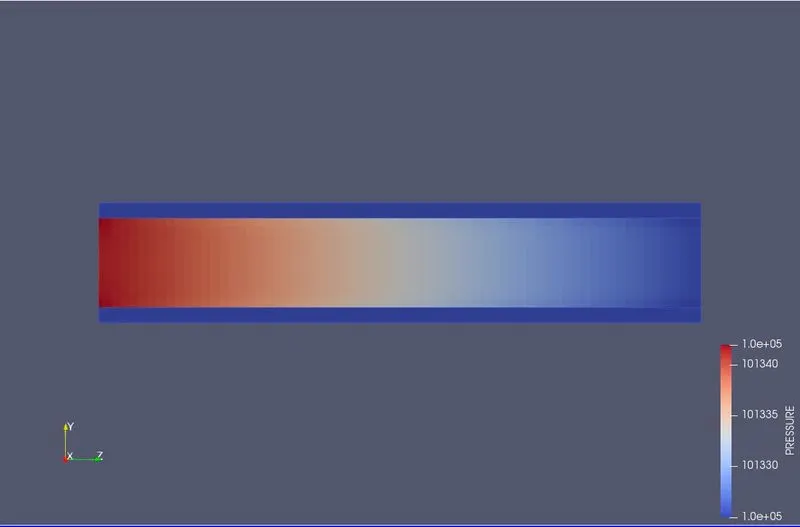
Temperature plot:
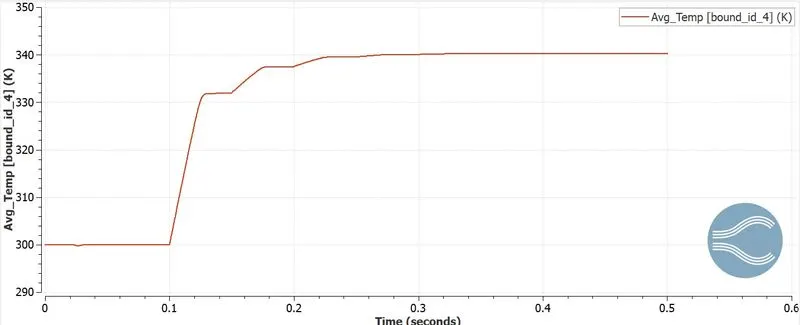
Temperature contour:
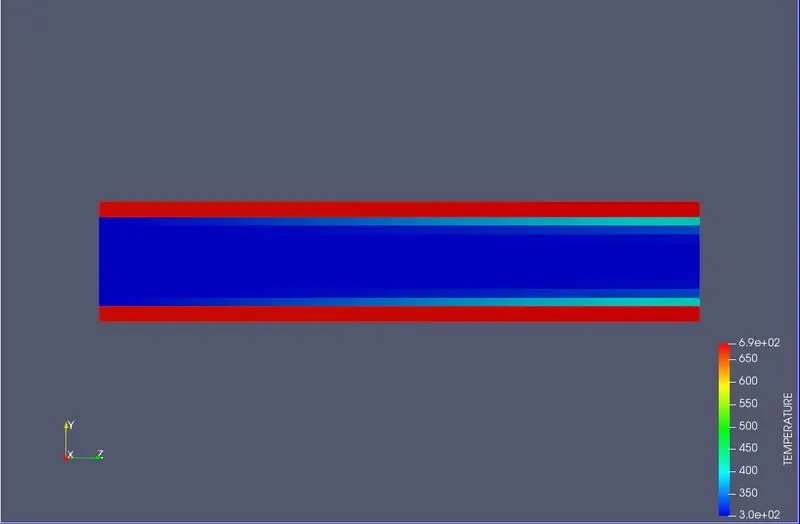
Temperature animation:
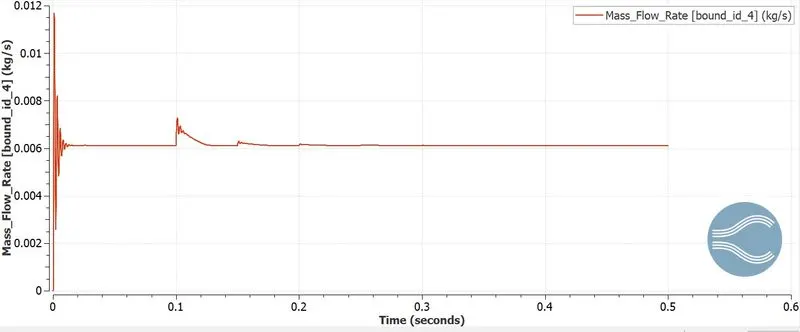
Mass flow rate plot:
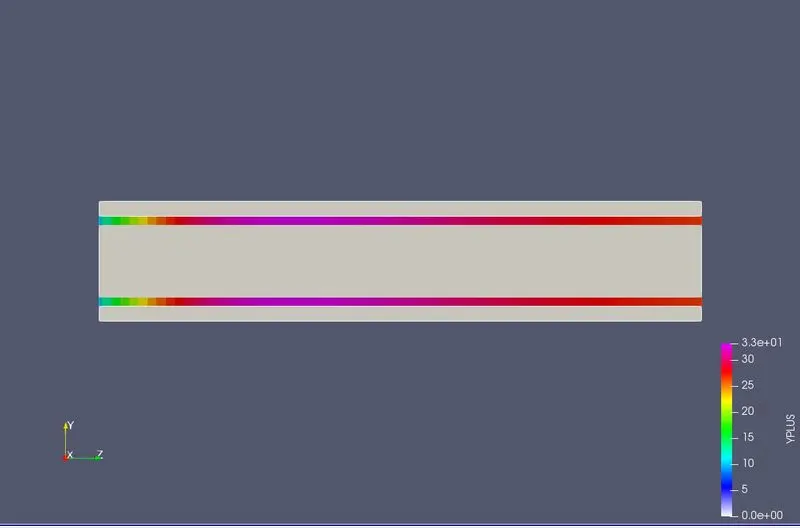
Y+ contour:
Case: grid(0.002m) & supercycle stage interval = 0.05
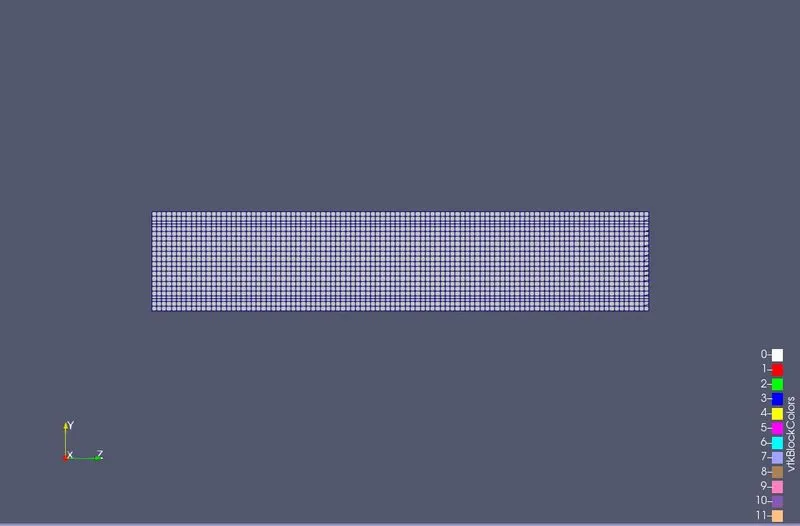
Mesh:
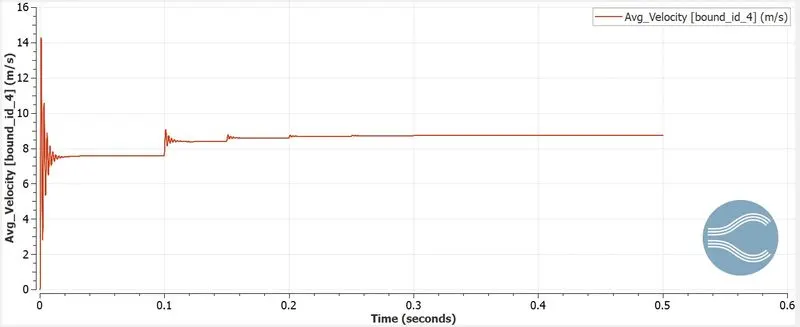
Velocity plot:
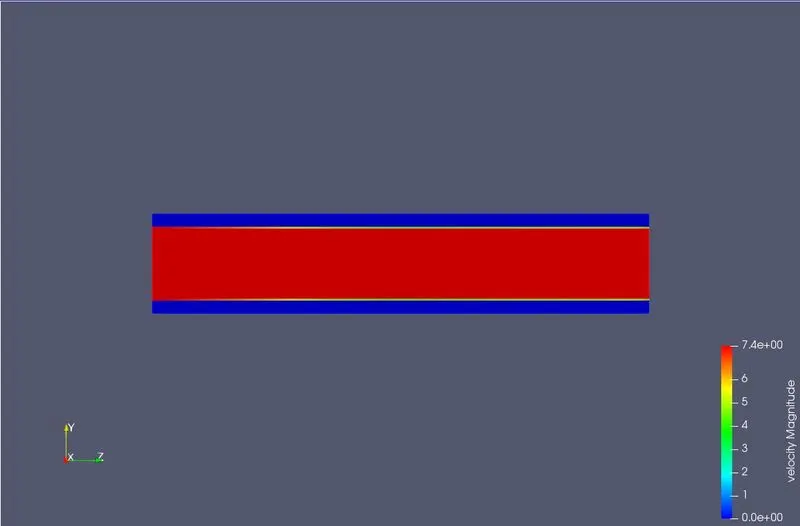
Velocity Contour:
Velocity animation:
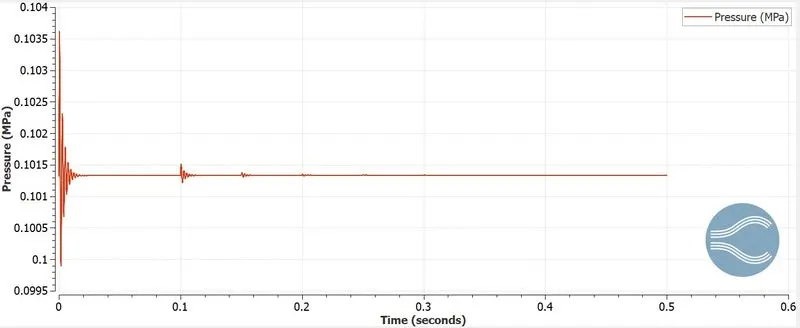
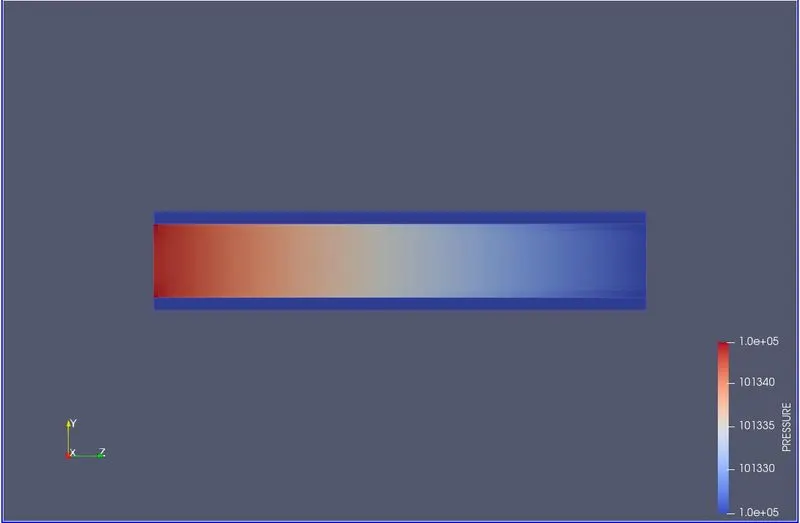
Pressure plot:
pressure contour:
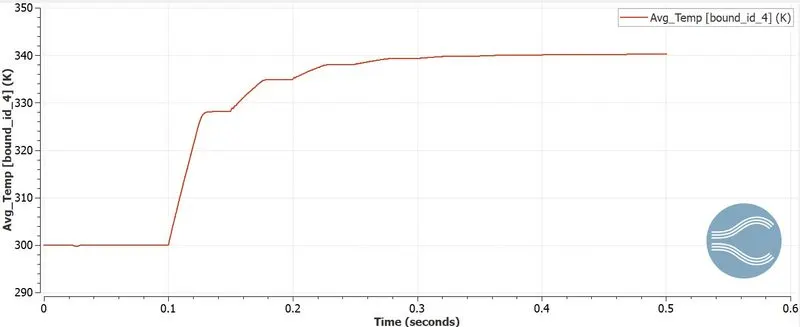
Temperature plot:
Temperature contour:
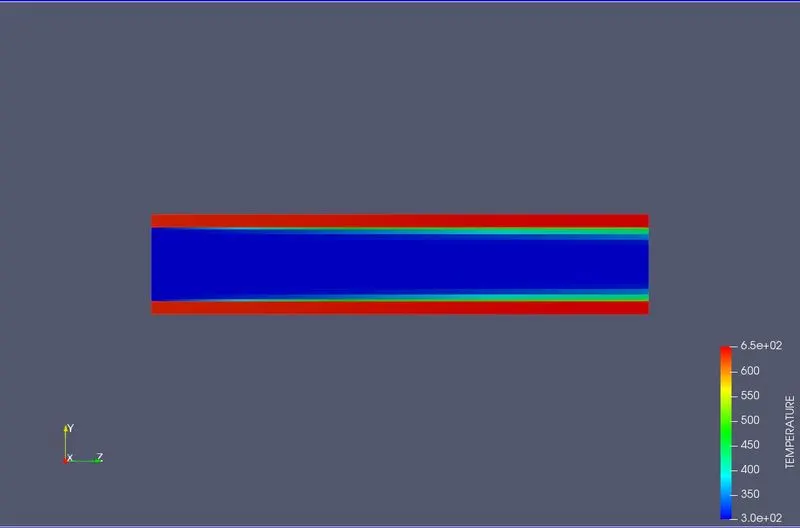
Temperature animation:
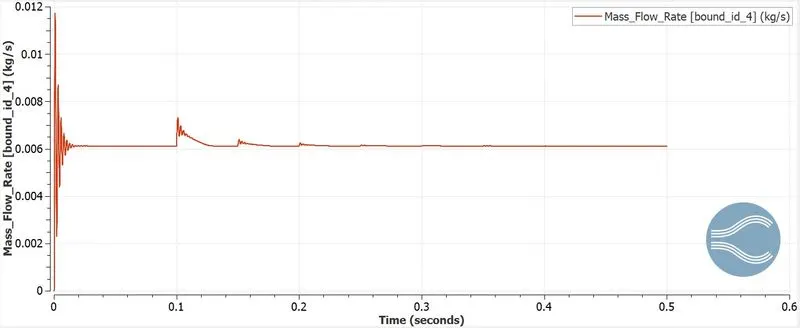
Mass flow rate plot:
Y+ contour:
Case: Base grid(0.004m) & supercycle stage interval = 0.05,0.03,0.02,0.01
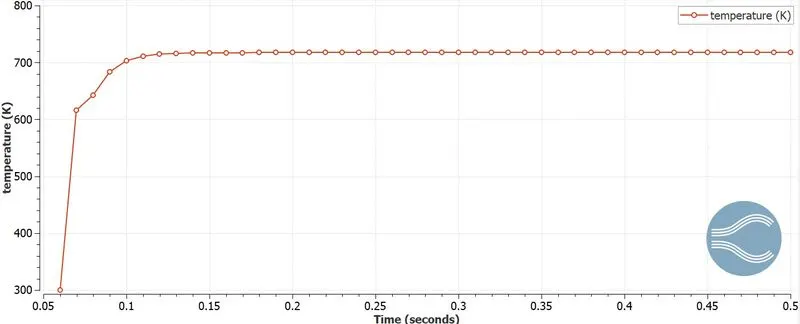
Supercycle temperature convergence monitor:
interval:0.05:
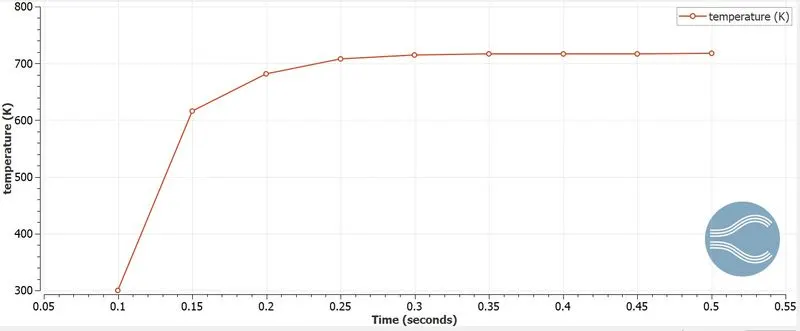
interval:0.03:
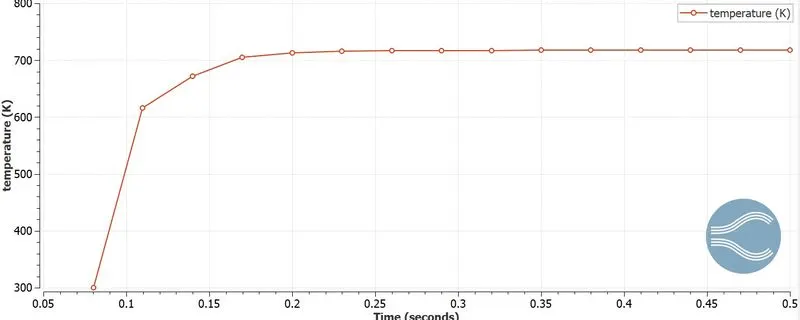
interval:0.02:
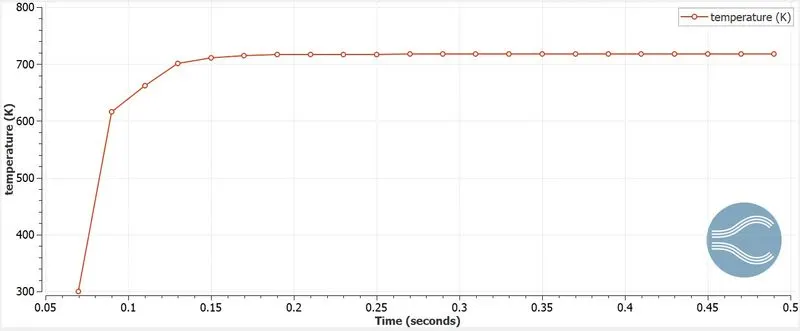
interval:0.01:
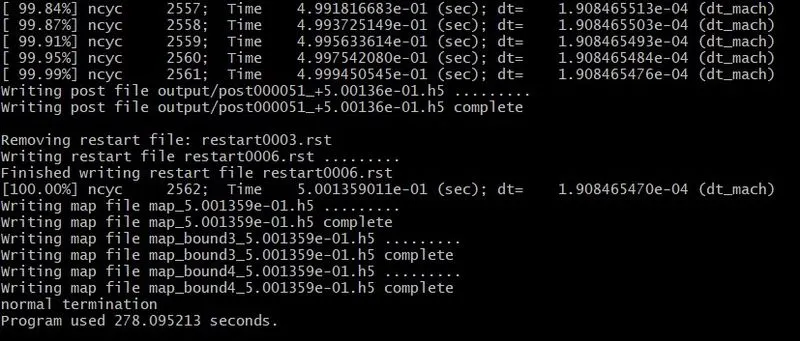
Command terminal message:
interval:0.03:
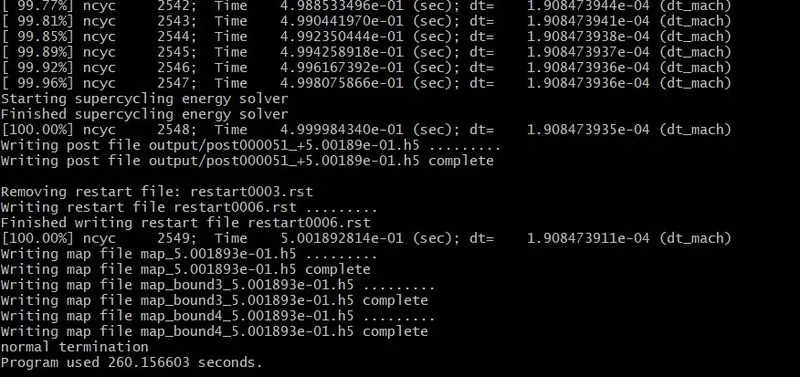
interval:0.02:
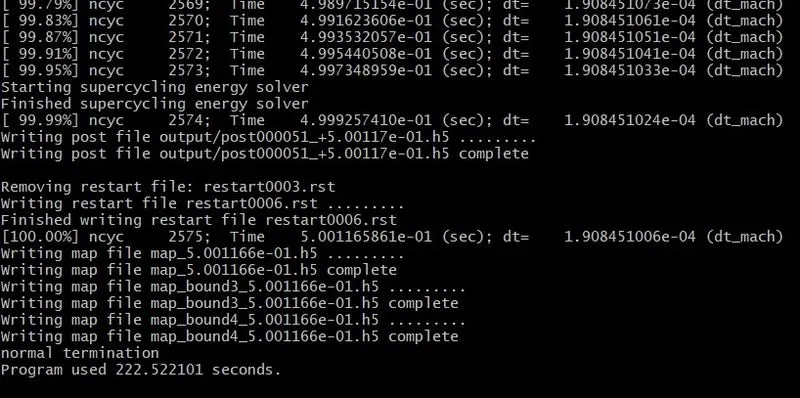
interval:0.01:
Inference:
From the grid dependence test, it is shown the increase in accuracy decrease with mesh size with the increase in time taken to calculate the results. The Supercycle interval effects the stimulation time with the same accuracy. The results provided is same with various Supercycle intervals whereas for various the Supercycle interval the stimulation time changes. The bigger the value for supercycle interval the biger the time take to stimulate the results. For lower value of supercyle interval very less time is take taken to provide the results. So the supercycle interval only affects the time to stimulate no the results.