Week 6 - CHT Analysis on a Graphics card
l. OBJECTIVE
- To perform steady-state conjugate heat transfer analysis on Graphics Card
- To find the effect of different velocities on the temperature
ll. INTRODUCTION
1. Conjugate Heat Transfer (CHT)
Conjugate heat transfer is defined as the heat transfer between two domains by exchange of thermal energy. For a system the thermal energy available is defined by its temperature and the movement of thermal energy is defined by its heat flux through the outer walls. Heat transfer in solid happens through conduction and walls by convection and in liquid phase through convection.
CHT provides the temperature prediction and the hotspot regions at the solid-fluid interface and we can also predict the heat transfer accurately for example- Conduction through solids, convection through fluid, and thermal radiation. It also provides the velocity and pressure distribution of fluid moving inside the solid. We can also use CHT in design optimization for improvement for heat transfer and cooling capacity.
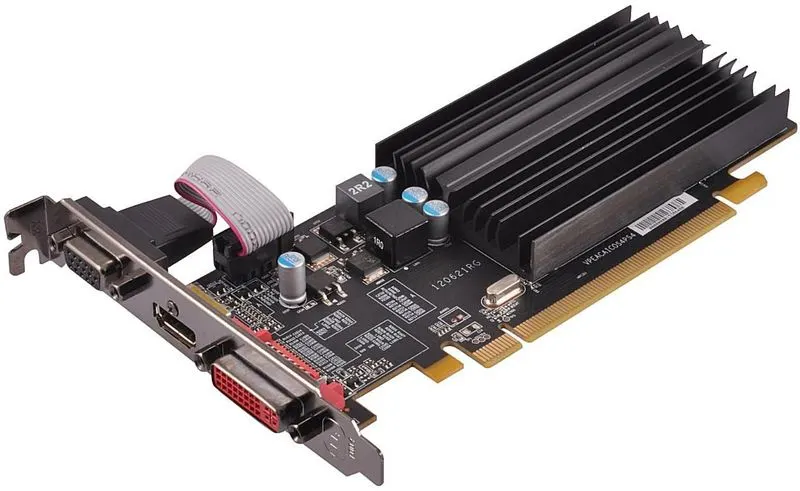
2. A video card (also called a graphics card, display card, graphics adapter, or display adapter) is an expansion card that generates a feed of output images to a display device (such as a computer monitor). Most video cards are not limited to a 6-inch simple output. Their integrated graphics processor can perform additional processing, removing this task from the central processor of the computer.
lll. PROBLEM STATEMENT
- Simulate CHT analysis on a model of a graphics card and use appropriate materials of your choice for the simulation.
- Simulate by varying the velocity from 1m/sec to 5m/sec for at least 3 velocities.
- Find out the max temperature and heat transfer coefficient attained by the processor.
lV. SPACECLAIM GEOMERTY
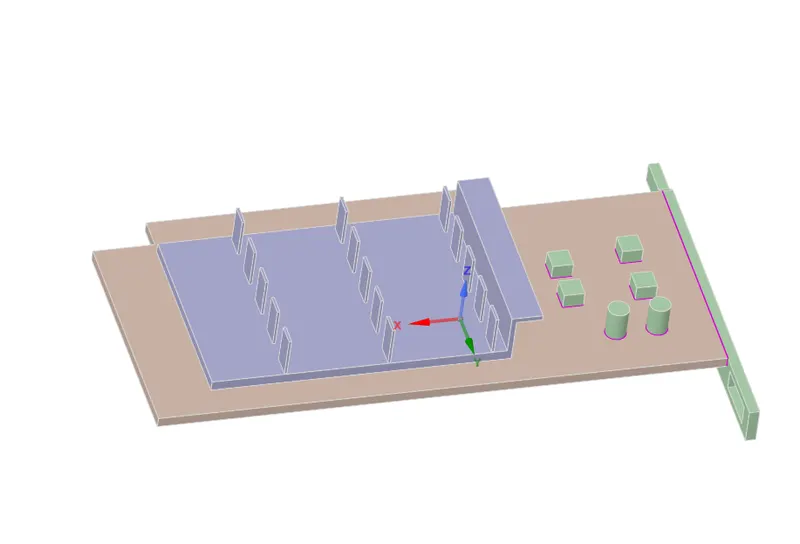
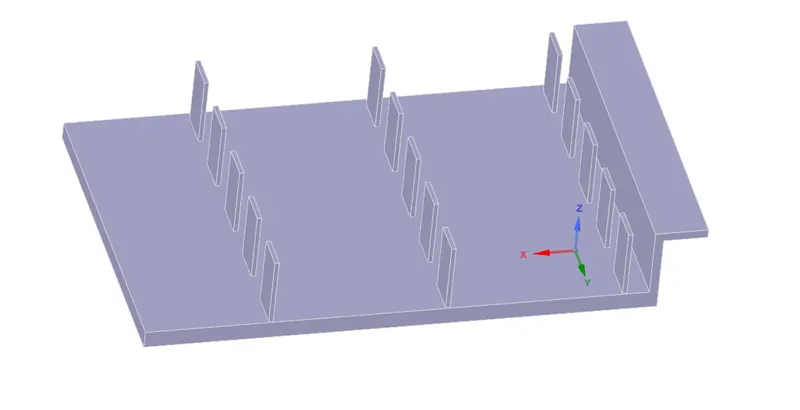
FINS
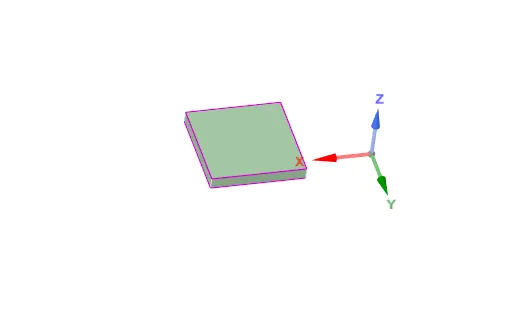
PROCESSOR
BASE
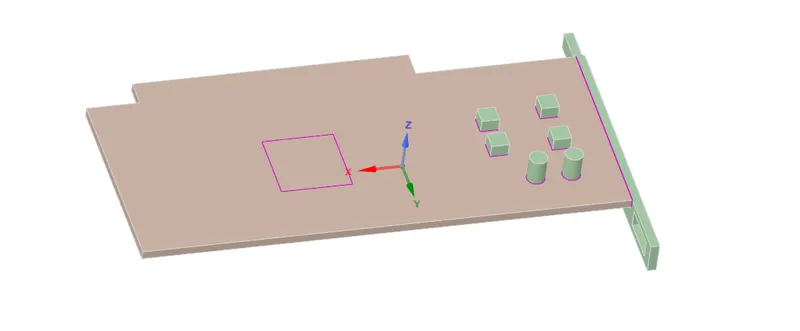
Topology is set to share such that the data could be shared between the different components of the graphics card.
V. INITIAL TEST - BASELINE SETUP
A. MESH
1. Named Selection
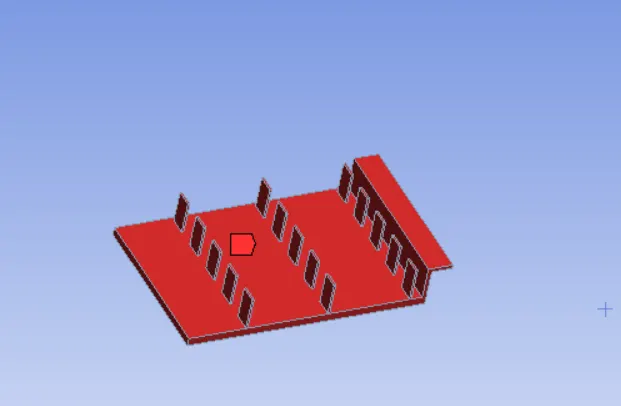 FINS
FINS
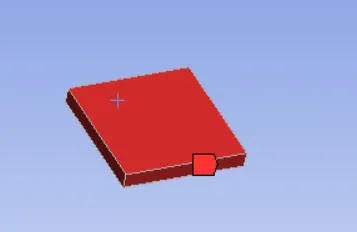 PROCESSOR
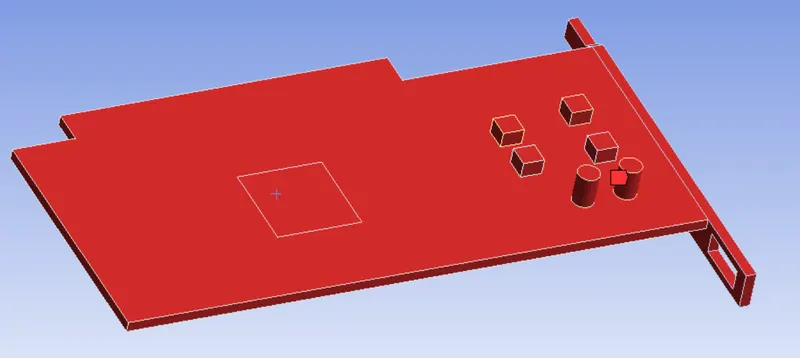 BASE
BASE
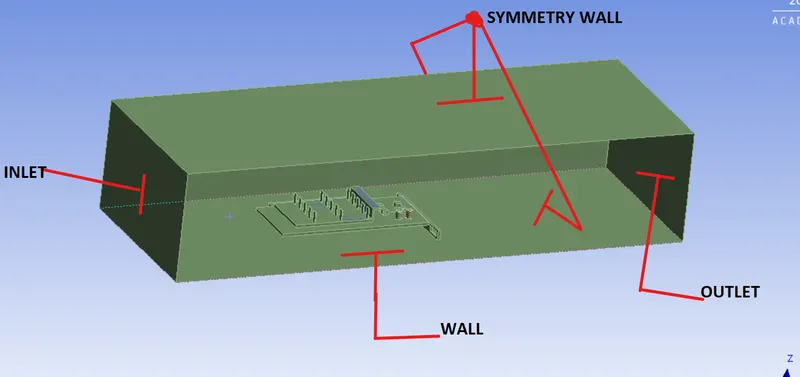 Encloser
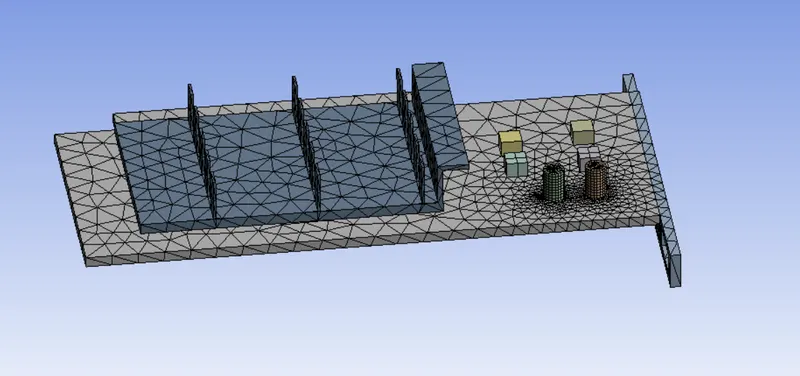
2.1 Base Mesh
A basic mesh is generated using the standard values recommended by Ansys. This mesh is used to obtain an initial solution which will help us to determine the location where mesh refinement is required.
1.Element Order: Linear
2.Element size: Default
3.Number of Nodes: 12627
4.Number of Elements: 52375
2.2 Element Quality
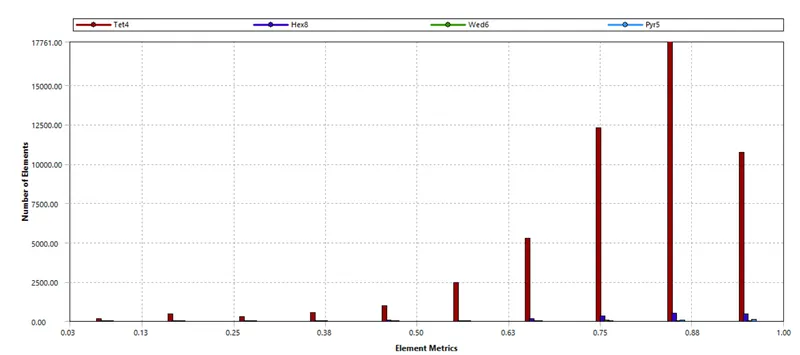
We have some elements with quality less than 10%
B. Simulation Setup
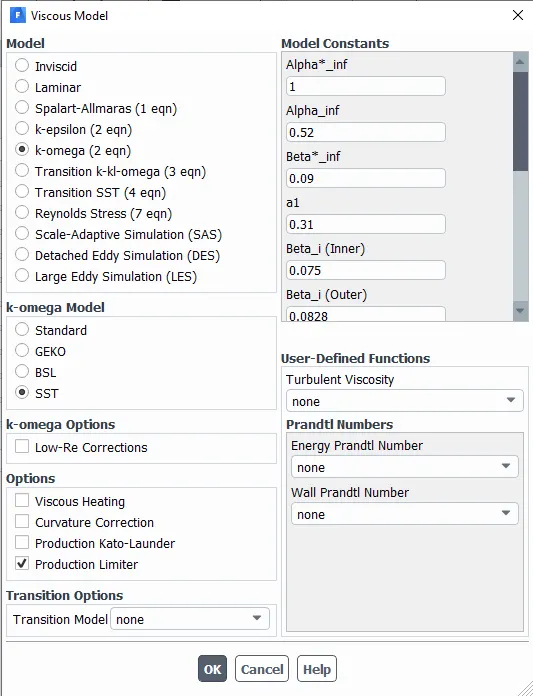
1.Solver: Steady
2.Type: Pressure Based
3.Turbulence Model: k-Omega(SST)
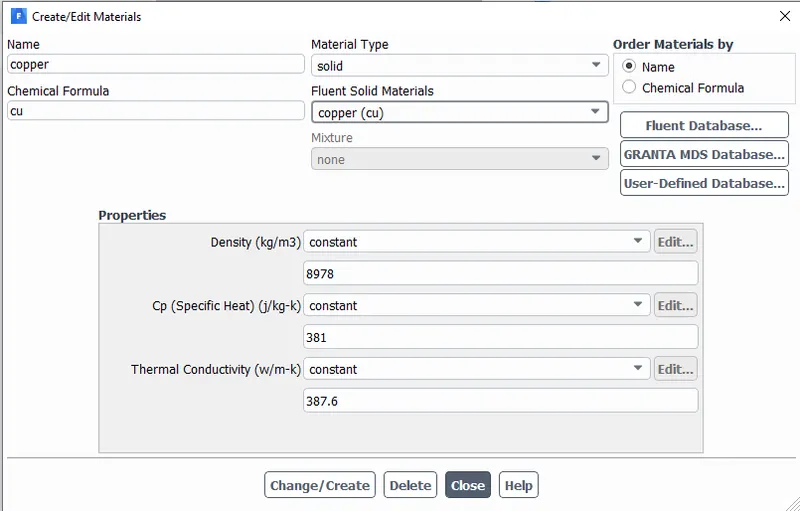
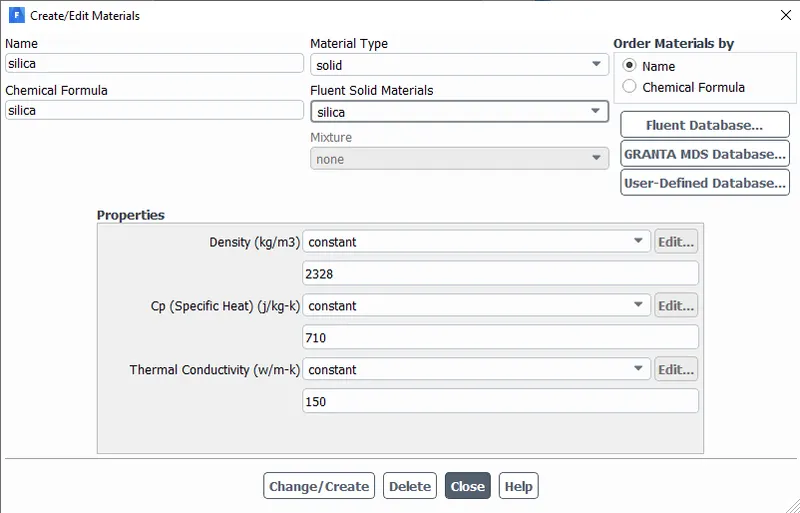
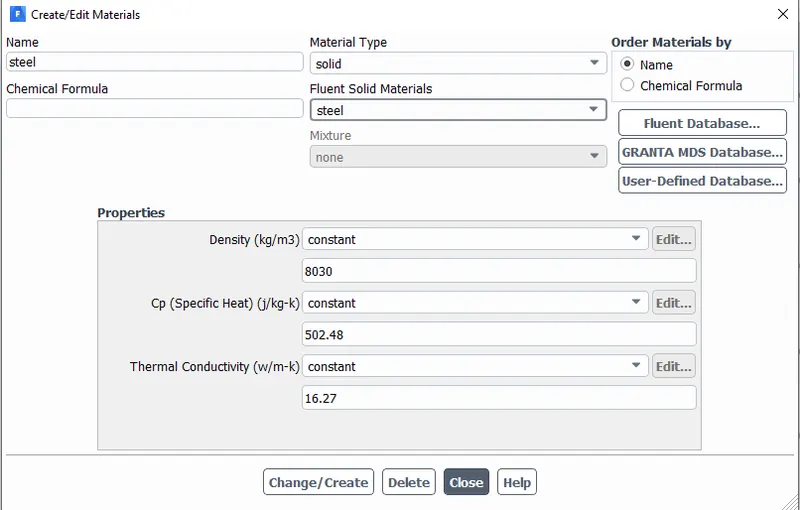
4.Materials: Different materials are used for each part, some of which are custom create
5.Boundaries:
- Inlet:
Type: Velocity Inlet
Velocity: 5m/s
Temperature: 300 K
- Outlet:
Type: Pressure Outlet
Pressure: 0 Pa(Gauge Pressure)
Temperature: 300 K
- Symmetry: Symmetry
- Wall: Wall
6. Cell Zone Conditions
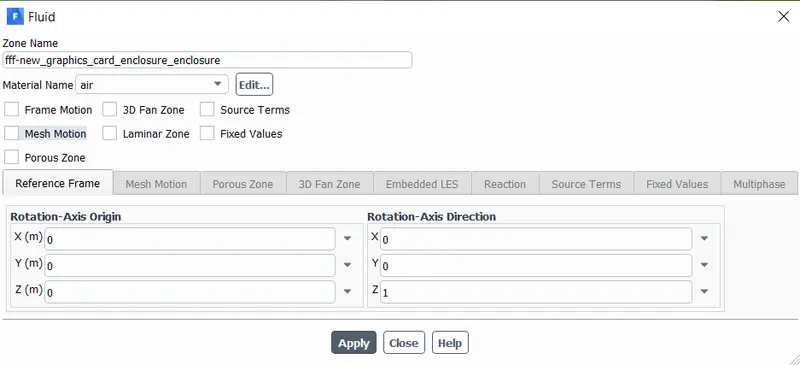
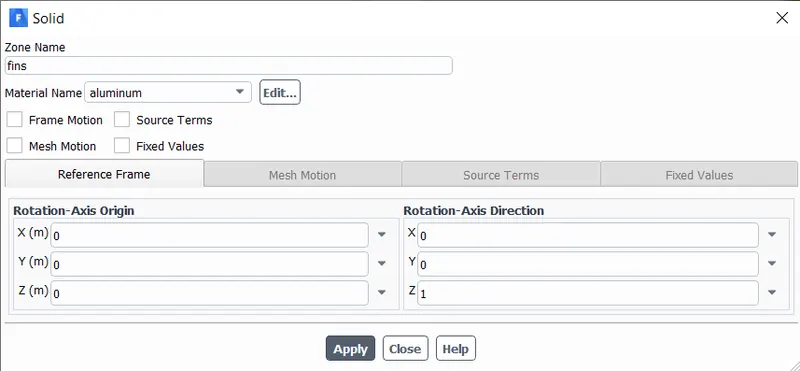
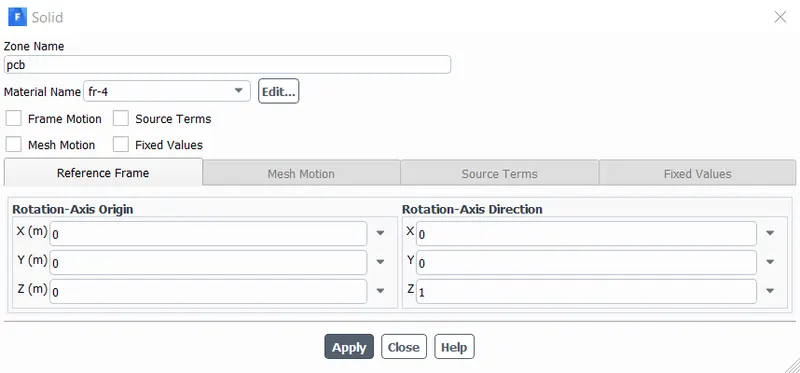
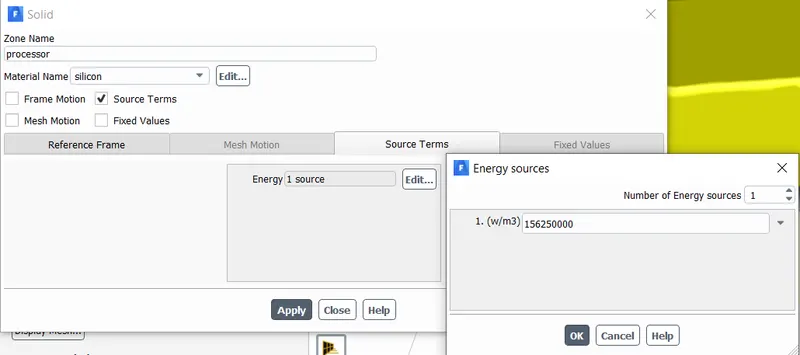
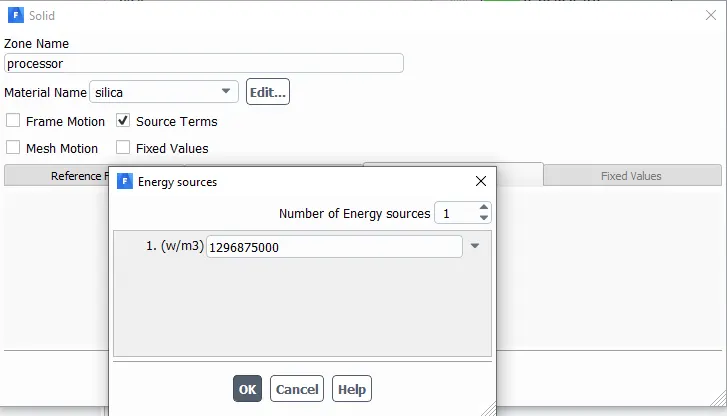
The processor is assumed as the only source of heat. The heat generated by the processor is calculated as:-
Graphics Card Power = 10W
Volume of the card = 8 x 8 x 1
= 64mm3=64e−9m364
Heat Generated = PV=1064e−9
= 1.5625e8Wm3
7. Solution
- Method: Standard
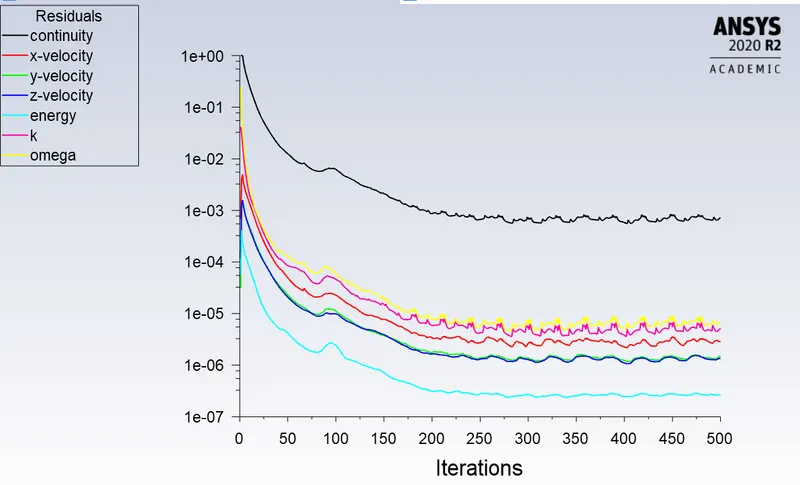
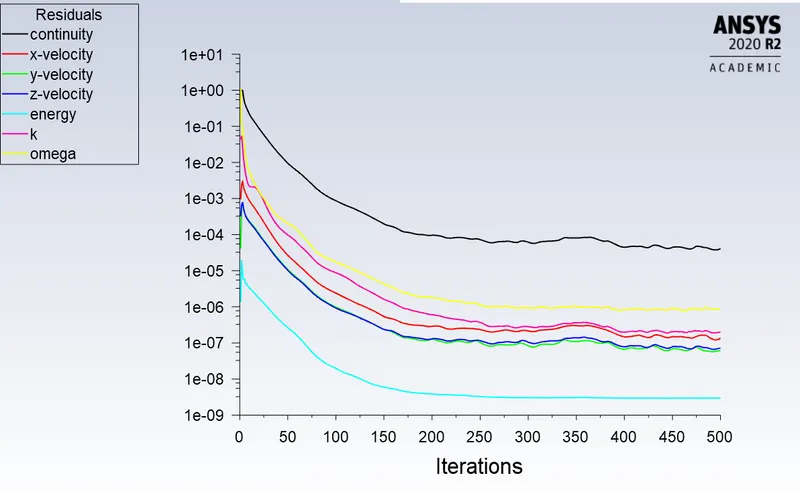
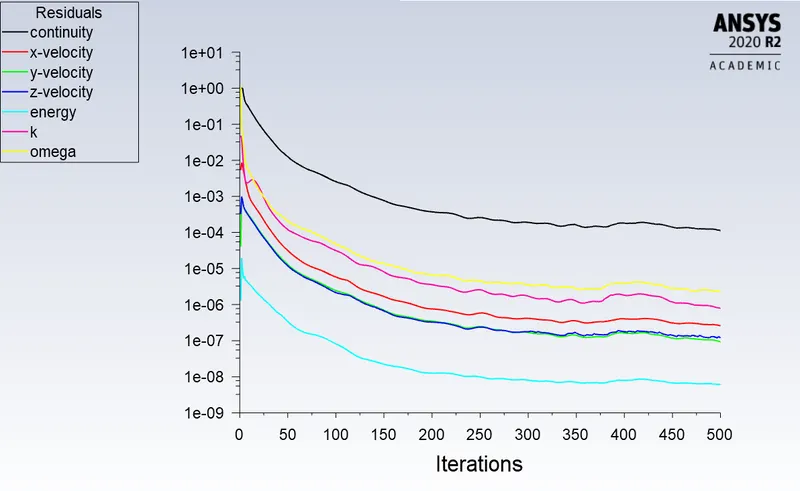
- Number of Iterations: 500
8. Simulation Output
1. Residual
C. Post Processing
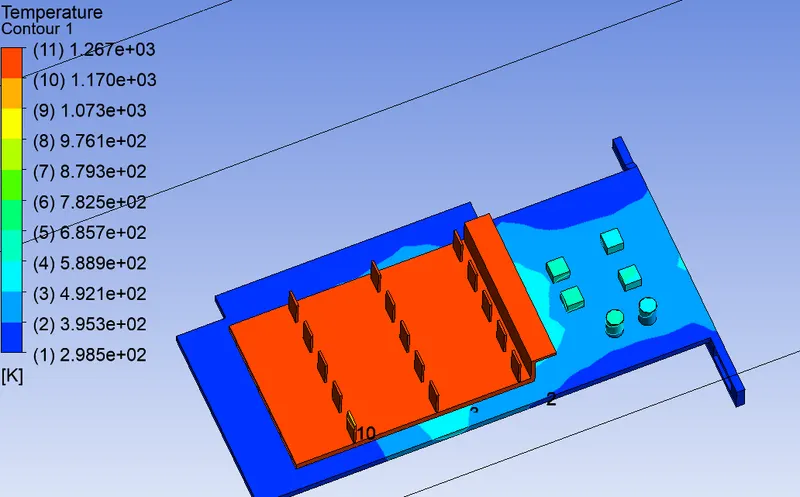
1. Global Hotspot Region
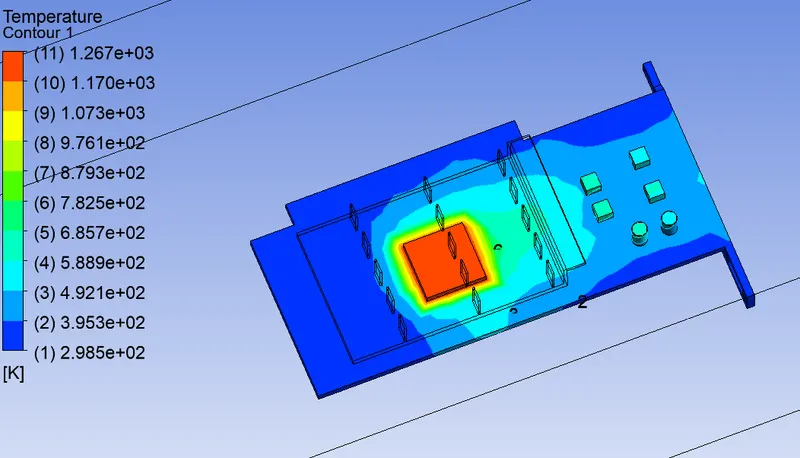
2. Hotspot Around the Processor
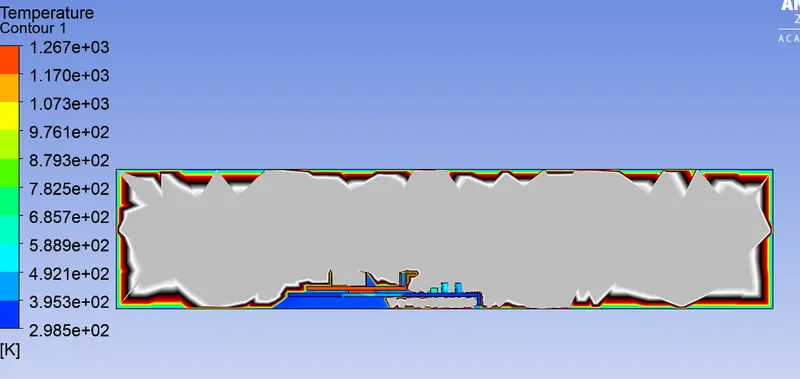
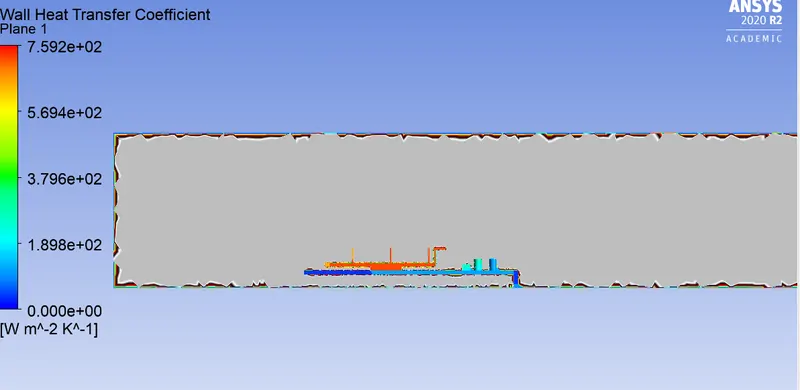
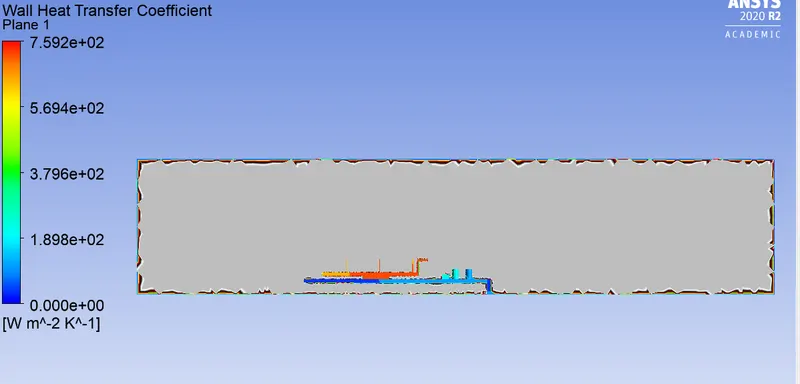
3. Wall Heat Transfer Coefficient
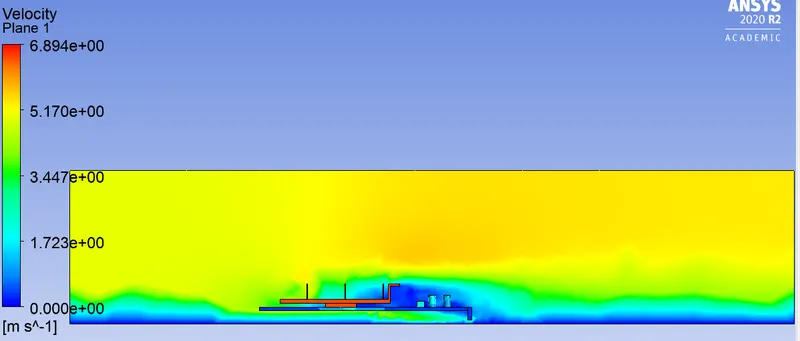
4. Velocity Contour
Vl. REFINED MESH
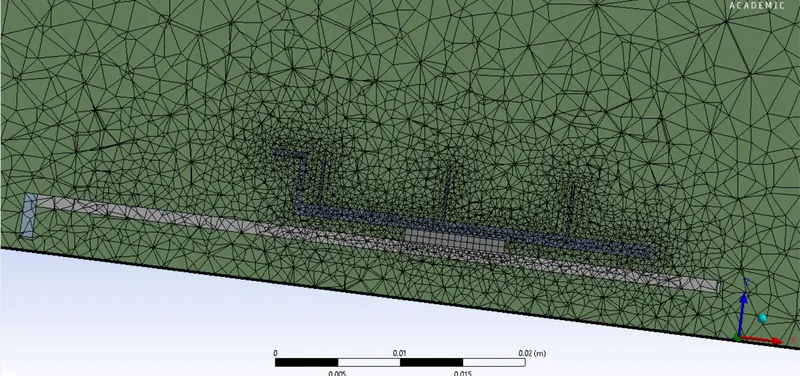
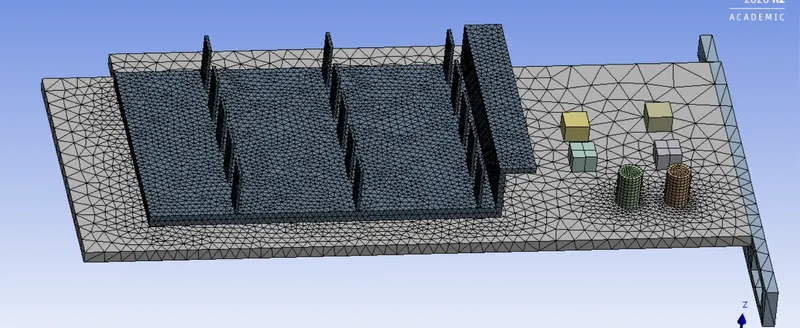
A. MESH
1.Element Order: Linear
2.Element size: 0.003 m
3. Body Sizing (Fin)
- Element Size: 0.0005 m
- Curvature Capture: Yes
4. Body Sizing (Processor)
- Element Size: 0.0005 m
- Curvature Capture: Yes
5. Body Sizing (Base)
- Element Size: 0.003 m
- Curvature Capture: Yes
6.Number of Nodes: 88448
7.Number of Elements: 429838
B. SIMULATION SETUP
The simulation setup is the same as that selected for the initial mesh. Only the output of the simulation will change because of the change in the inlet velocities.
C. SIMULATION OUTPUT
| VELOCITY = 1m/s | VELOCITY = 3m/s | VELOCITY = 5m/s | |
| RESIDUALS | 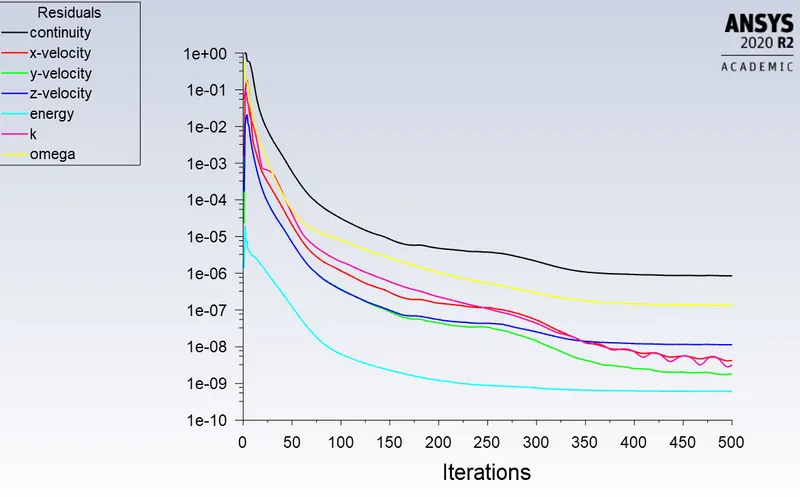 |
 |
 |
D. POST-PROCESSING
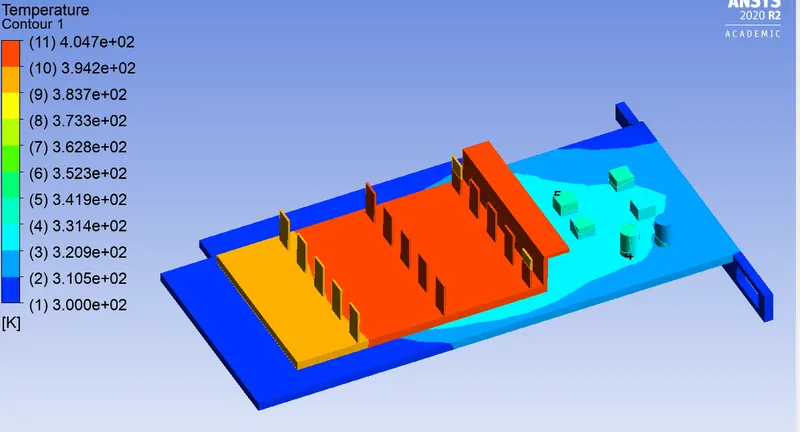
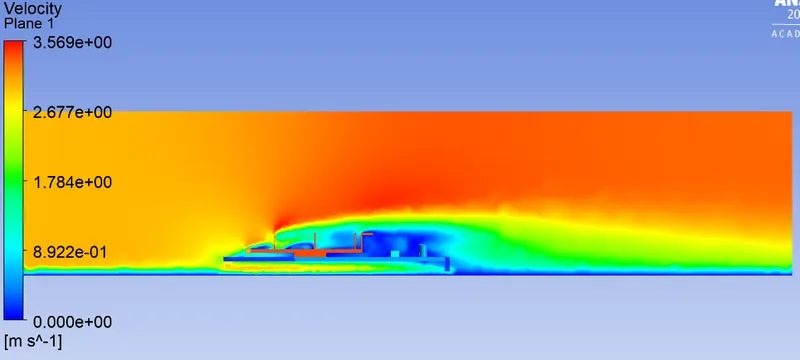
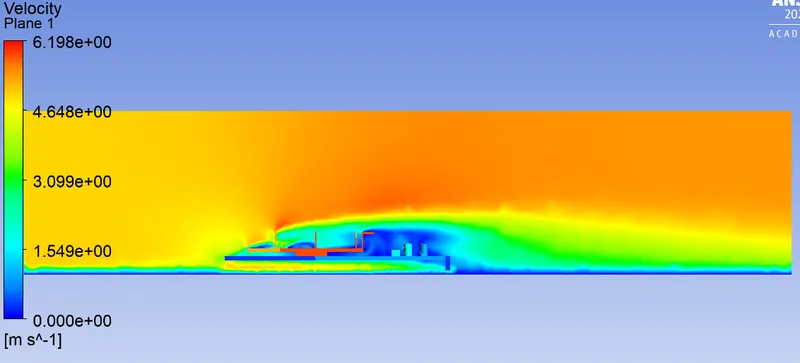
| VELOCITY = 1m/s | VELOCITY = 3m/s | VELOCITY = 5m/s | |
| Global Hotspot Region | 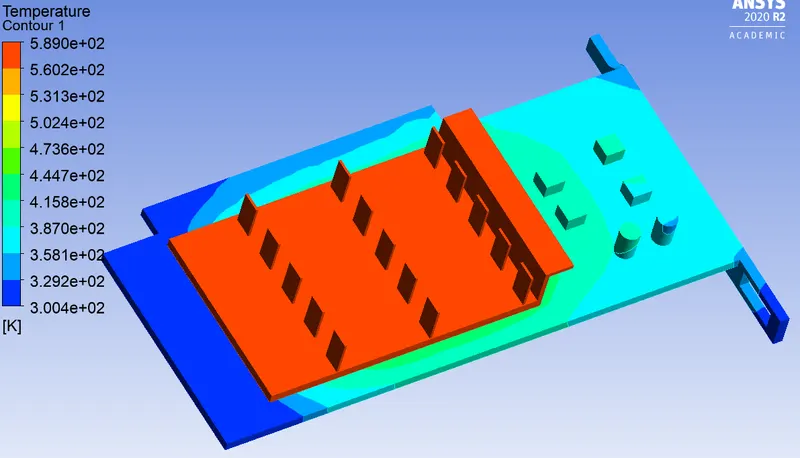 |
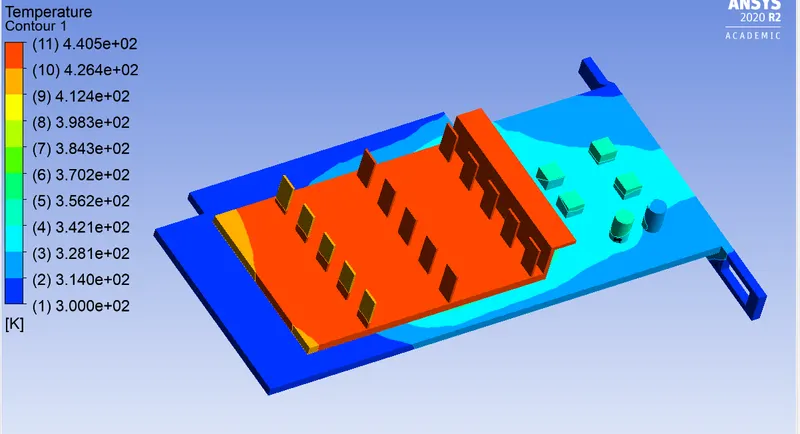 |
 |
| Hotspot Around the Processor | 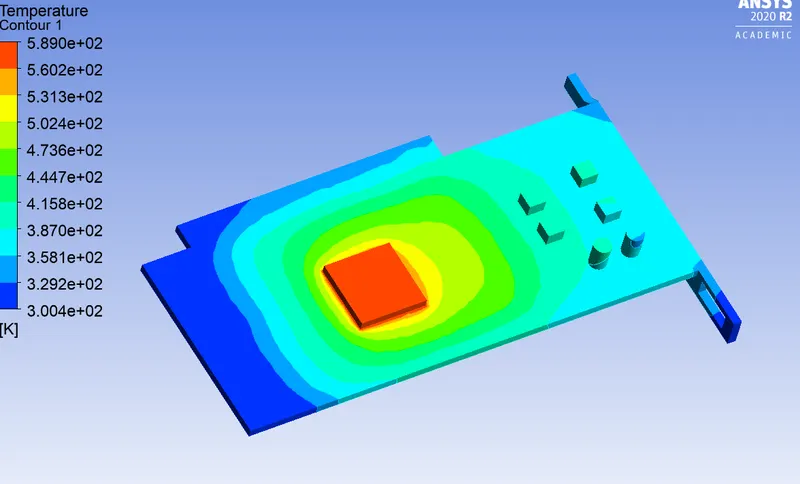 |
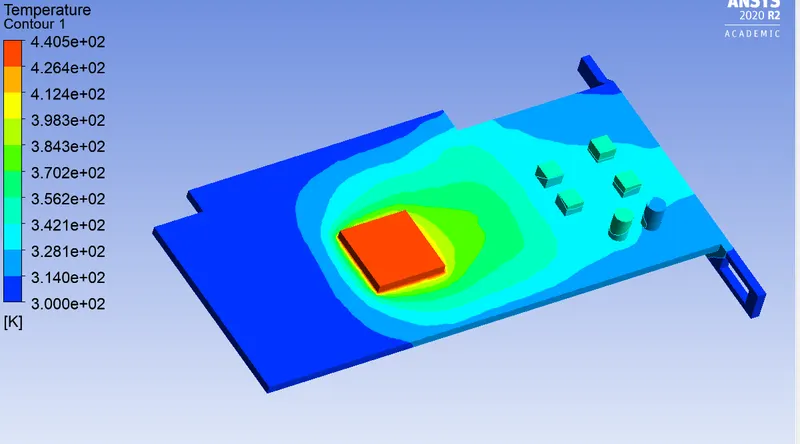 |
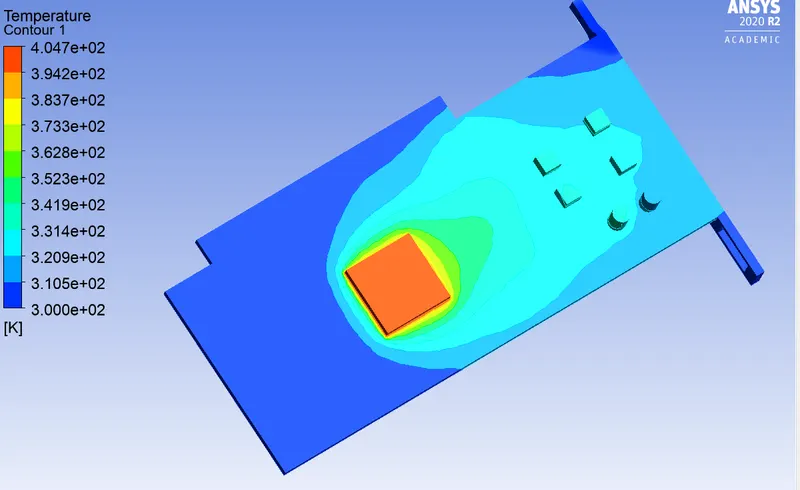 |
| Wall Heat Transfer Coefficient | 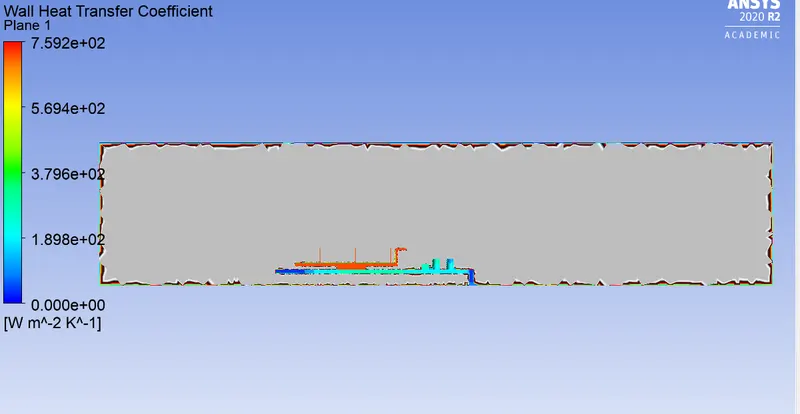 |
 |
 |
| Velocity Contour | 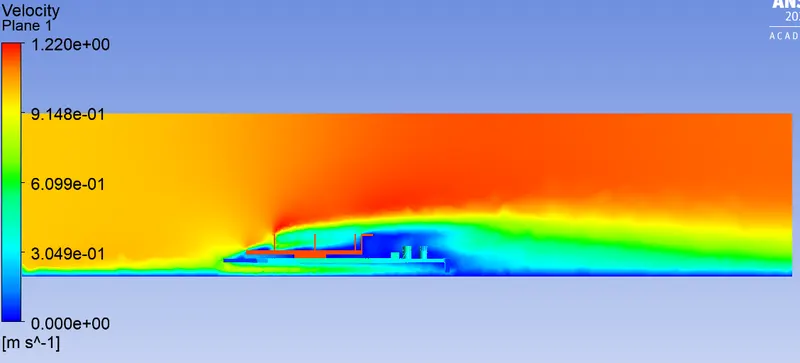 |
 |
 |
Vll. RESULTS
| Velocity | The temperature at Processor [k] | The temperature at Fins [k] | HTC at Fins [Wm2k] |
| 1 | 587.18 | 580.28 | 256.94 |
| 3 | 438.78 | 431.88 | 258.47 |
| 5 | 402.95 | 396.20 | 262.49 |
Vlll. CONCLUSION
- As the number of elements increases the accurate results of temperature distribution is obtained
- From the above table, it is fairly notable that, the net temperature of components of graphics cards decreases with an increase in inlet velocity.
- Hence it can be inferred that a higher inlet velocity results in better cooling and lower the average temperature thus keeping the components safe from damage.
- Furthermore, it can be observed that the temperature of components increases as the inlet velocity decreases from 5 m/s to 1m/s, also proving that higher velocity results in better cooling.