Week 6 - CHT Analysis on a Graphics card
Aim -conjugate heat transfer analysis on the graphic card.
Introduction- It is normal and also necessary for the GPU to get hot. The GPU hardware poses resistance when electricity runs through the chips and circuits in the processor. This resistance generates heat. They aren't that large a heat source, only a few hundred watts when fully loaded, compared with 1000+ watts for a standard plug in heater.
Conjugate heat transfer is a type of heat transfer analysis between solids and fluid(s). This type of heat transfer includes both convection (between fluids) and conductive (between solids) heat transfer, as well as both forced and natural convection.
Computational Fluid Dynamics (CFD) and more specifically conjugate heat transfer (CHT) analysis can accurately predict heat transfer by simultaneous solving all the relevant solid and flow field heat transfer processes, for example: conduction through solids, free and forced convection in the gases/fluids and thermal .
Here in the problem we are going to simulate the CHT simulation over the GPU for the 3 different inlet velocity and going to see the changes accordingly by the help of ANSYS fluent.
Procedure- the CHT simulation on the graphic card starting from setting up the geometry on the space claim to generating the desired result is going to be covered in the following steps.
Step_1 setting up the geometry.
- The geometry which is already provided, enclosed with the rectangular box.
- All the part related to the graphic card is enclosed in the rectangular box.
- Under workbench
- The colour of the edges will be changed as the share option is enabled here.
Step_1 meshing and the modelling approach.
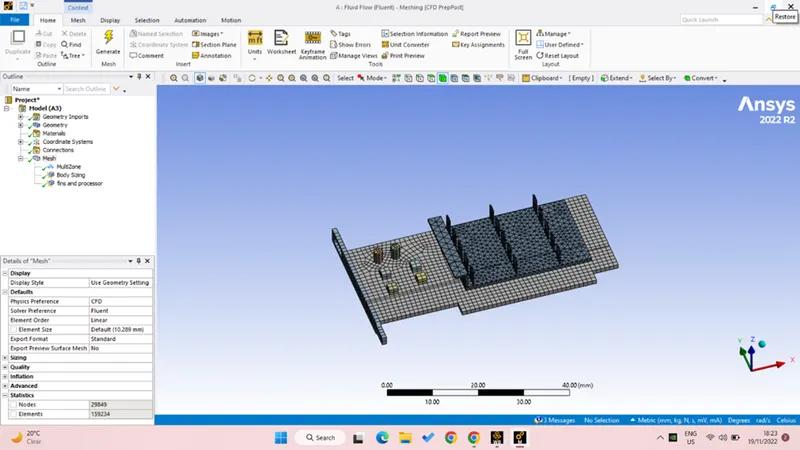
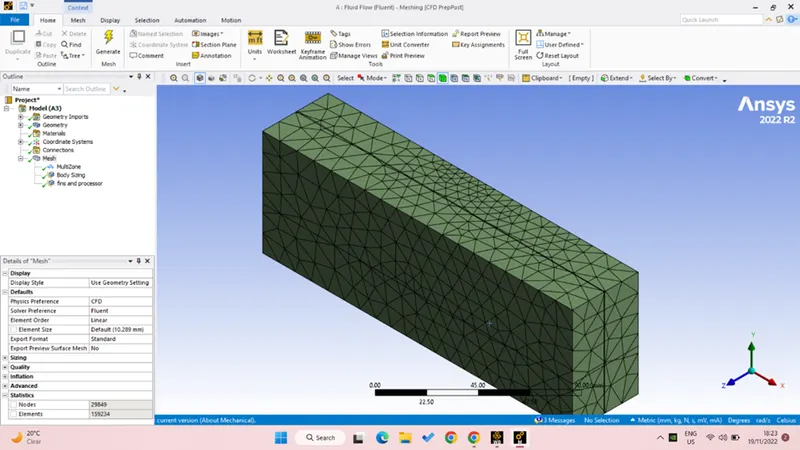
- Generate the mesh on the geometry.
- The mesh on the graphic card should be much fine as we wanted to see the desired changes near this.
- Thus provide the 1mm mesh target length to the graphic card.
- The down (PCB board) is provide with the method of multizone.
- Provide the name as input, output, symmetry wall for the enclosure.
- The graphic card should have the name like-
Processor- the heat generating part on the GPU the hotspot.
Fins- the extended surface connected with the processor for more HTC.
PCB Board- the board connected with the rest of the components like resistance, capacitor, diodes etc.
Step_3 pre-processing and solver setting.
- The solver setting is pressure based > steady state > energy enabled > absolute.
- Material for solid should be different for the different part.
- From the library and the data book the following material with their properties are taken
|
Part |
Materia |
Conductivity(w/m^2.k) |
Specific heat (J/kg-k) |
Density (Kg/m^3) |
|
FIN |
Aluminium |
202.4 |
871 |
2719 |
|
Processor |
Silicon |
153 |
703 |
2330 |
|
PCB board |
Poly styrene |
0.027 |
1210 |
55 |
|
Heat transfer fluid |
Air |
0.0242 |
1006.43 |
1.225 |
- Under cell zone < part< change the material type to solid for fin, processor and PCB board.
- Under cell zone provide the processor as the heat generating part with assuming 1 watt. Then as the area of the processor is 64 mm^3 the total heat generation is 15.625*10^6 w/m^3.
- Boundary condition
Inlet – 1m/s , 3m/s , 5m/s
Outlet – 0 gauge pressure
- Under definition provide some plot for average area weighted of heat transfer coefficient and maximum temperature.
- Also provide some contour to see the temperature variation over the graphic card.
- Initialize the solution with hybrid initialization.
- Provide some iteration and start the result calculation.
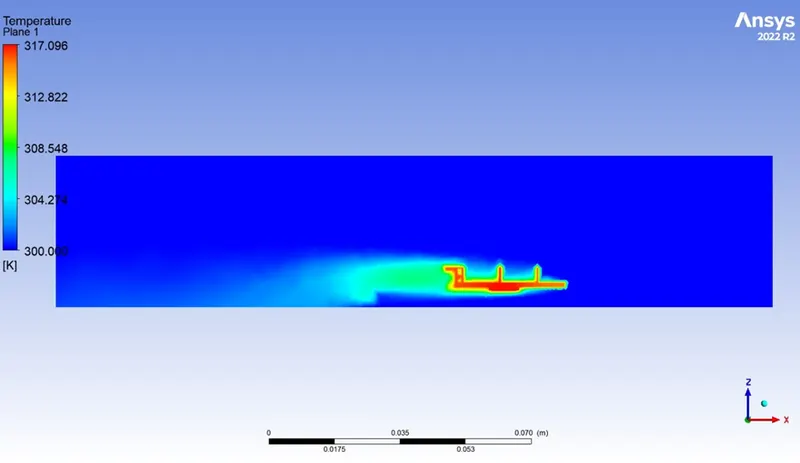
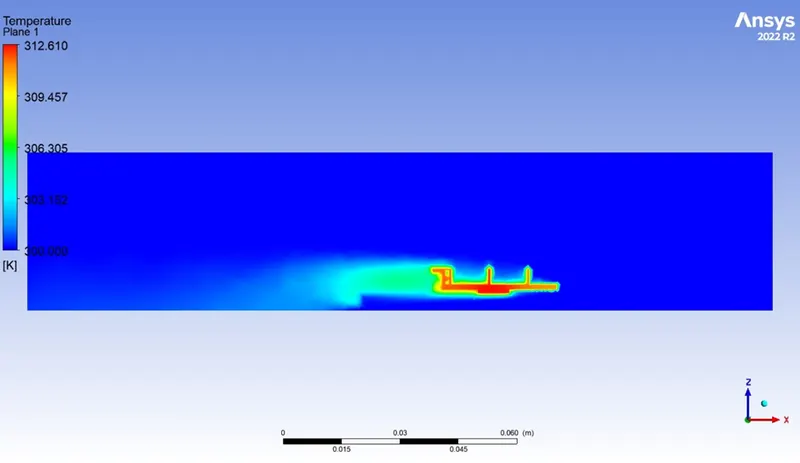
Result – the result for the following mesh size and the different inlet air velocity the following generate contour is generated.
|
Case |
Velocity magnitude |
Avg HTC |
Max temperature |
|
Case-I |
1 m/s |
-4.7810 w/m^2k |
334.73 K |
|
Case-II |
3 m/s |
-7.1093w/m^2k |
317.05 K |
|
Case-III |
5 m/s |
-9.3641w/m^2k |
312.570K |
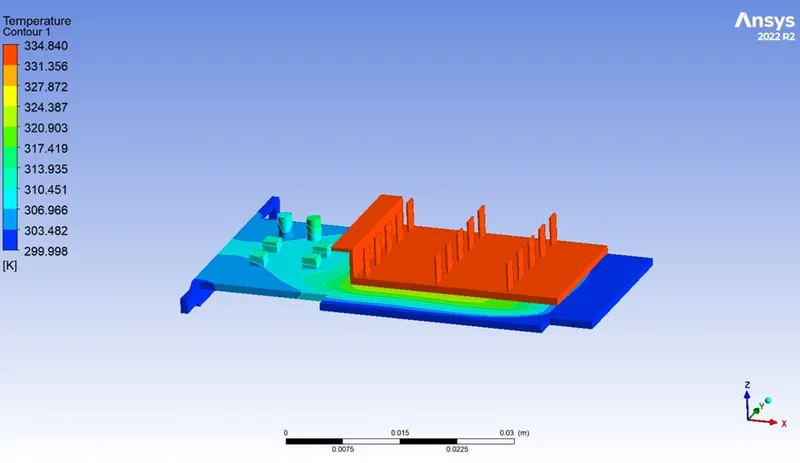
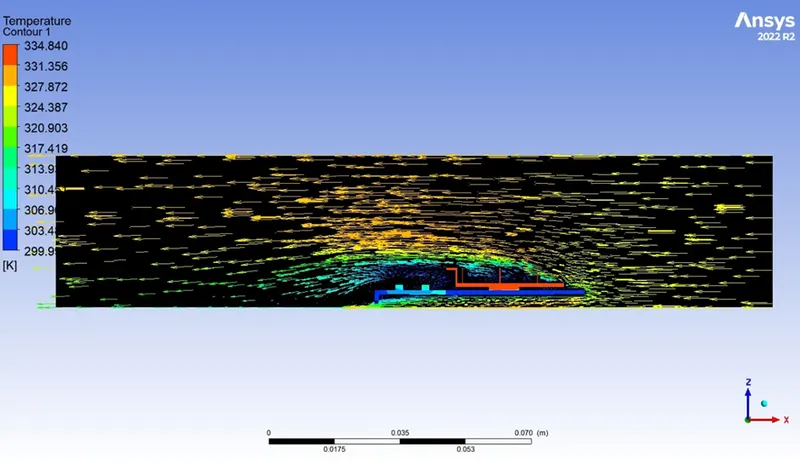
Here this image is showing the heat generation and flow over the graphic card as with the air inlet(1m/s), the temperature variation can be seen from 300 k as blue to 334 k red.
The temperature variation can also be seen in the following video uploaded to the google drive and the link is here.
https://drive.google.com/file/d/1hOStH43JWNXXOft8LOl7UOOcpGuq3YkX/view?usp=sharing
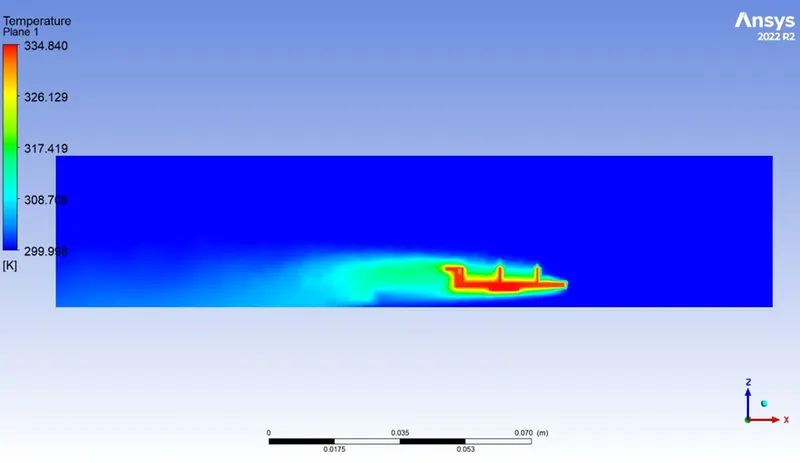
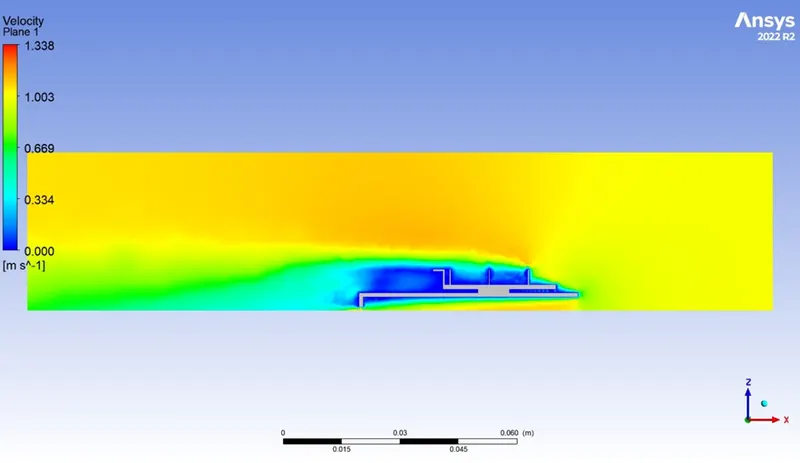
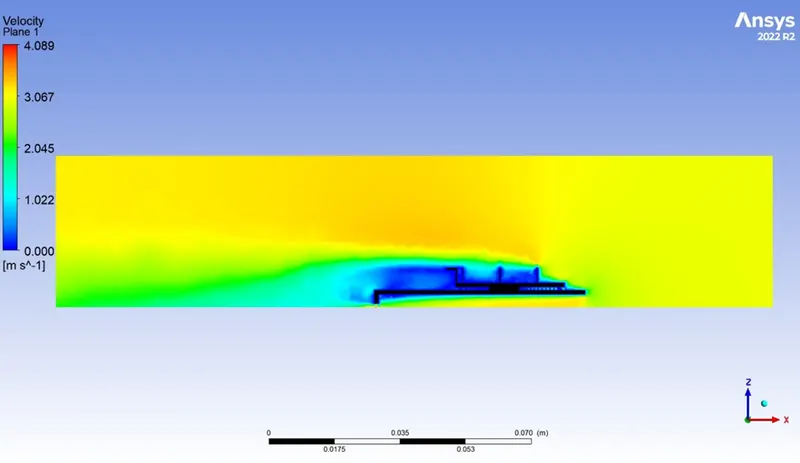
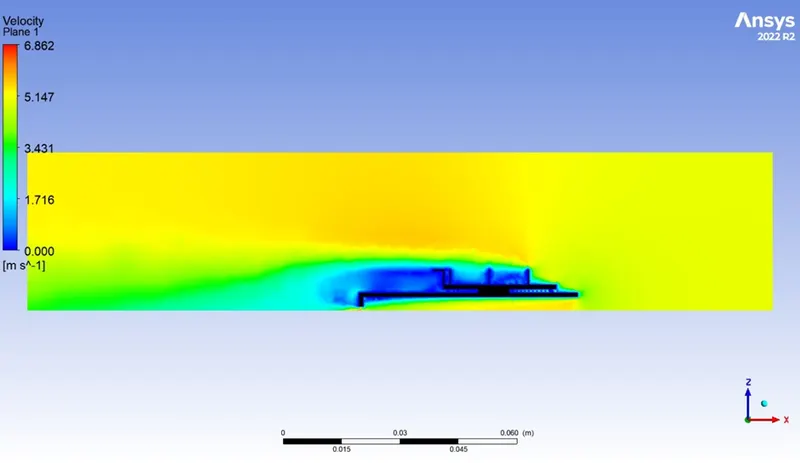
The velocity contour-
Case-I
Case – II
Case-III
Pressure contour-
Case- I
Case-II
Case-III
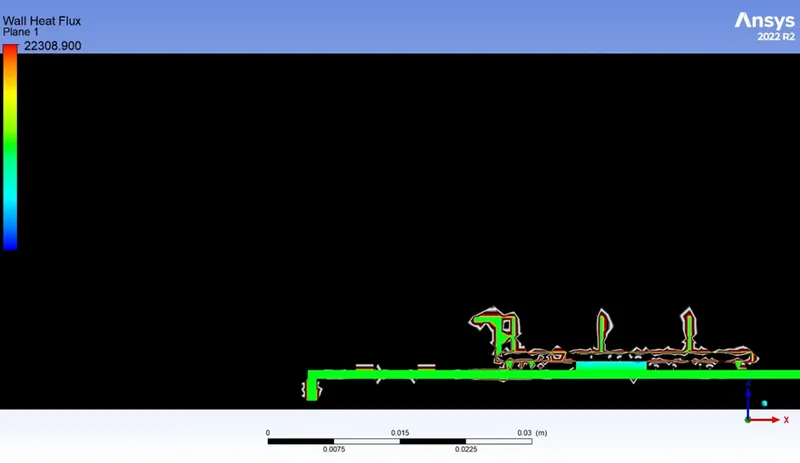
Heat transfer coefficient –
The velocity vector
The residual, HTC and max temperature plot
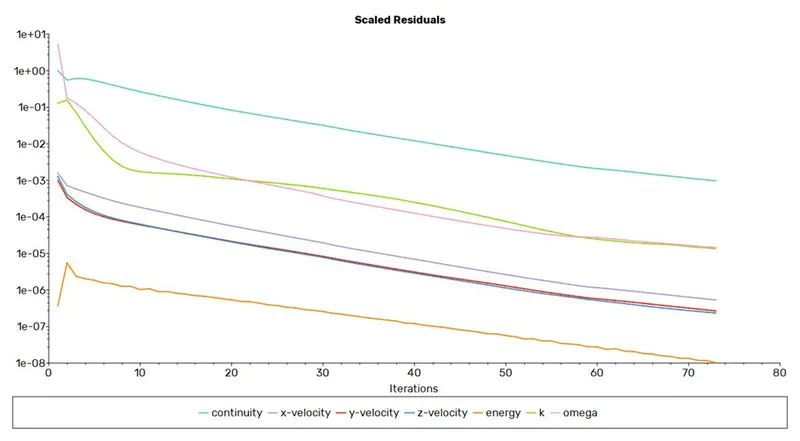
Here as it can be seen that the solution is being converged.
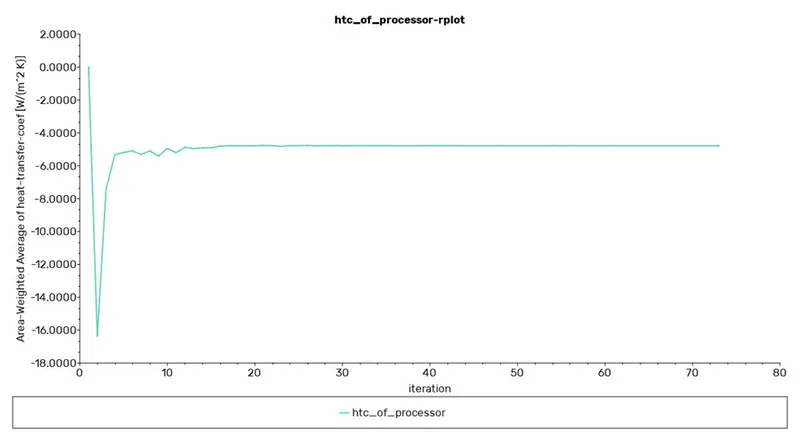
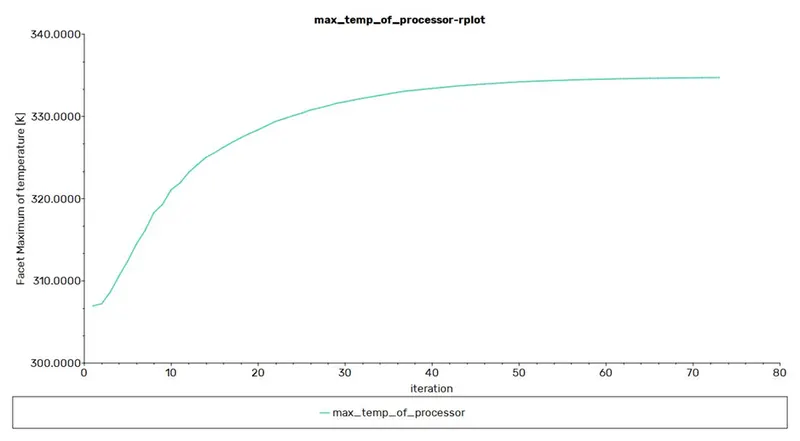
For case – III
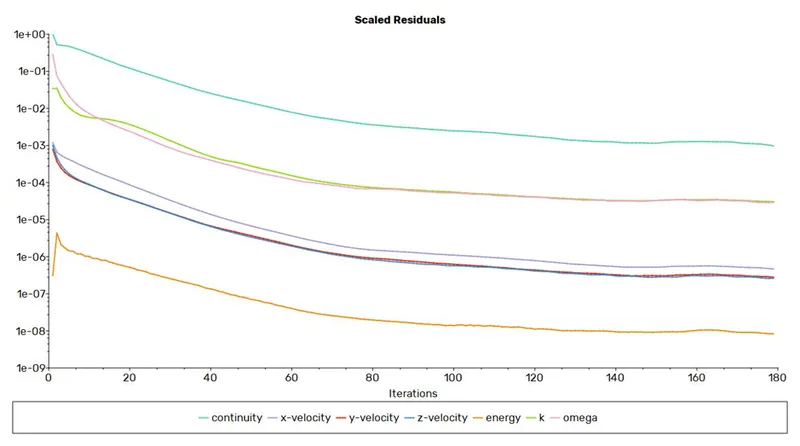
The solution convergence can also be observed here.
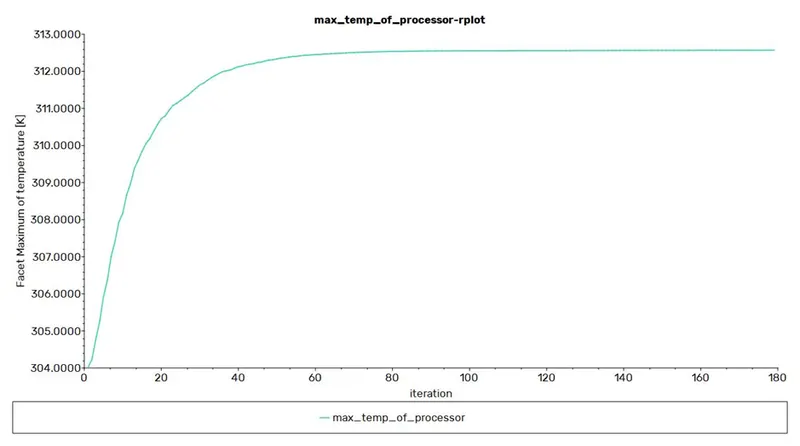
The plot sowing the maximum temperature variation.
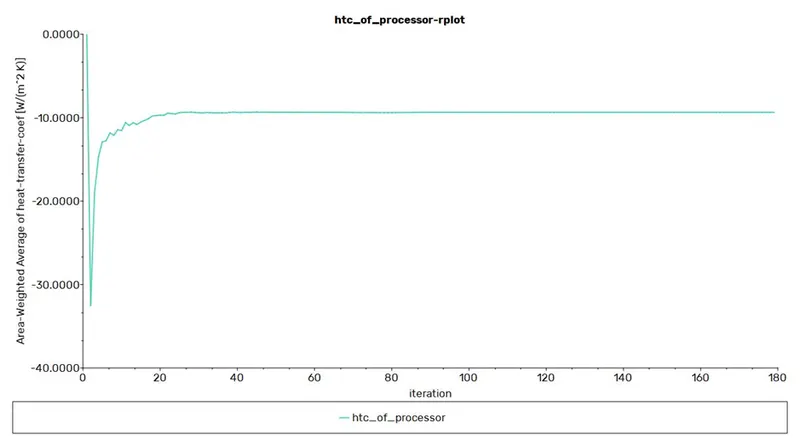
The HTC plot can be seen here.
Learning outcome – Here the result can be seen varying as the velocity at the increasing gradually. The heat transfer coefficient is looking increasing as the velocity of inlet air increases which justify that the velocity of inlet air directly proportional to the HTC which is theoretically proven.
Here the negative sign showing the heat leaving the system. Also the maximum temperature of the graphic card is decreasing with the air inlet velocity which again justify the phenomena of heat convection.
to check for the solution convergence the constant line can be observed also from the console tab the values of the continuity can be seen. For numerical accuracy, you should expect residuals to be as small as possible. Usually, residuals below 1e-3 is a good starting point to move to the next check.
The residual plot also gives an idea regarding the stability of a solution. Observing sudden spikes shows that the solution encountered problems. The results of such simulations are not reliable.
Conclusion- As the solution is reaching to the convergence the final values of variables can be obtain here which is looking fine and giving the justification over the theoretical study.
The conjugate heat analyses here justifying the theory related to the heat transfer, also here the hotspot we have selected for the heat generation is directly connected with the fins whose material is aluminium and we can see the conduction phenomena over the fin as well.
So overall the concept of heat transfer which was studies during the college time is practically seen here by the use of ANSYS fluent here.