Week 6 - CHT Analysis on a Graphics card
Aim: To Perform a steady state conjugate heat transfer analysis on a model of graphic card
Objective:
- To run the simulation by varying the velocity from 1m/s to 5m/s for three different velocities
- To find the maximum heat transfer and temperature ttained by the processor
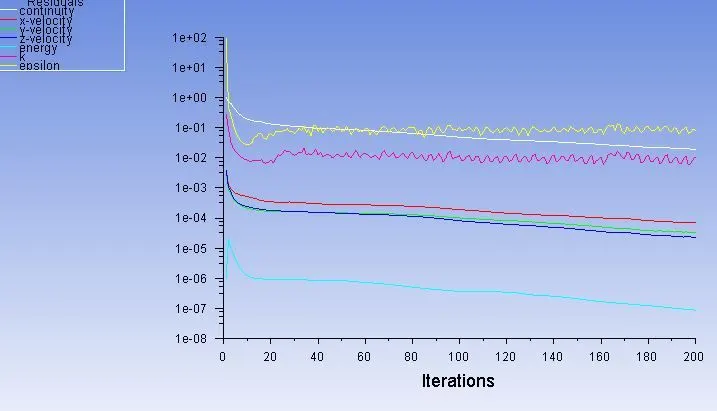
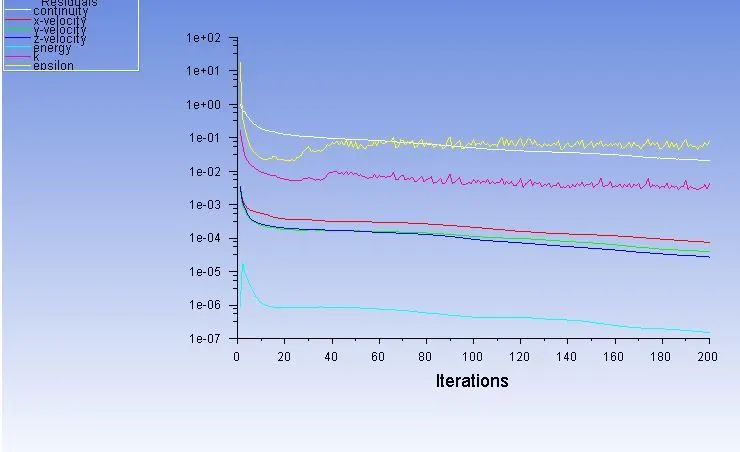
- To prove the simulation has achived convergence with appropriate images and plots
- To identify the potential hotspot on the model
Theory
Conjugate heat transfer is a type of heat transfer between solids(conduction) and fluids(convection). PCB heat sinks are generally used for dissipatng haeat from the processor.The graphic processor when it performs the computational task,it gets heated up very fast. Ths can be lead to thermal damage to the PCB board and other electronic components.Most of the graphic card needs a proper thermal soulation.In this study, conjugate heat transfer analysis is performed to remove the heat from the hot spot area.
Geometry
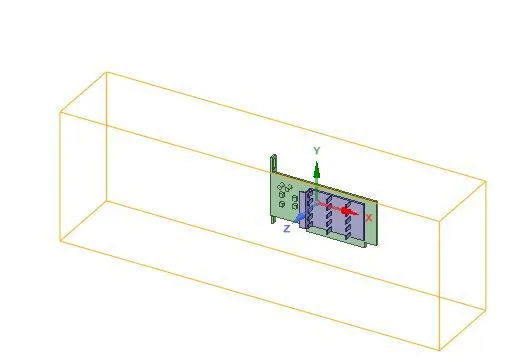
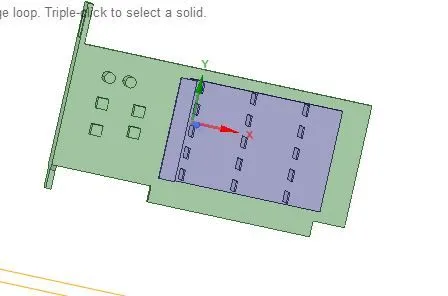
Geometry imported in to space claim and enable share topology option
Mesh
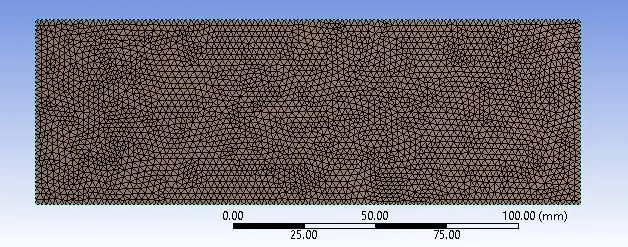
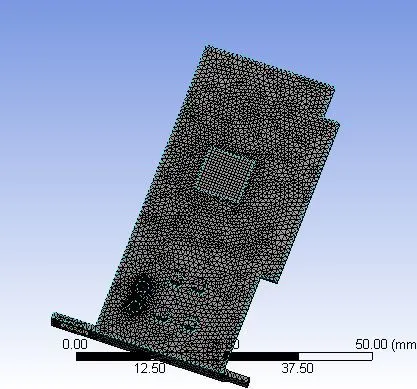
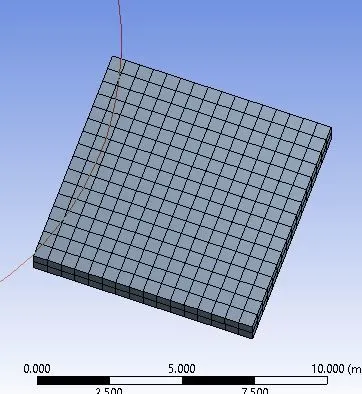
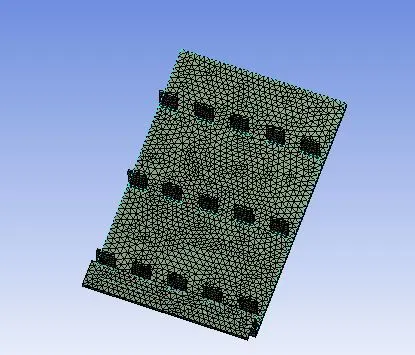
- Generated the base line mesh
- varied the grid size for different component in the model for the simulation
- Boundary condetion is named as Velocity inlet , Pressure outlet and Wall symmetry.
Enclosure
Base
Processor
Fins
Case Setup and Solution Method Involved
- Steady state , Pressure based solved is used
- choosed K-epsiolon turbulence model for the simulation
- Air is used as a cooling material in the fluid domain
- Different materials are assigned to solid part namely,titaninum for Base , aluminum for fin, and gold for processor.
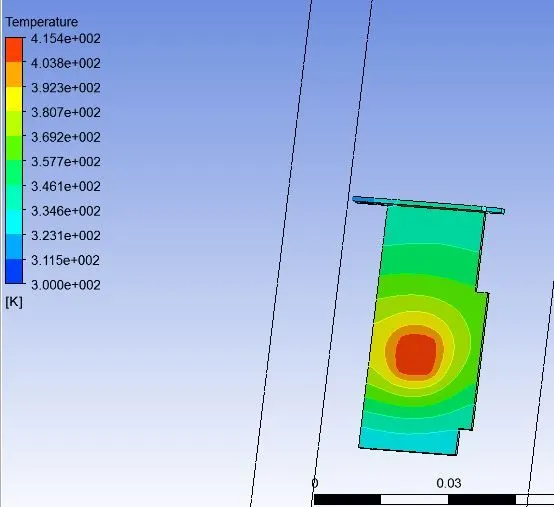
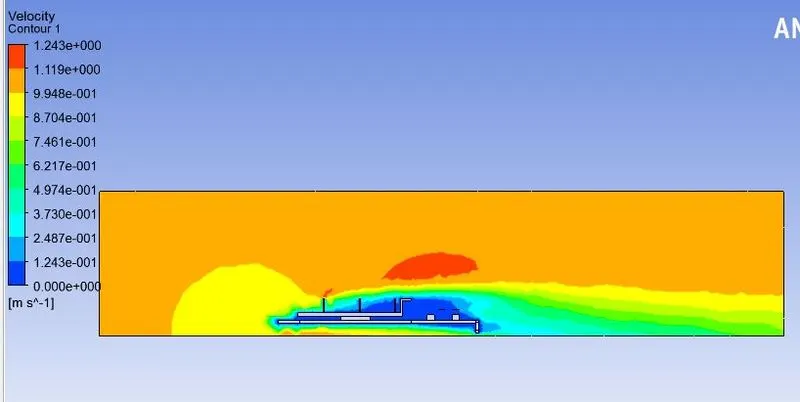
Case-1: 1m/s
Temperature distribution over graphic card
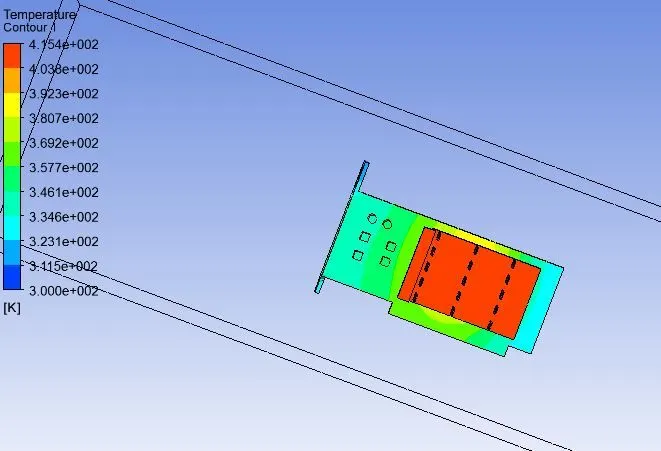
Temperature Contour - Processor
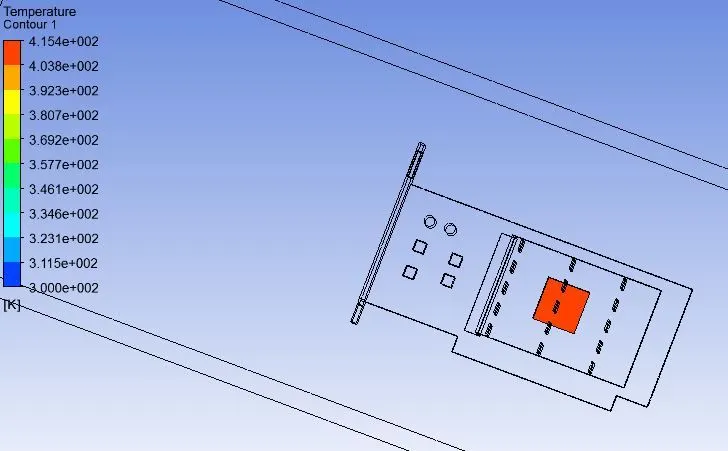
Temperature Hot spot
Velocity
Case-2 -3m/s
Temperature Distribution over the Graphic Card
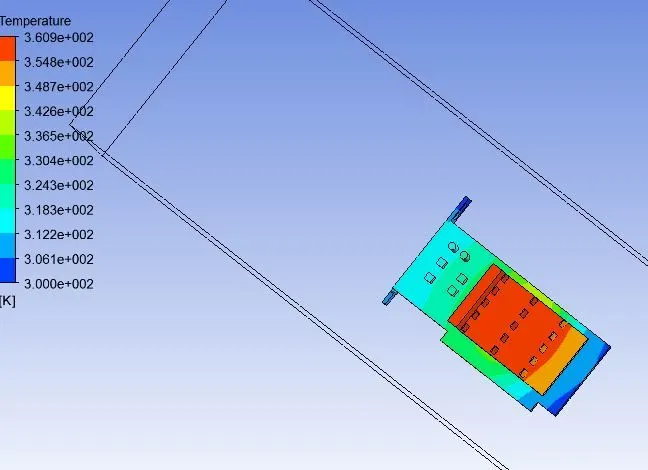
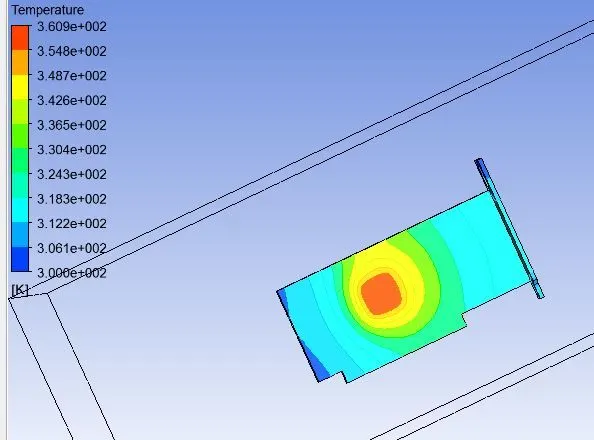
Temperature Contour -Processor
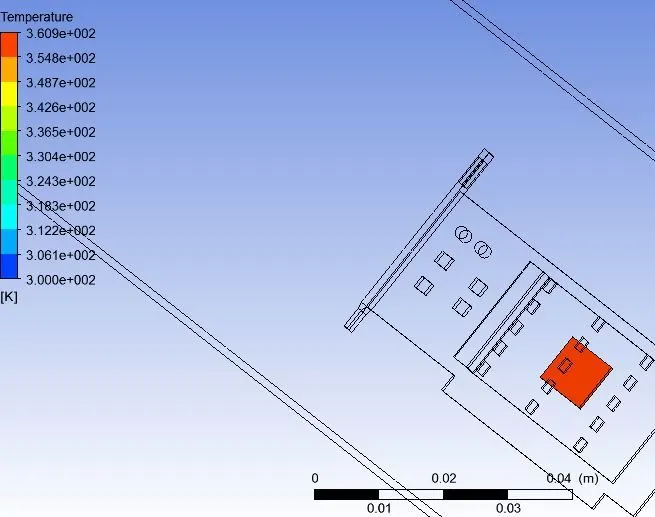
Temperature Hot Spot
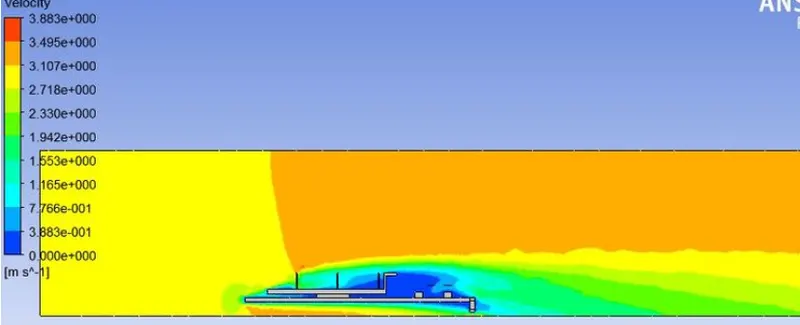
Velocity Contour
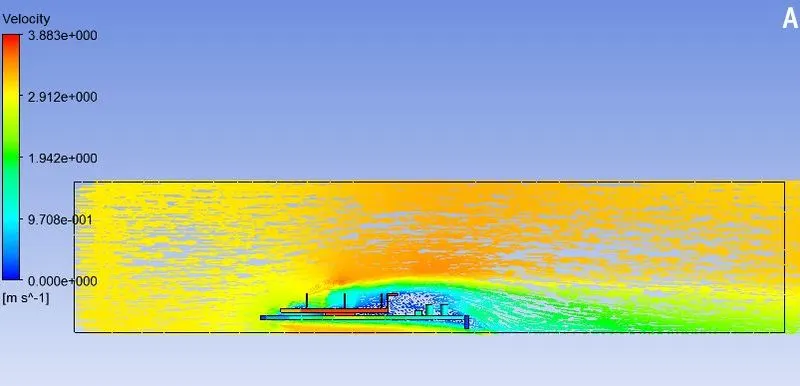
Velocity Streamline
Case-3 -5m/s
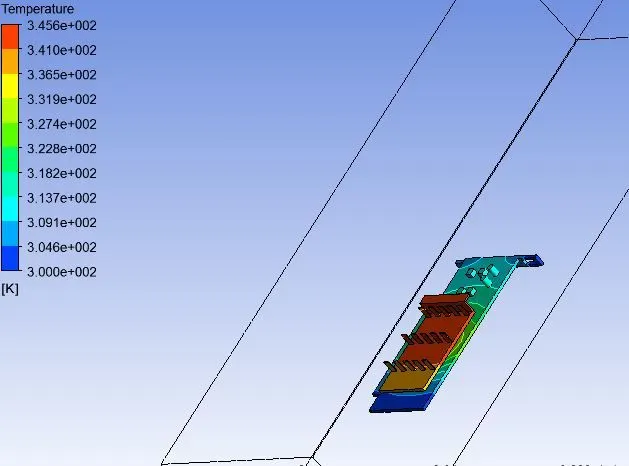
Temperature Contour over graphic card
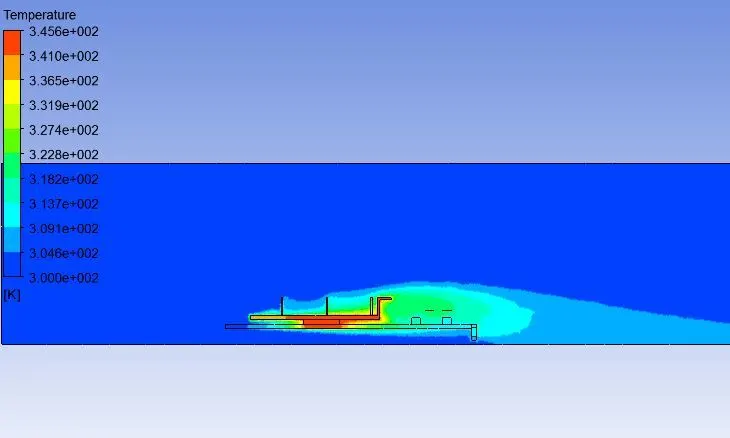
Temperature Contour
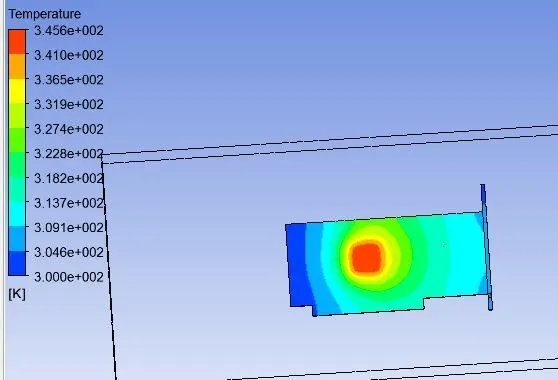
Temperature Hot Spot
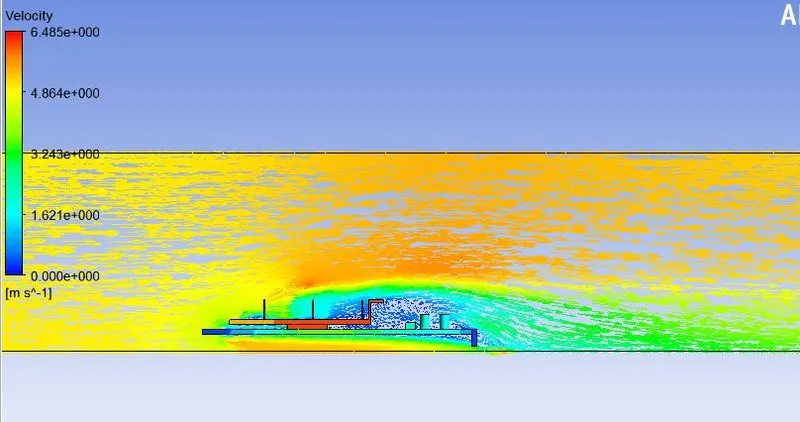
Velocity Contour
| Inlet Velocity(m/s) | Temperature distribution in Processor(K) | Maximum Veocity achived(m/s) |
| 1 | 415.4 | 1.24 |
| 3 | 360.9 | 3.88 |
| 5 | 345.6 | 6.48 |
we came to know that by analysing the contour plot and by comparing the values mentioned in the table, as the inlet velocity increases temperature of the processor decreases. More cooling effect can be achived in the processor area by increasing the velocity.
Conclusion
- As the inlet velocity increases the processor temperature decreases
- The Hot spot region, where the temperature is maximum and the area which is more prone to thermal damage is shown in the image
- Better cooling perfomance can be achived by increasing the inlet velocity.