Week-6 Calculate the Stretch Ratio by comparing the ELFORM (-2,-1,1,2) with Ogden_Material Model.
Objective:
To create a Tensile load simulation using the Ls – Dyna and to find the Engineering stress and strain and stretch ratio.
- Create the Cube and add the given Ogden material property and Solid section to the cube.
- Create the constraints and displacement for the cube.
- Create the implicit control cards for the cube model and run the simulation.
- Extract the true stress and strain values and calculate the engineering stress and strain.
- Plot the graph using Normal stress and Stretch ratio in Excel software.
Procedure:
- Open the Ogden material which is given in the. k format in the Ls-Dyna
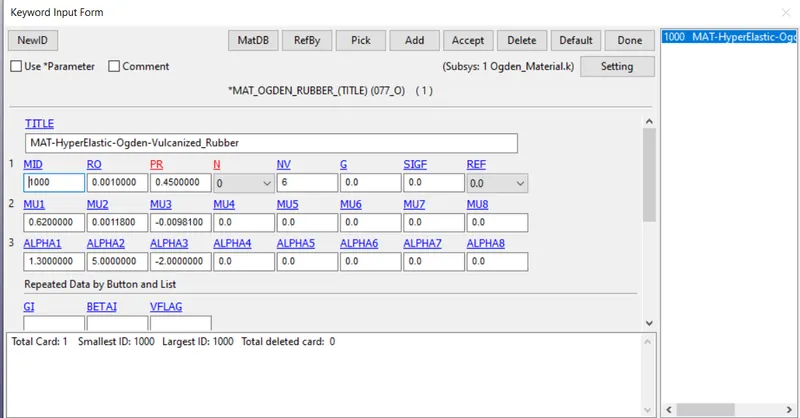
- Now we have the material card but we need to create a cube.
- To create a cube with mesh elements, go to the element and mesh deck and select the block meshes and give the dimensions of the cube and accept it.
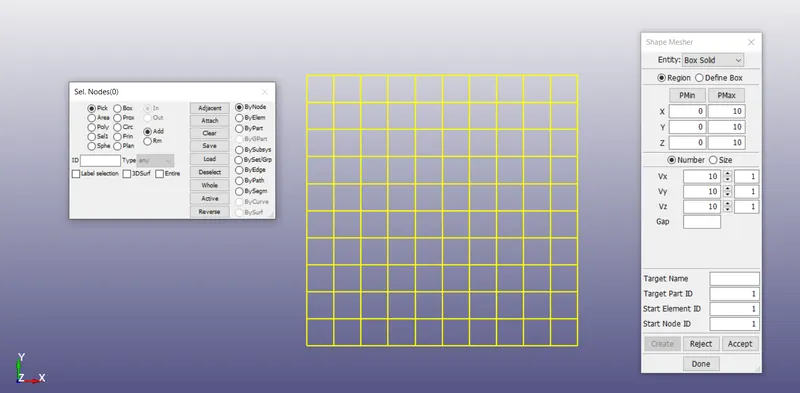
- Now we have the cube with mesh and material card which is given and we have to create the section solid for the cube so go to the section and select the solid and give el form as ‘1’ (-1,2, -2 are used later) and accept it.
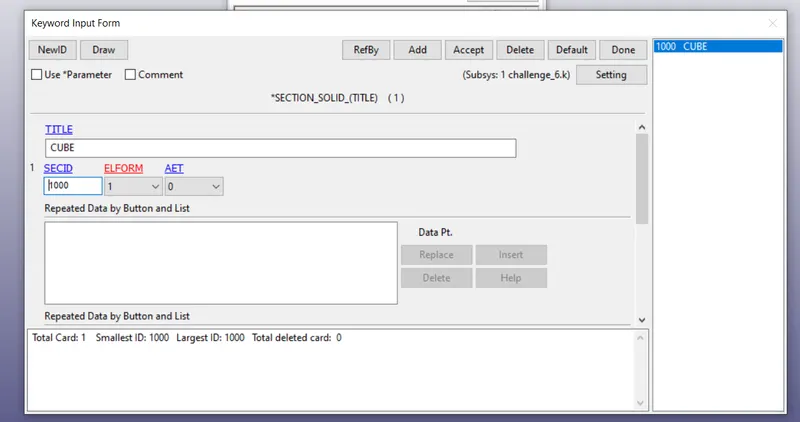
- After that, we need to specify the material and section cards in the part card.
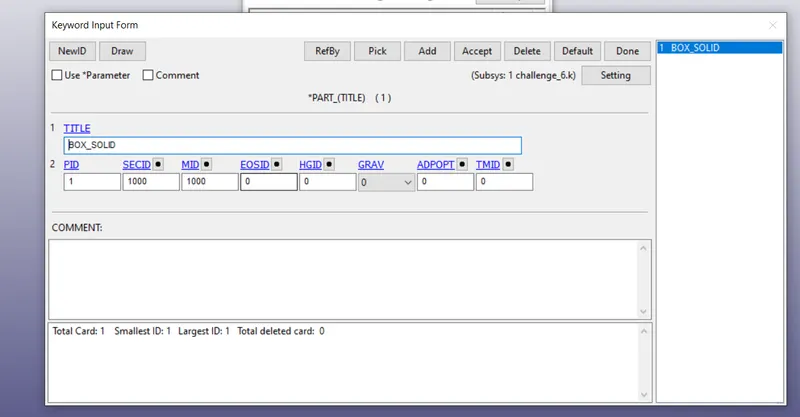
- Now we have the complete cube model but to run simulation as a tensile test we need to create a constraint and displacement for the cube.
- To create a constraint, go to the create entity and select the boundary option and select the SPC option and create an X, Y, Z constraints and accept it
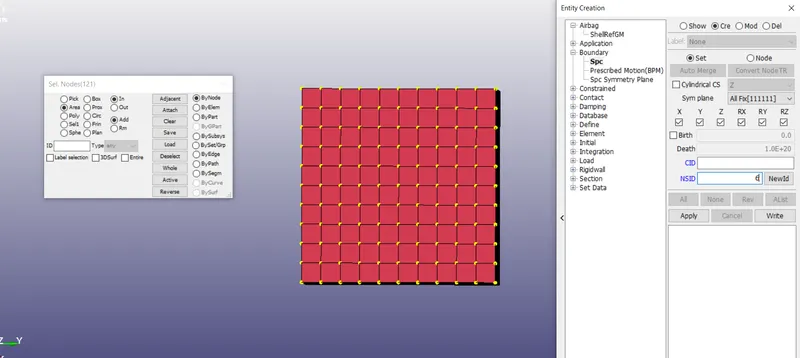
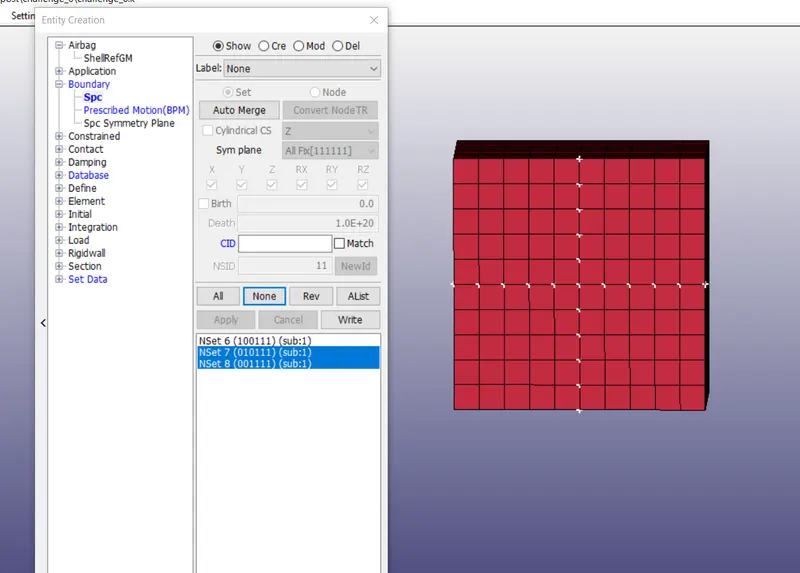
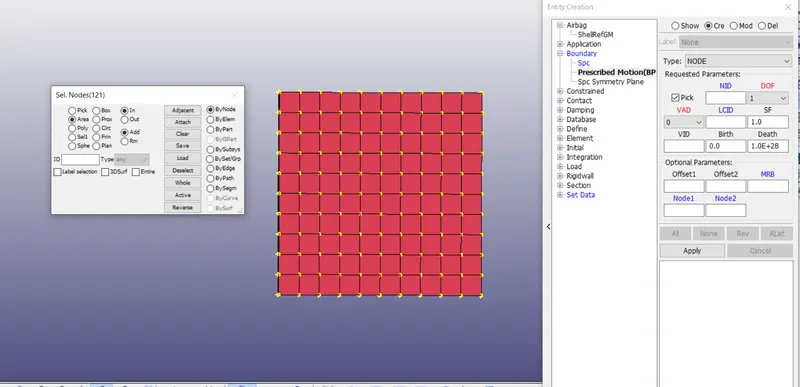
- To create a displacement card, go to the prescribed motion option and select the nodes which have to move and give the velocity for that and accept it.
- Now we have everything for the simulation but to extract the results we need to create a database card for the model.
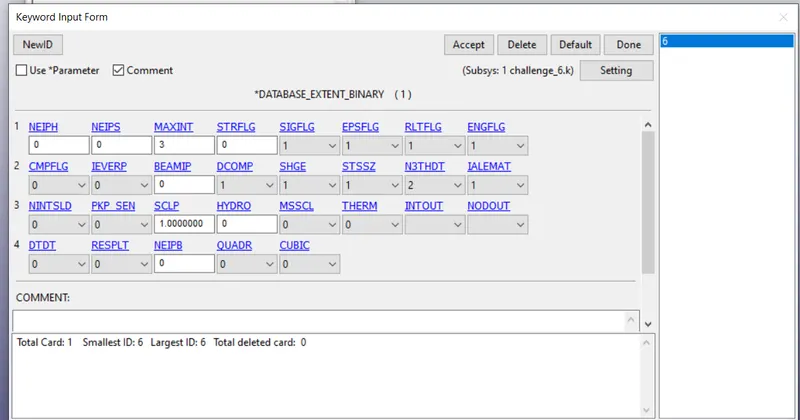
- To create the database card, go to the extent binary and give STRFLG as ‘1’, this is due to extract the true strain values for the model and accept the card. Binary plots and ASCII cards have to be created for the stress values.
- Since it is the nonlinear implicit analysis we need to create implicit cards like implicit auto, implicit general, an implicit solution and control termination for the model.
- In the implicit analysis, termination does not represent the analysis time.
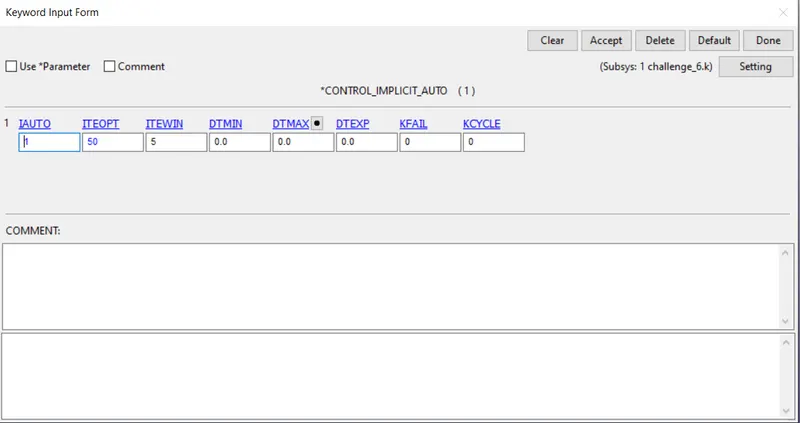
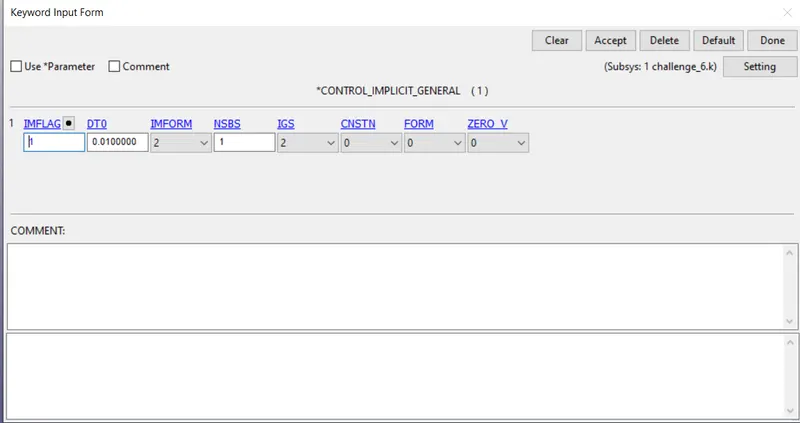
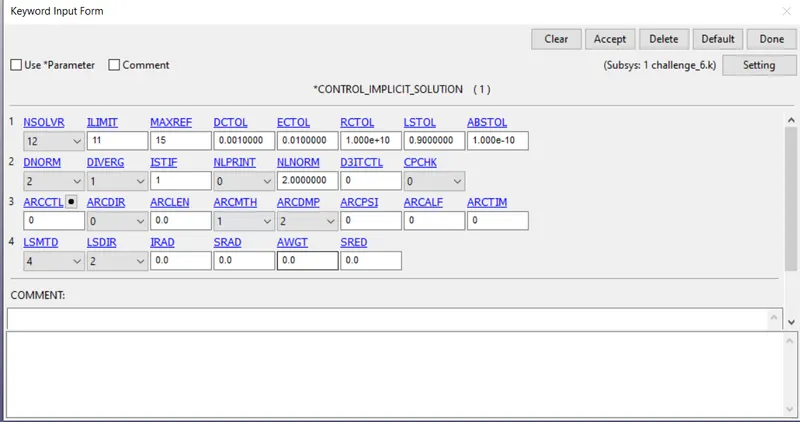
- Now we have completed the cube model for the tensile load analysis and save the file in. k format and run the file in Ls manager and if shows normal termination then the model has the right results.
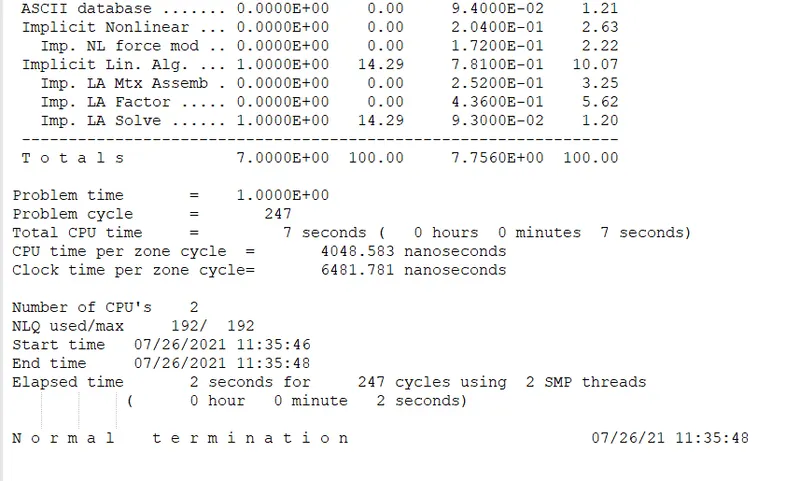
- Now do the same steps for the element formulation for -1, 2, -2.
Results and Discussion:
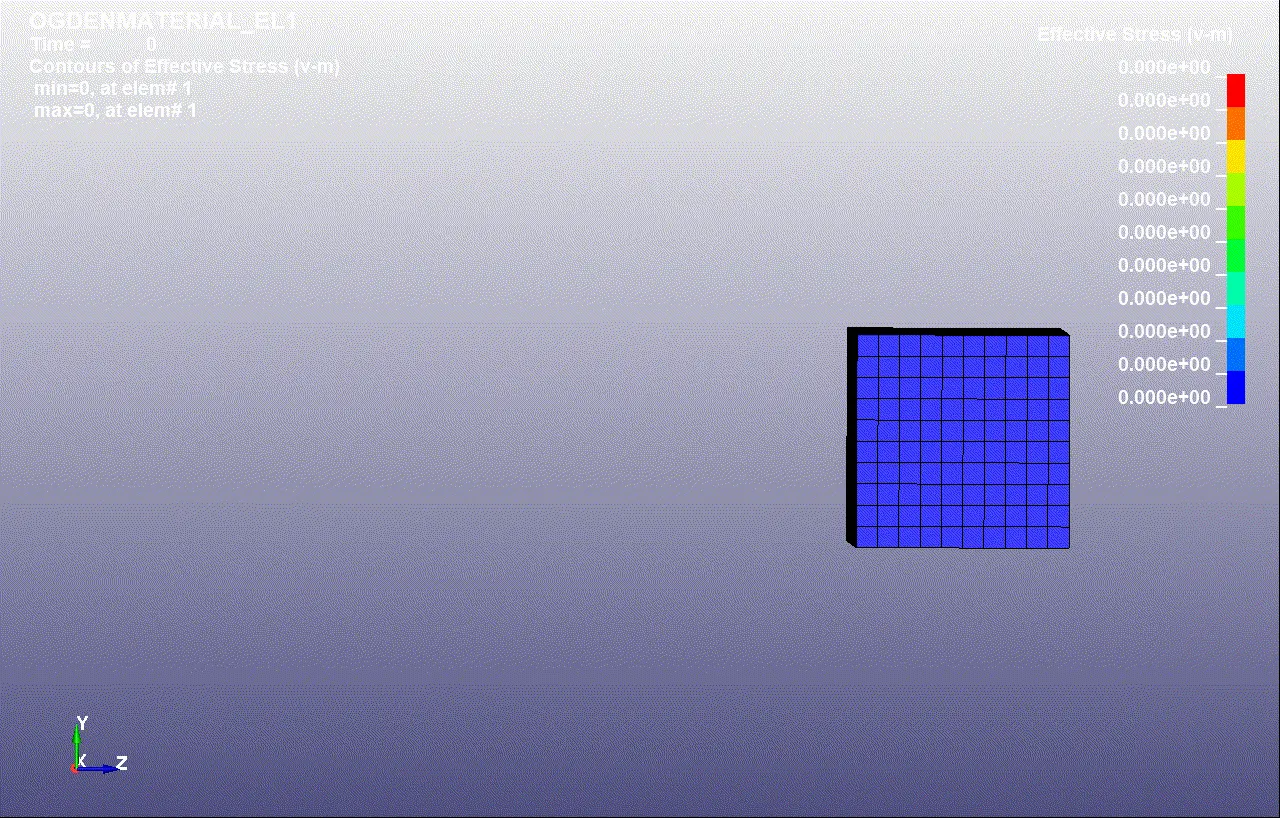
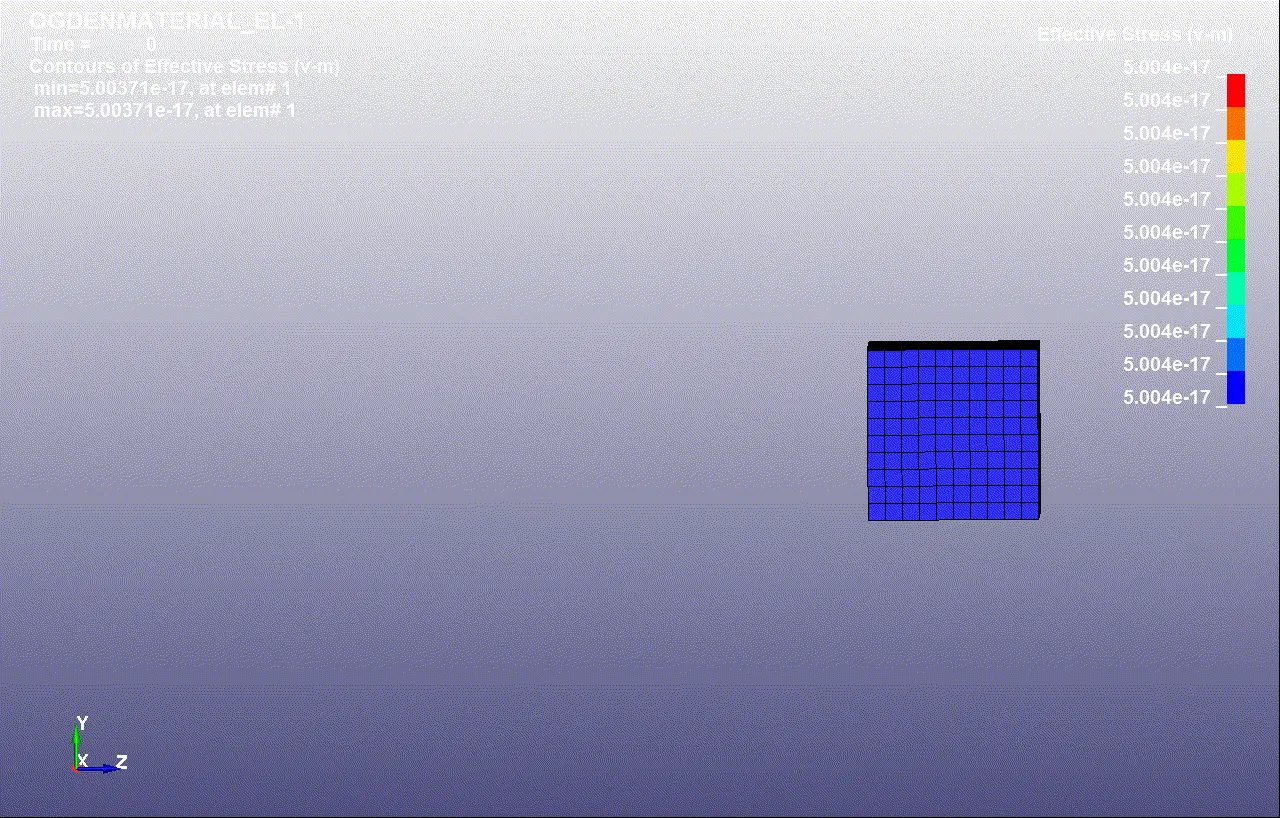
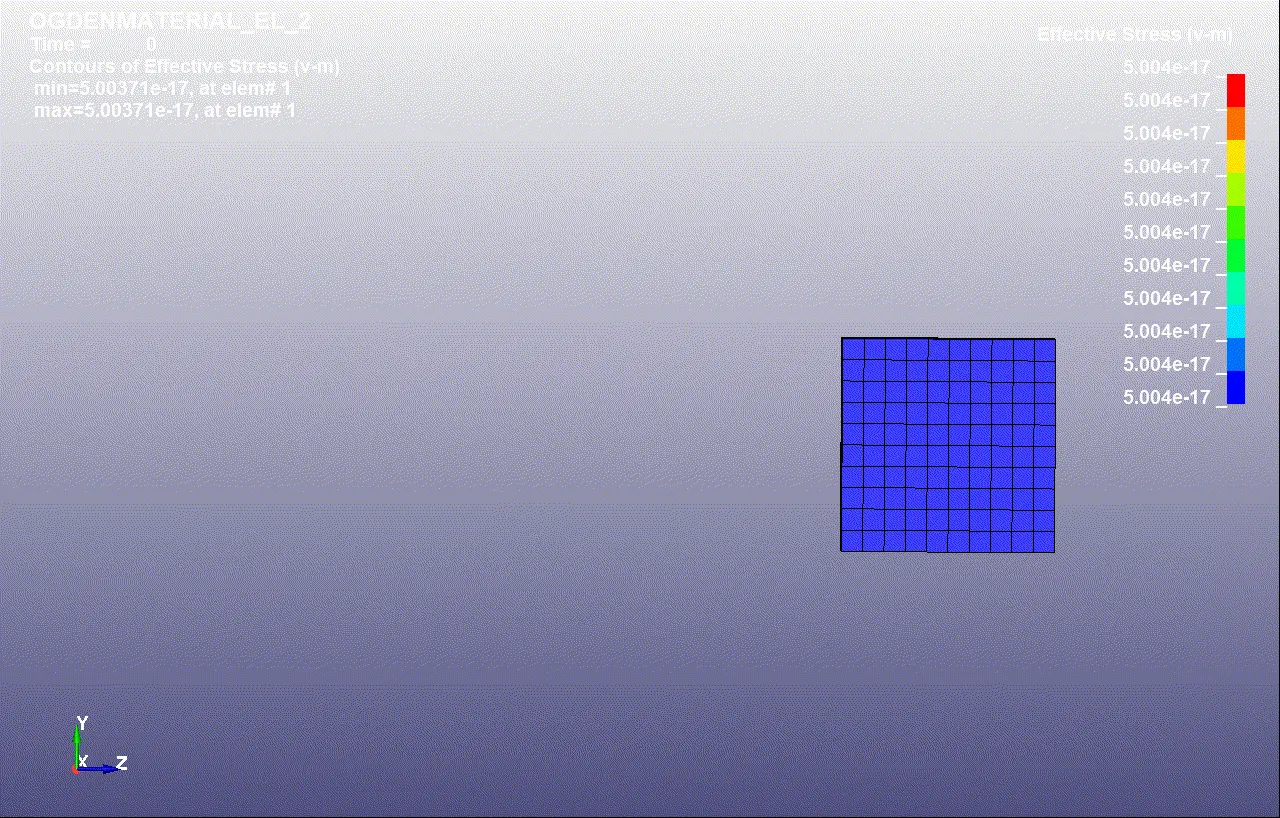
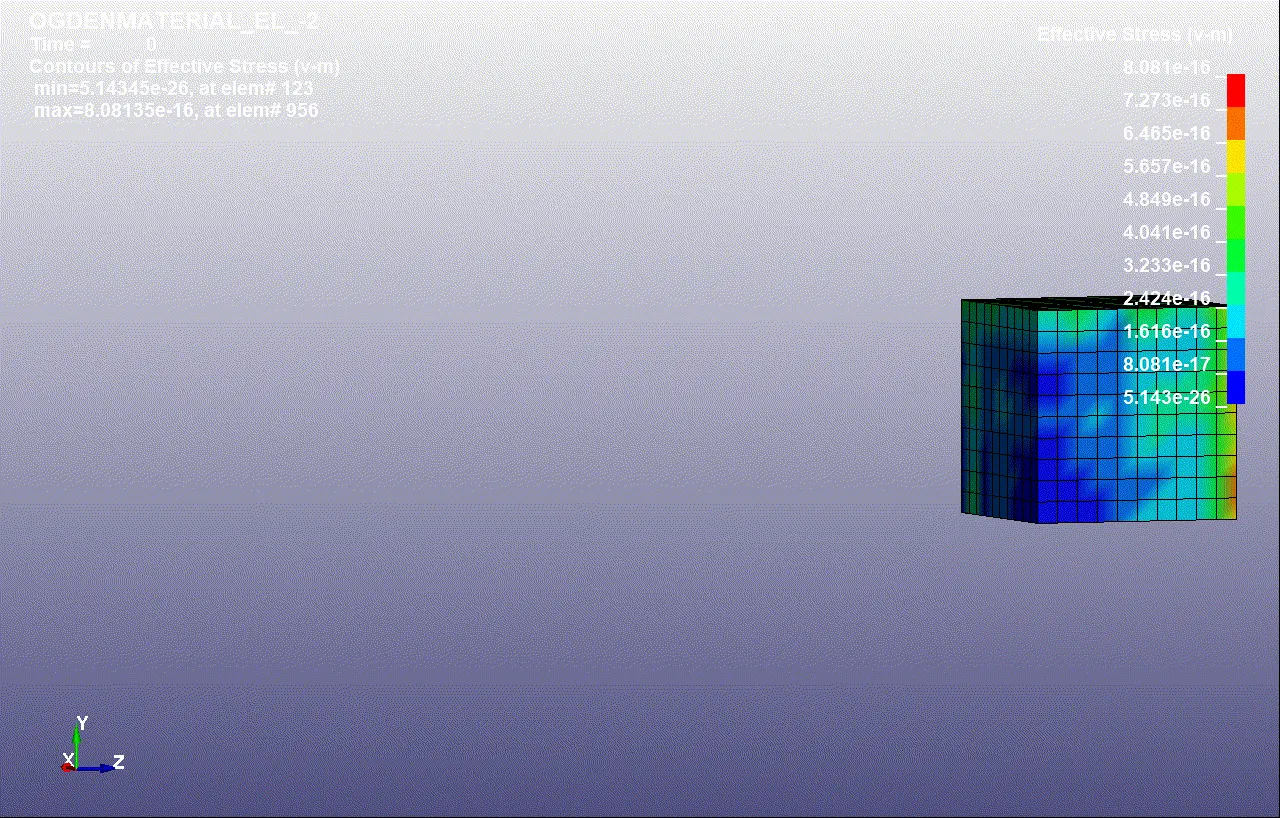
- After running the file in ls manager open the d3plot file in the ls pre-post software and run the animation of analysis.
The animation of Von-Mises stress contour:
Stress vs stretch ratio for uniaxial test :
- Next, we plot the desired graphs for simulations of different forms namely from 1,2 -1 & -2 as shown below. Then we plot the graph for the Stress vs stretch ratio for the different elforms. To get this first we must plot the stress vs strain for each simulation.
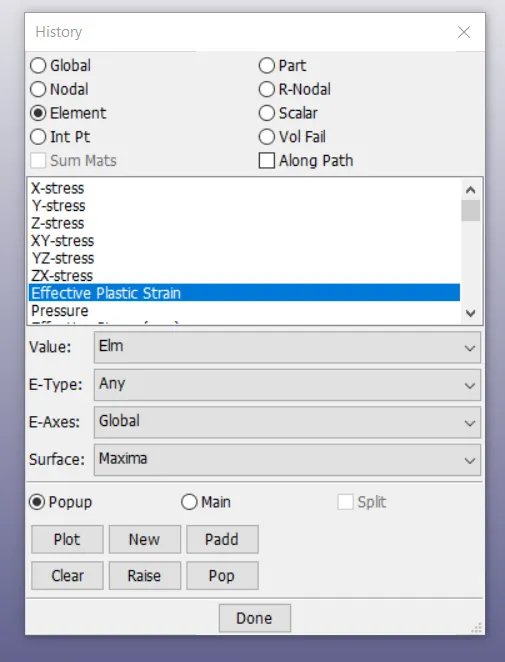
- Go to history> first plot effective plastic strain, then plot effective stress against time, save both the graphs.
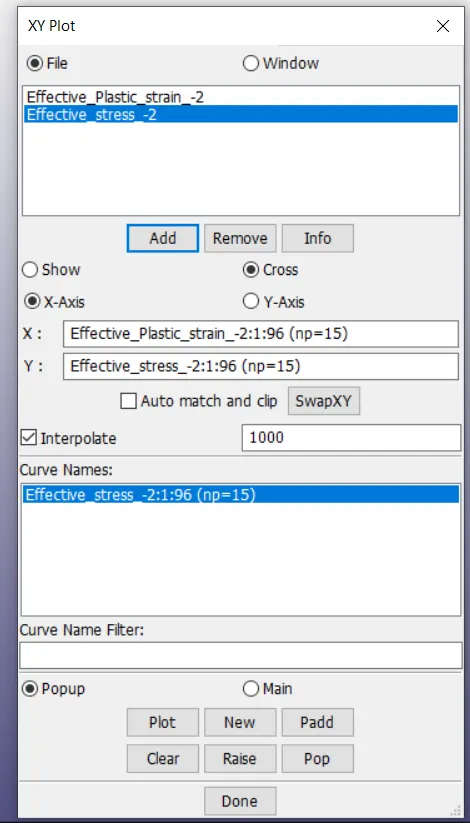
- Then go to XY option>cross plot, the select strain on x-axis and stress on the y-axis. and save the resulting graph. The graph will look like this. For all the case scenarios the same element is chosen for uniformity.
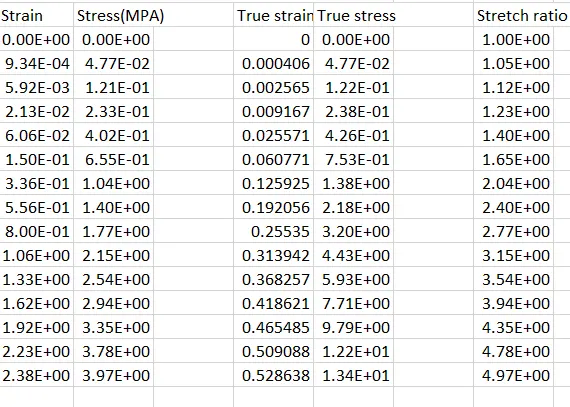
- Next, we save these graphs in .csv format. Open it in excel and to convert strain to the Stretch ratio we perform the following operation
- E =ln(e+1) where E = True strain and e = Engineering strain
- St = Se*(1+e) where St = True stress and Se = Engineering stress
- Stretch Ratio = e+1 and Normal stress = True stress/Stretch ratio.
- With the help of the above data, we can plot the graph Normal stress vs Stretch ratio.
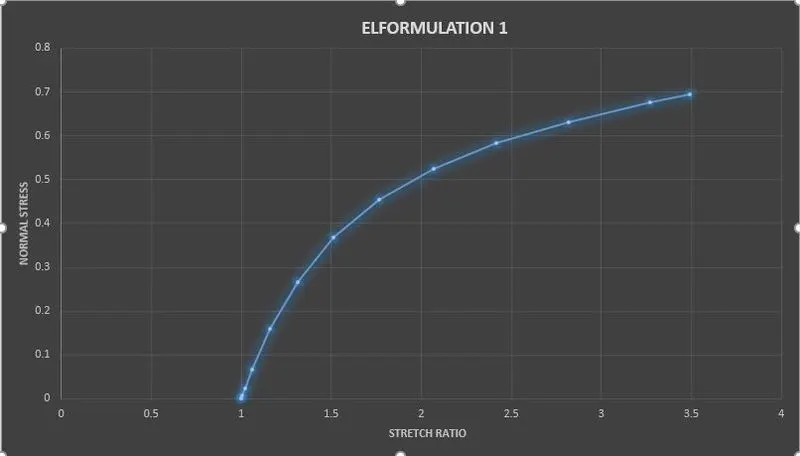
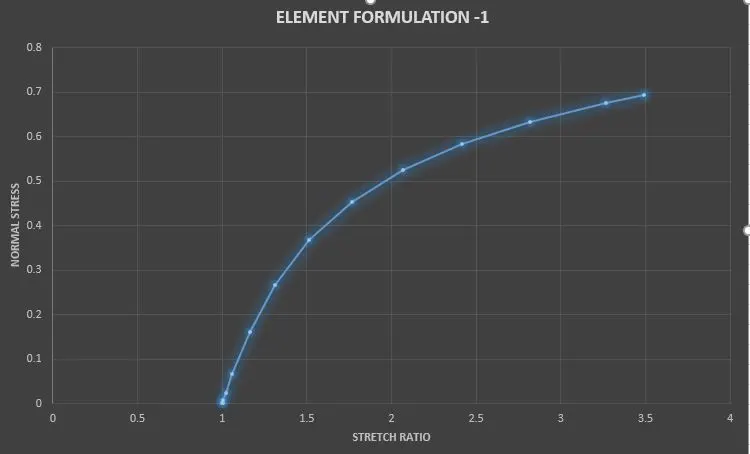
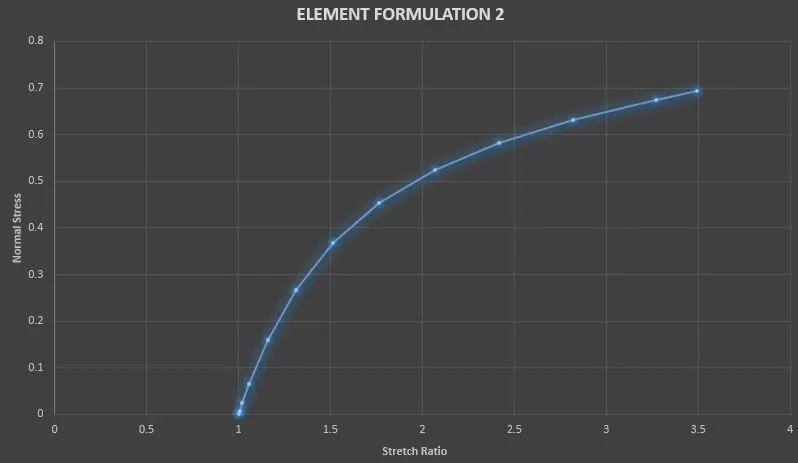
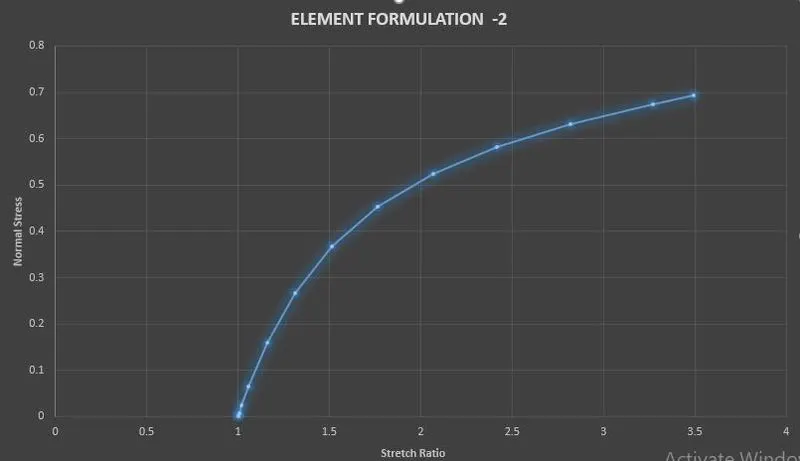
- As we can see we have applied uniaxial tension on the cube and the stretch ratio is increasing exponentially with respect to the normal stress.
CONCLUSION:
- Thus we have done a simulation on the Ogden material cube with uniaxial tensile load and find out the engineering stress and strain and stretch ratio and plotted the graph of Normal stress vs stretch ratio.