Week-6 Calculate the Stretch Ratio by comparing the ELFORM (-2,-1,1,2) with Ogden_Material Model.
Aim : To study the tensile test behaviour of the hyperelastic material card given in the question.
Procedure :
Setting up the simulation :
- Creation of Solid block :
GO to element & Mesh-->shape mesher and select the following options.
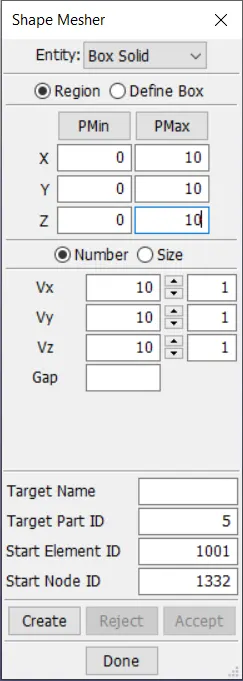
This will create a solid cube of 10mm*10mm*10mm made of 10 cubes of 1mm each as requested in the question.
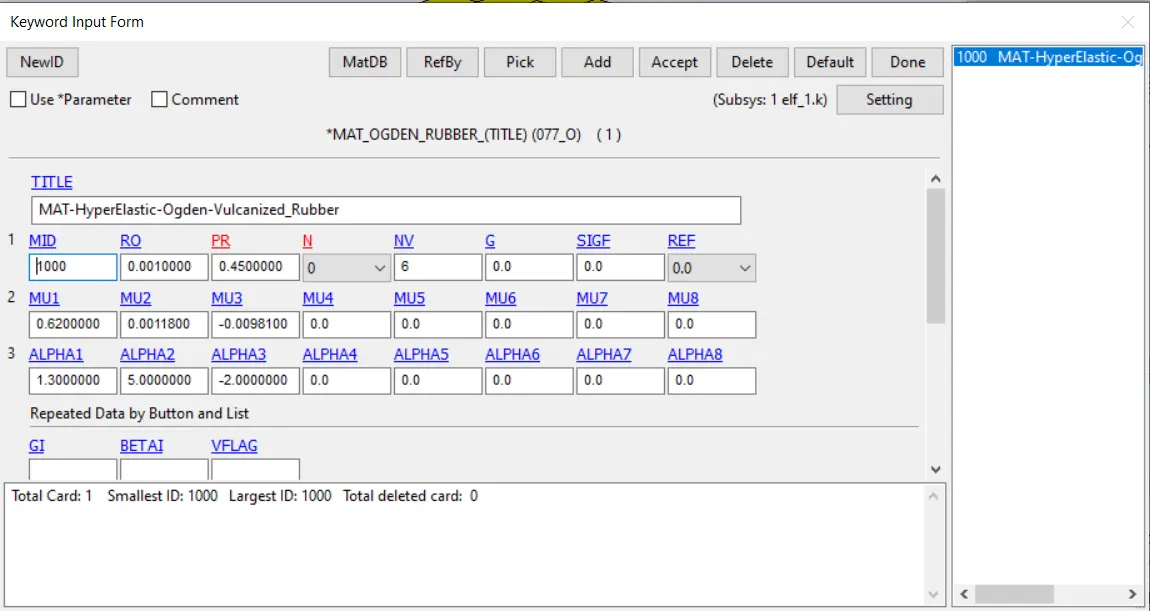
- Material property : The material property card is already given, go to MAT. Inputted unit system is g, ms, mm.
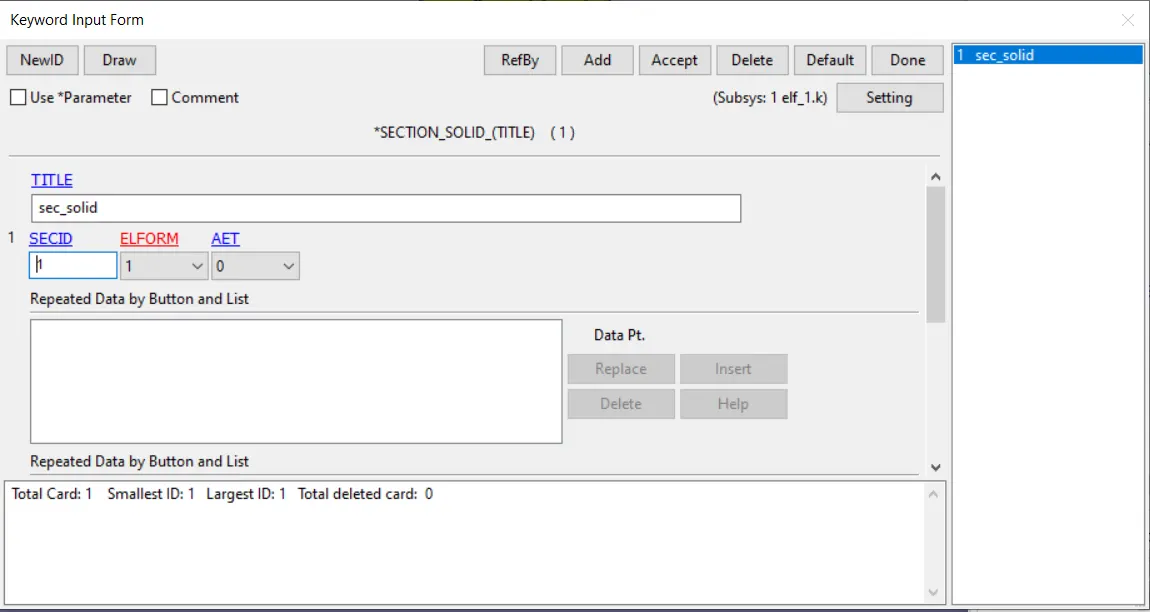
- Creation of Section : Next we create a section by going to Section and selecting the following options in the card for solid elements. Select ELFORM as 1 for the first case.
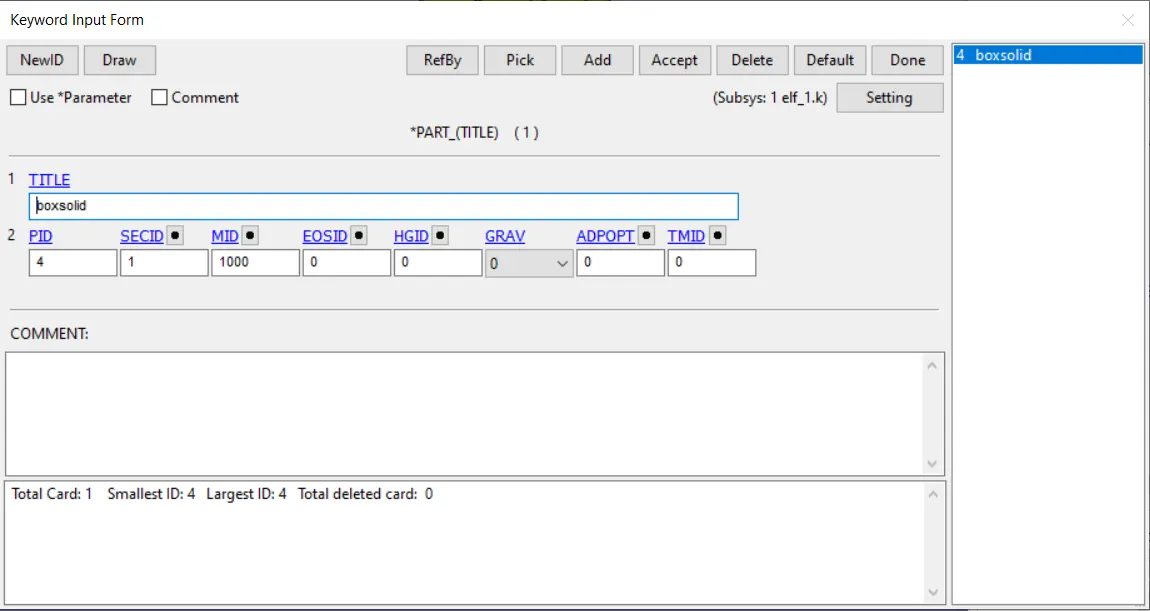
- Assigning to part : Next, we assign the material and section to the shell_blue and shell_red which share the same material and section by entering the material and section Ids in MID and SECID respectively.
- Defining Boundary Conditions : Go to create entity-->SPCs and create the following conditions.
Select the front face which is to be kept stationary and lock the x translational degree of freedom for this face, as shown below.
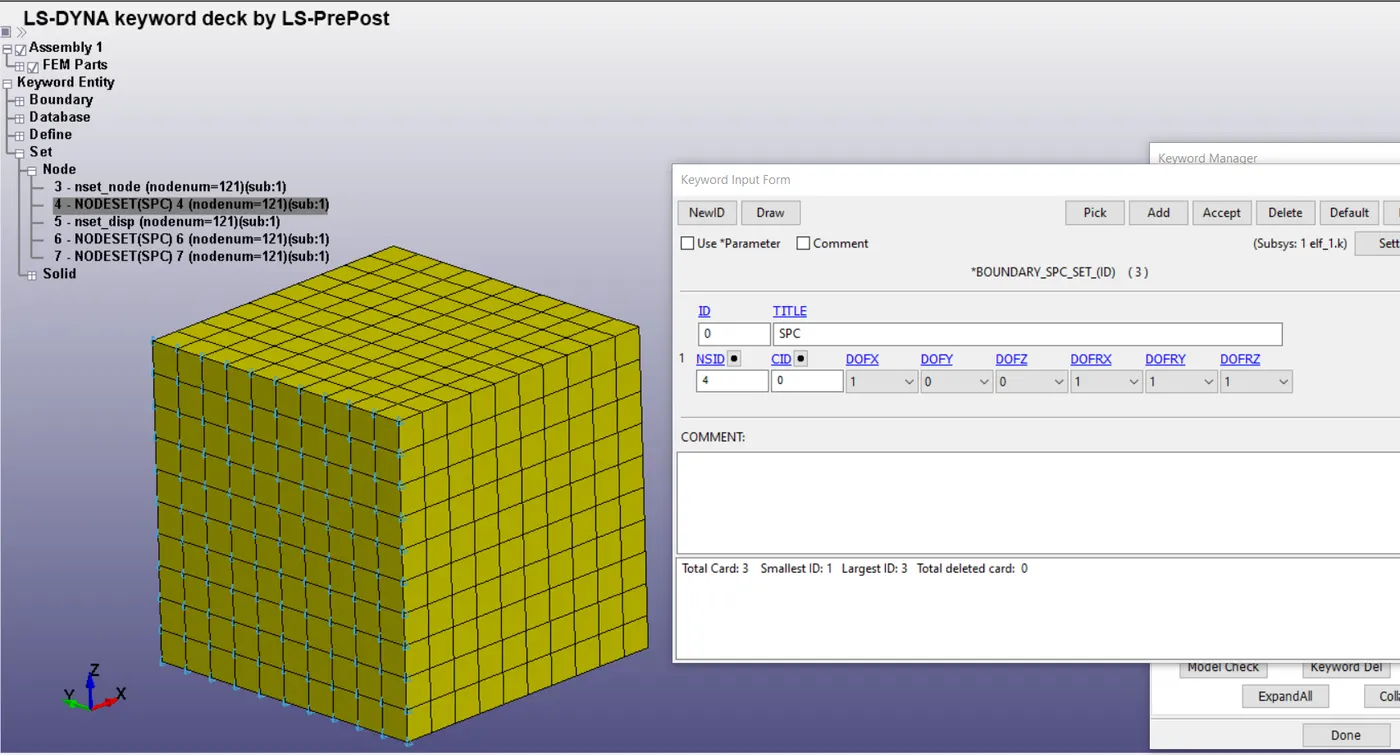
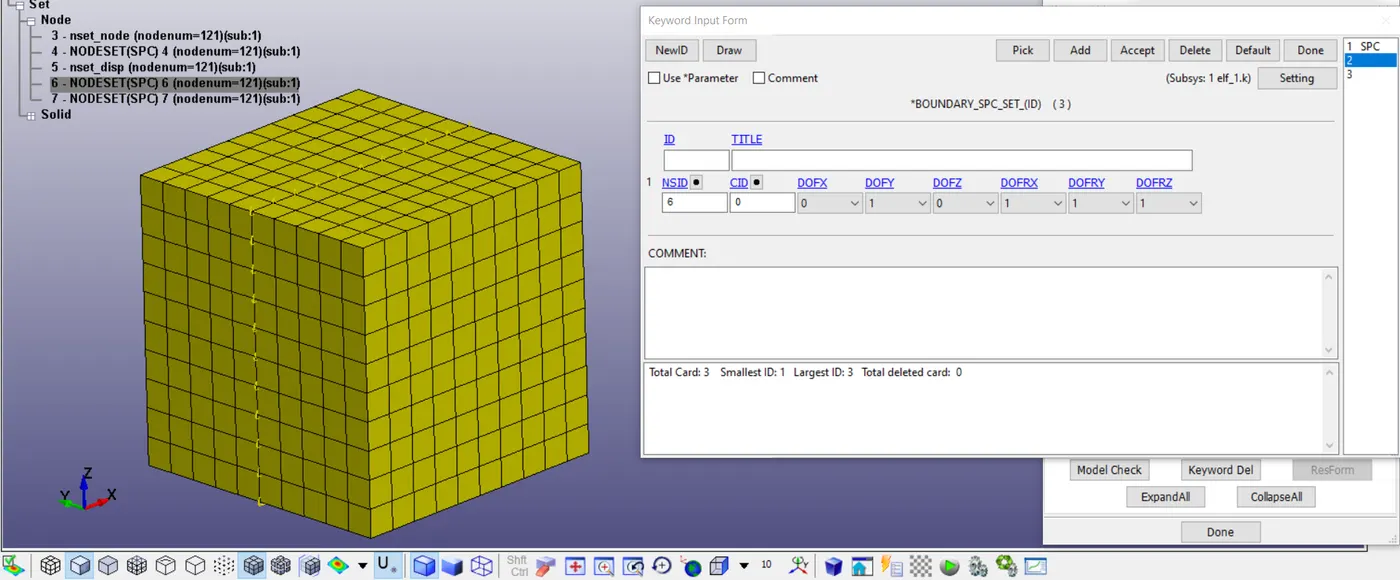
Next we will constrain the neutral axes of the solid block.
Constrain the vertical neutral axis in the y-translational degree of freedom, as shown below.
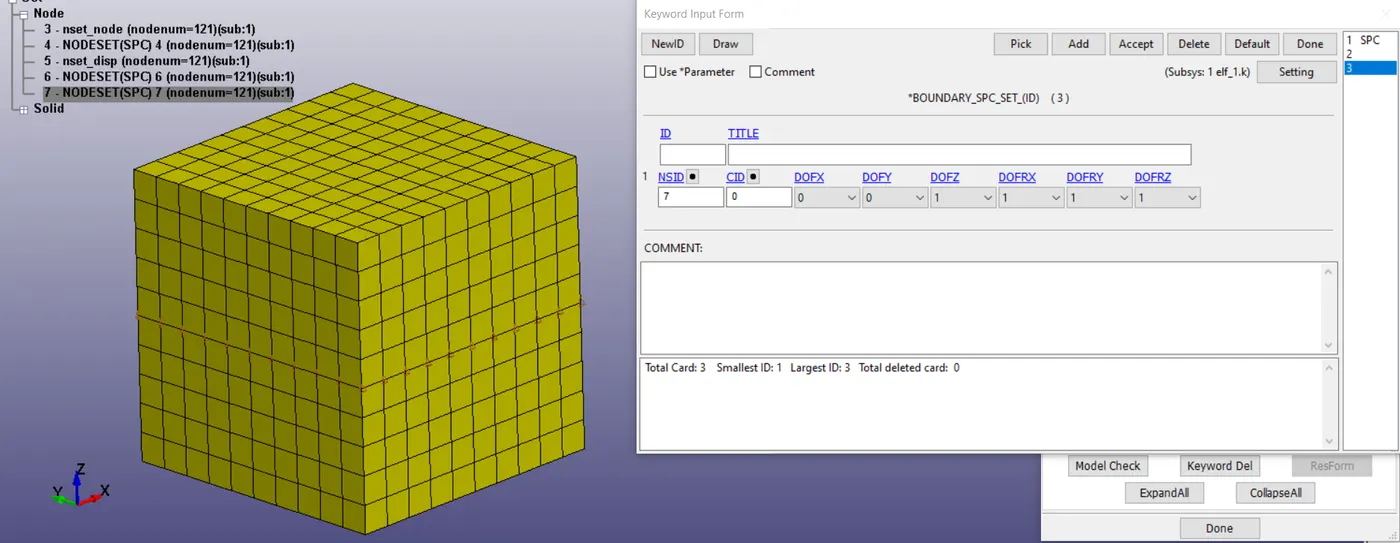
Constrain the horizontal neutral axis in z-translational degree of freedom, as shown below.
- Assigning Displacement :
Go to keyword manager-->define-->curve and create a displacement curve asshown below. For a termination time of 40 ms we need 40mm displacmeent to get a stretch ratio of 5 towards the end of the simulation. The curve looks like this when plotted.
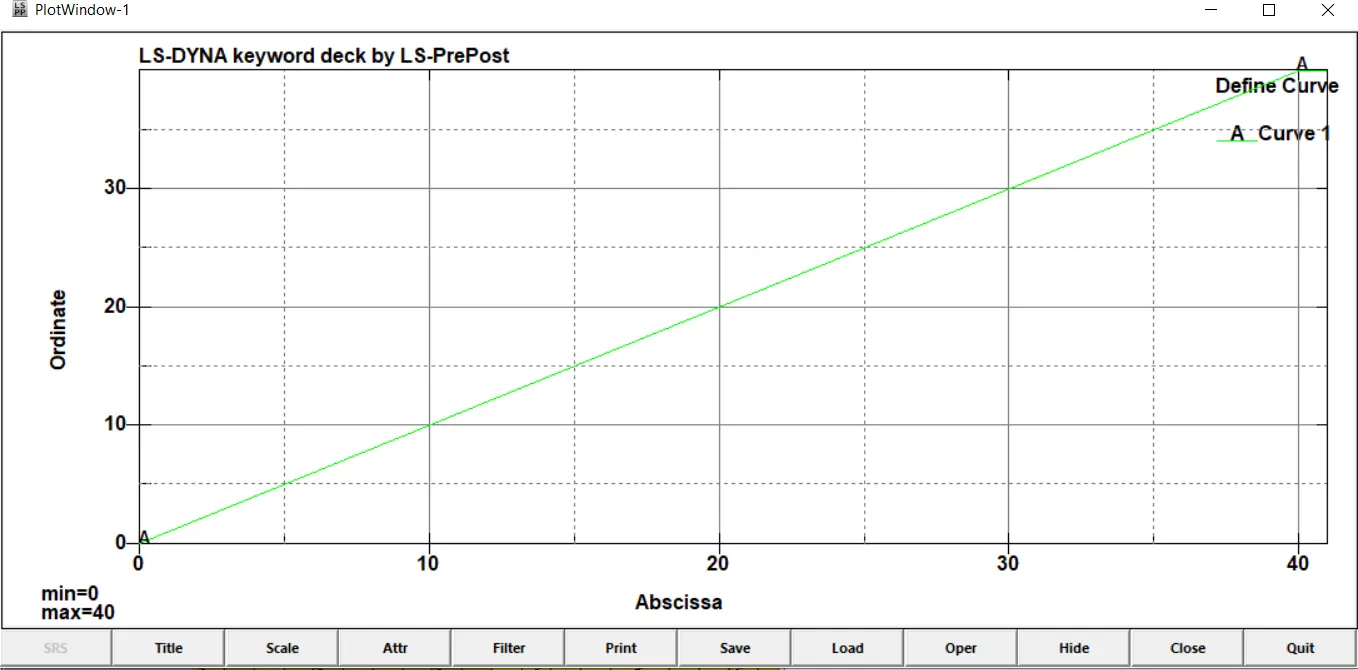
The displacement is defined till slightly after the termination time to avoid errors.
Next we assign this curve to BOUNDARY_PRESCRIBED_MOTION_SET. Select the DOF as 1 indicating translation in x-direction and VAD as 2 for displacement curve input.
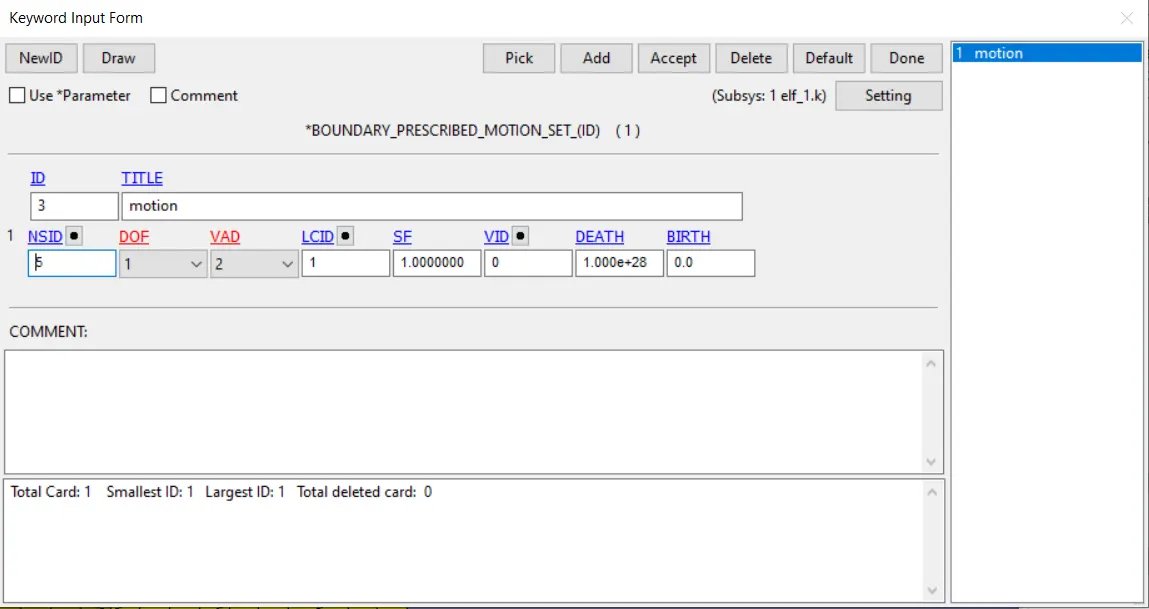
Control parameters : Next we select the control parameters, which govern the conditions in which the simulation will be computed. In this case we specify the implicit analysis parameters.
Control_accuracy : Select IACC 1 for implicit analysis calculations.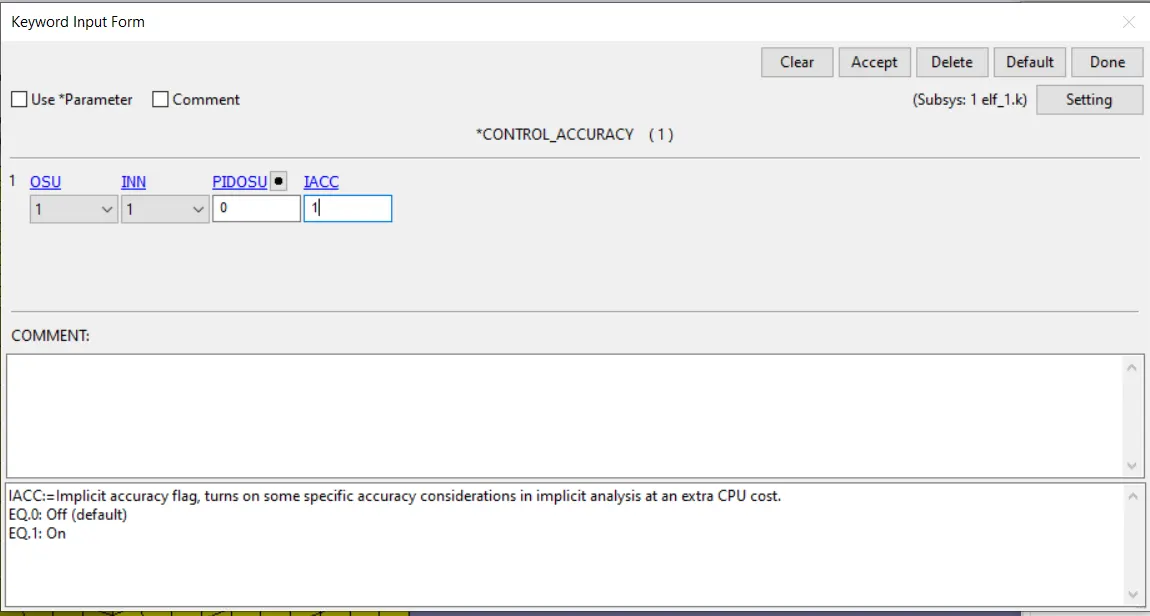
Control_implicit_auto :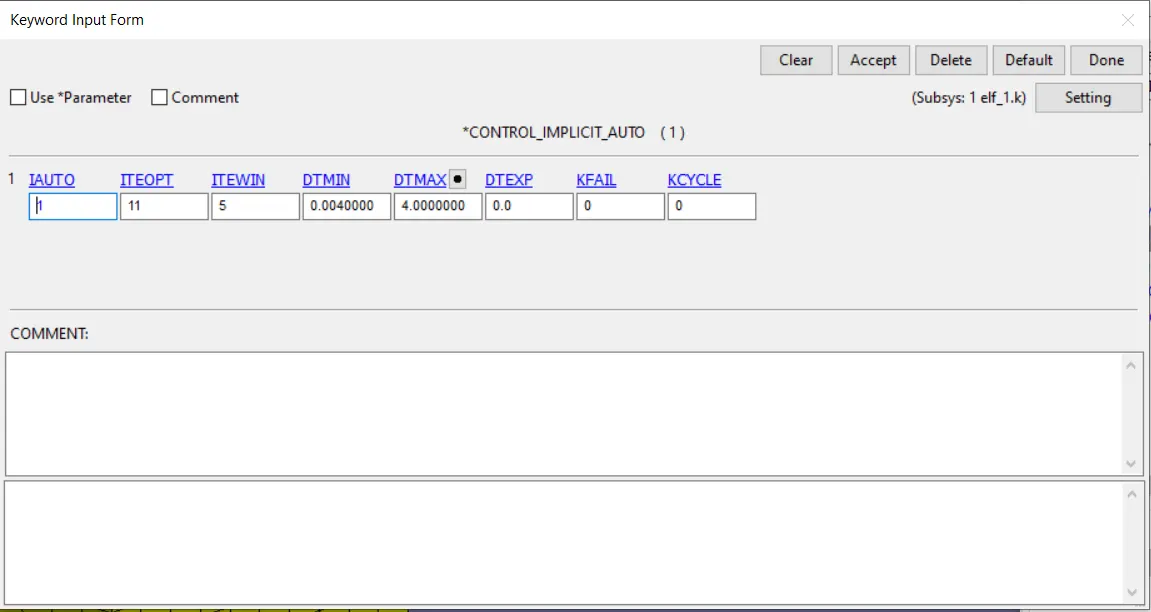
Here DTMIN is taken as timestep/100 and DTMAX = timestep*10.
Control_implicit_general : 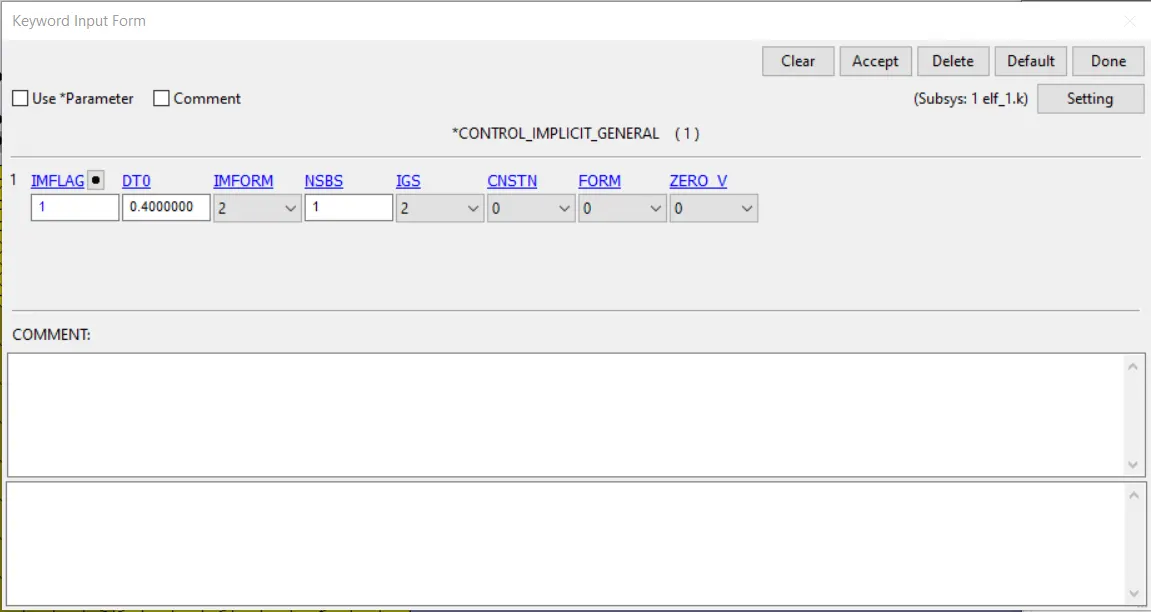
Choose IMFLAG = 1 for implicit solver and DT0 = 0.4ms as total time is 40ms.
Control_implicit_solution : 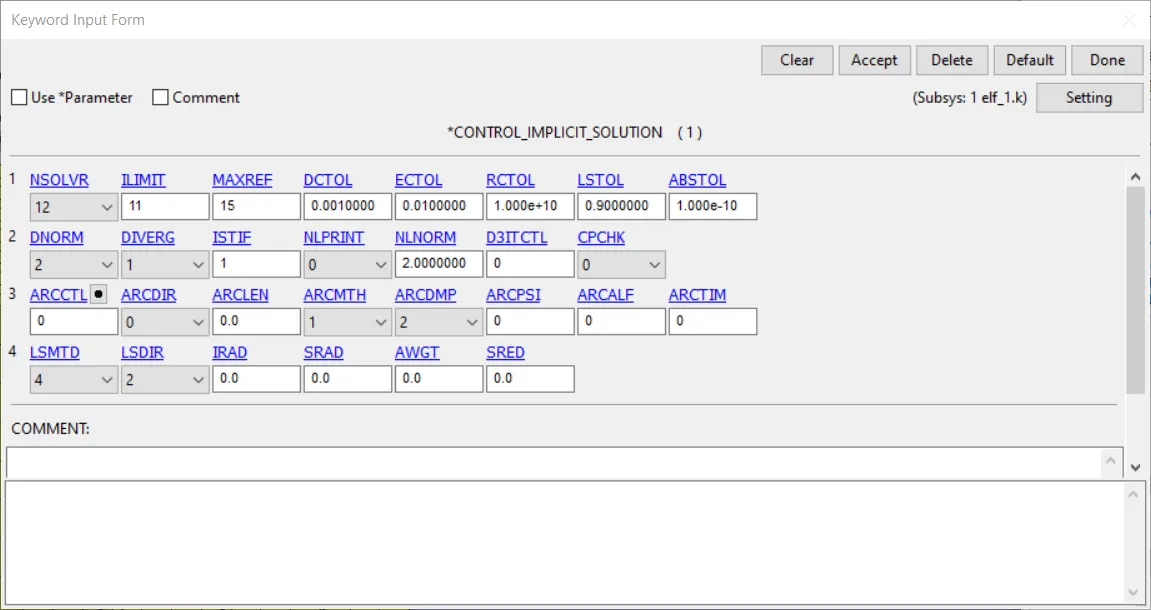
In this card, let the default values remain, this card is generally taken for non-linear simulations as it gives information on the convergence criteria to the solver.
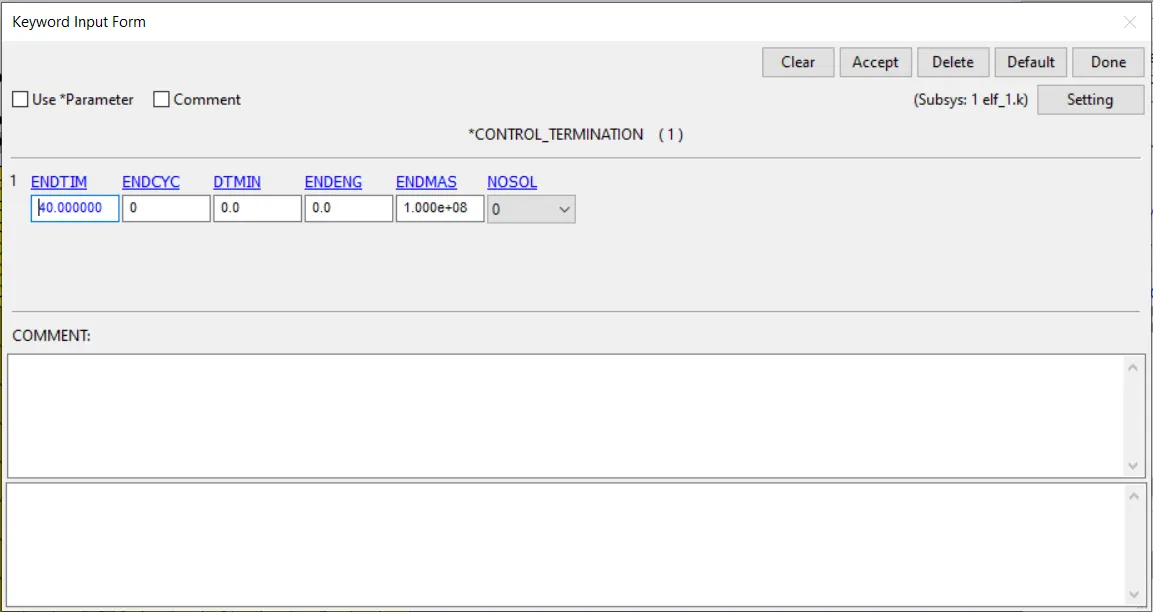
Control_termination :
Choose termination time as 40ms.
Database options : Next we select the options which we want to see in the output characteristics. The following options are selected in Database_ascii. The options GLSTAT, SECFORC, ELOUT are shosen to show the global energy curves, sectional force & element forces respectively.
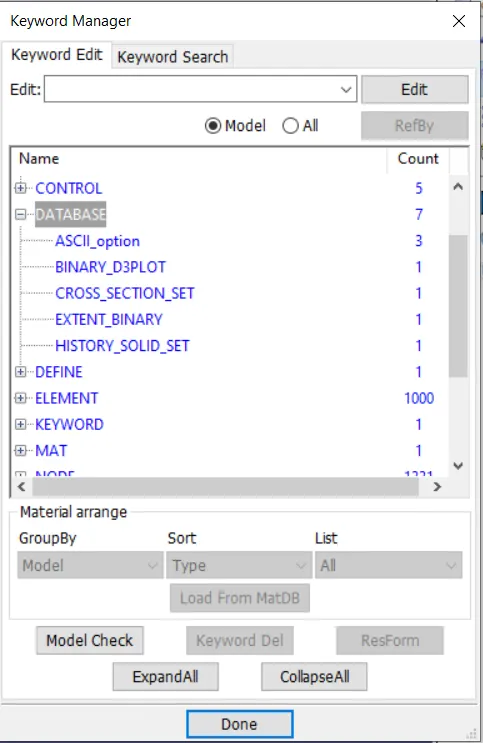
The following options are selected in Database_binary_plot. The timestep is kept at 0.5 milliseconds as shown below.
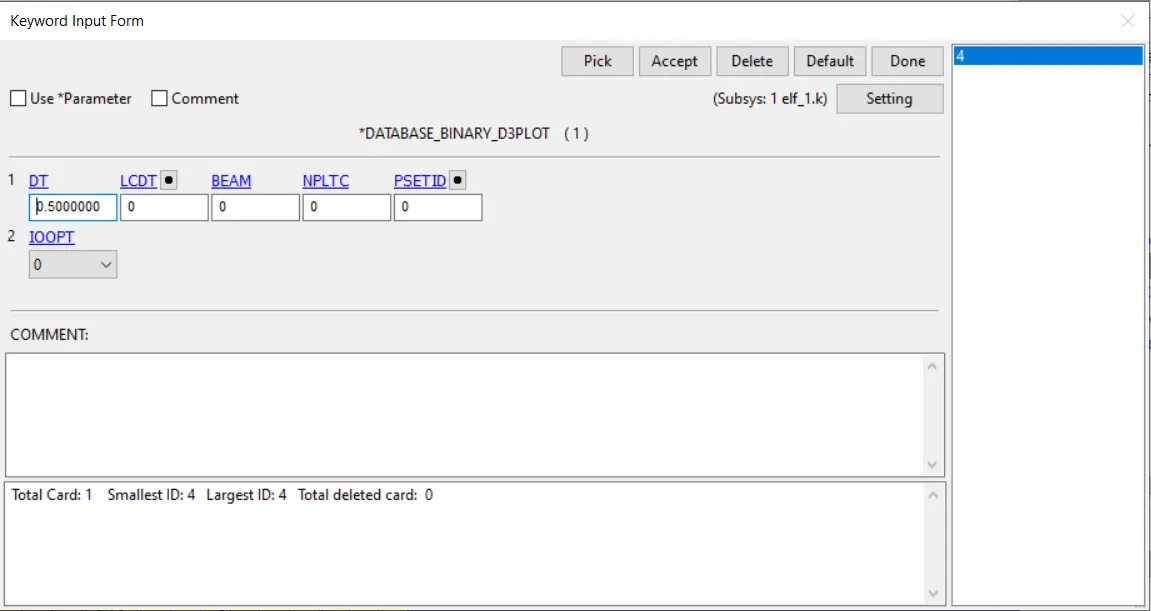
Next we create database_cross_section_set to ge the cross sectional forces acting on a section created at the centre of the solid cube.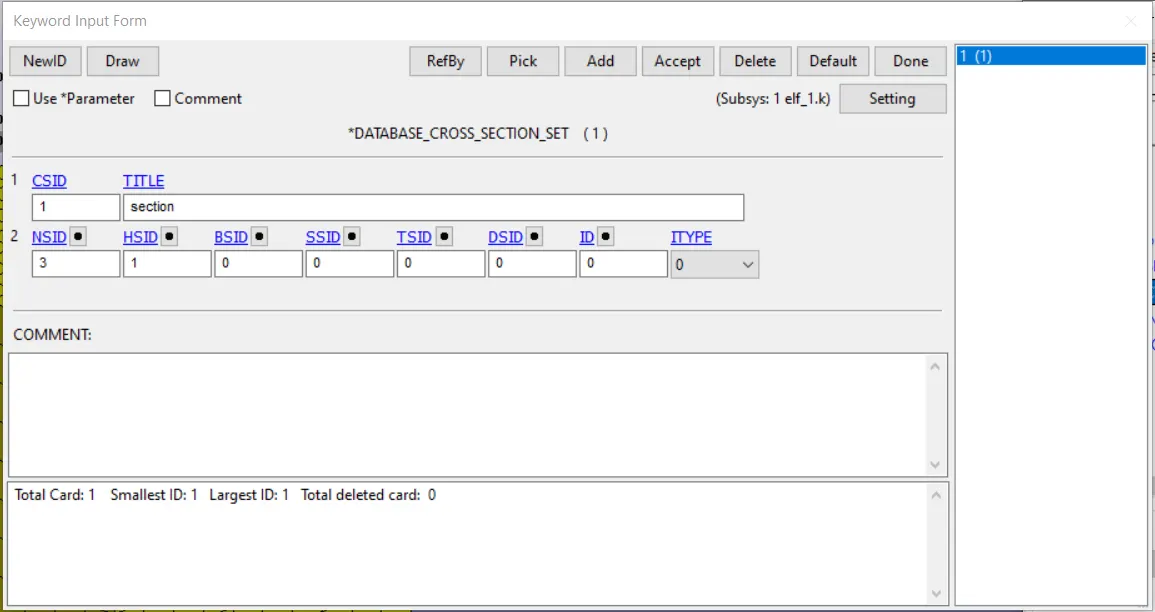
The cross section is created with the following elements.
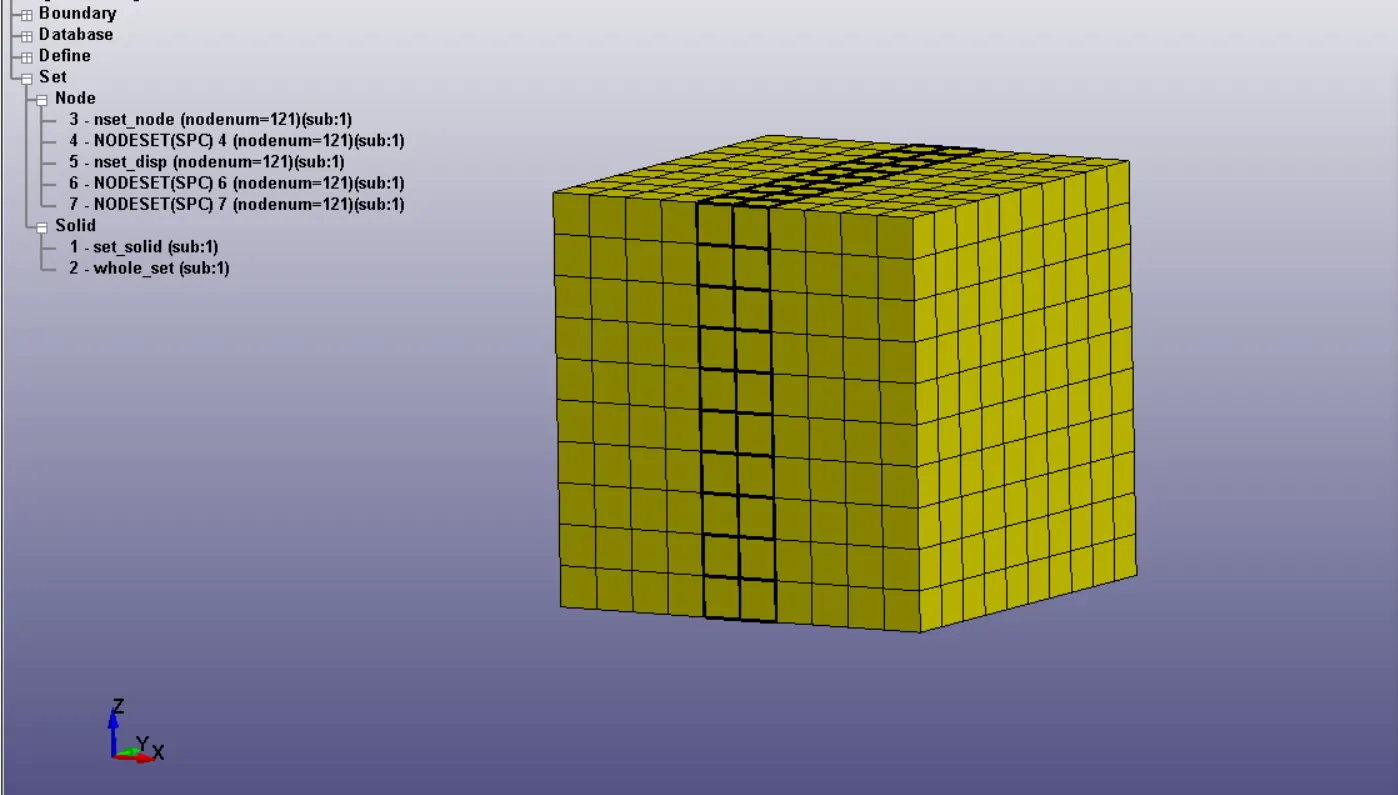
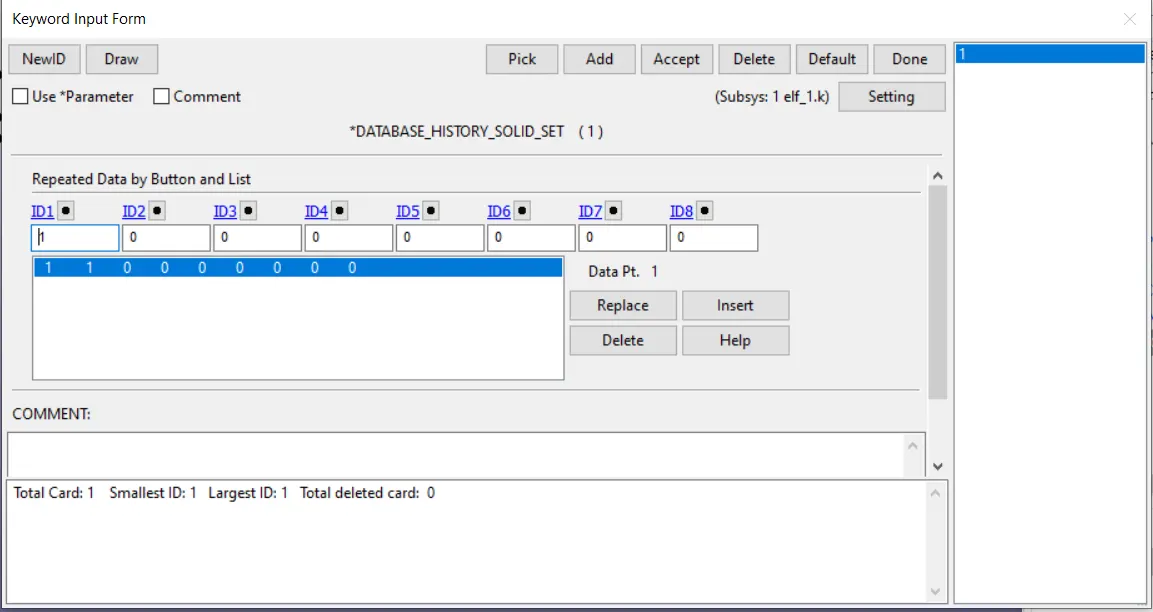
Next we create history node set to see the forces acting on the solid elements as given below.
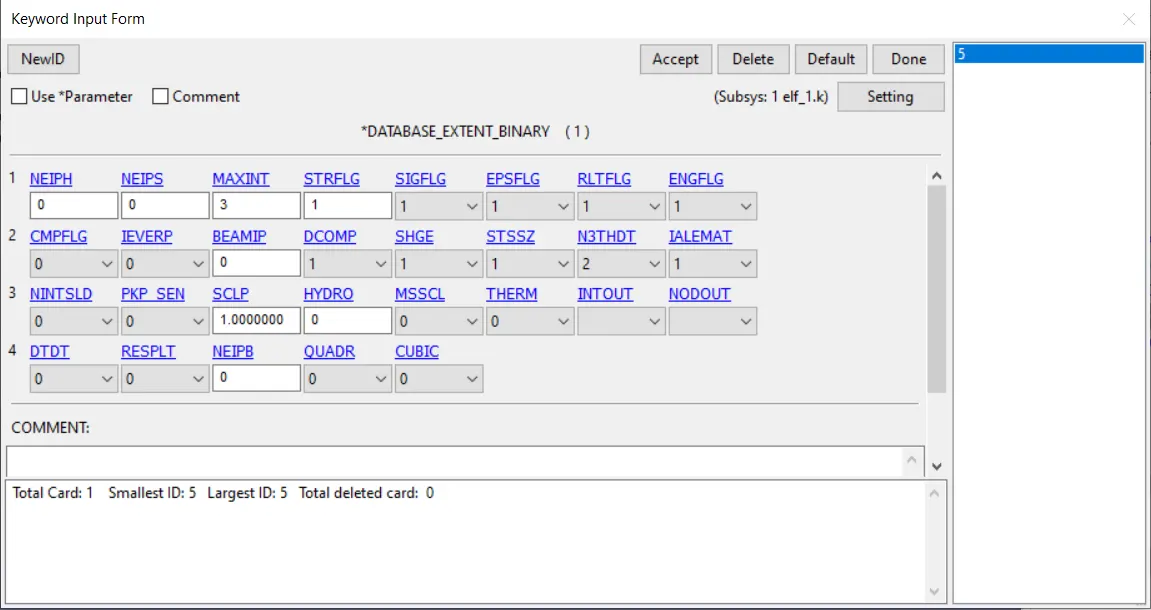
Next we create Database_extent_binary and activate STRFLG card to get the strain rate information in the simulation.
Now all the pre-processing is complete and we are ready to run the simulation.
Running the simulation : Now we will run the simulation.
Post - processing :
The simulation runs in implicit analysis method ensuring that equilibrium is maintained in every loadstep. The solid block stretches with a uniform decrease in cross sectional area along the length of the block.
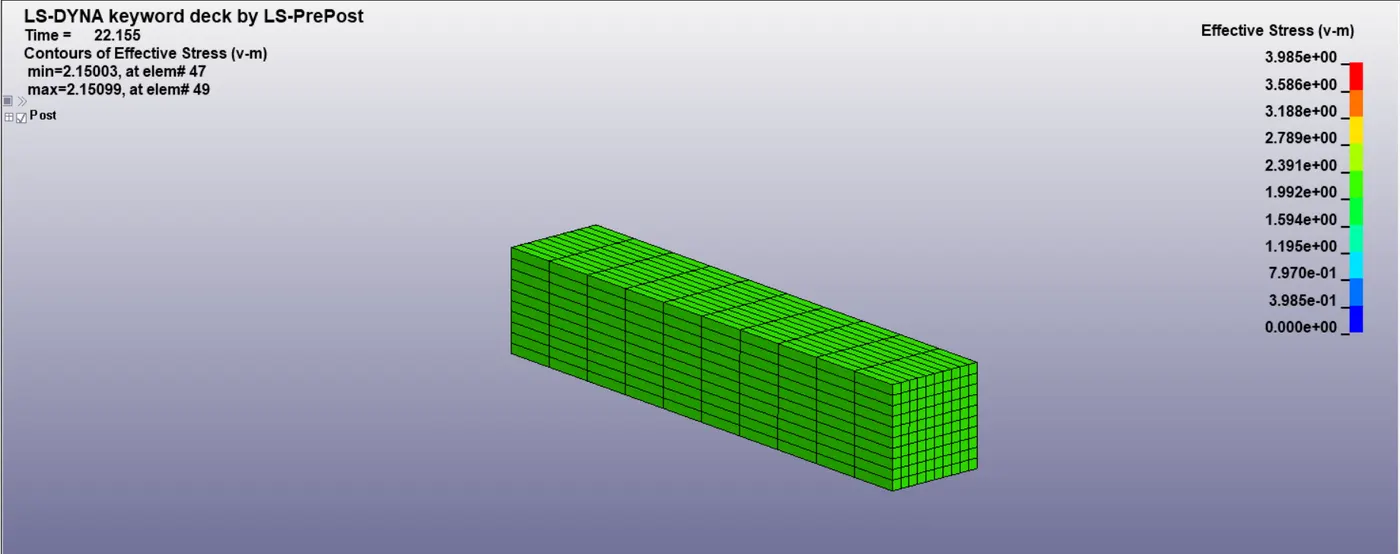
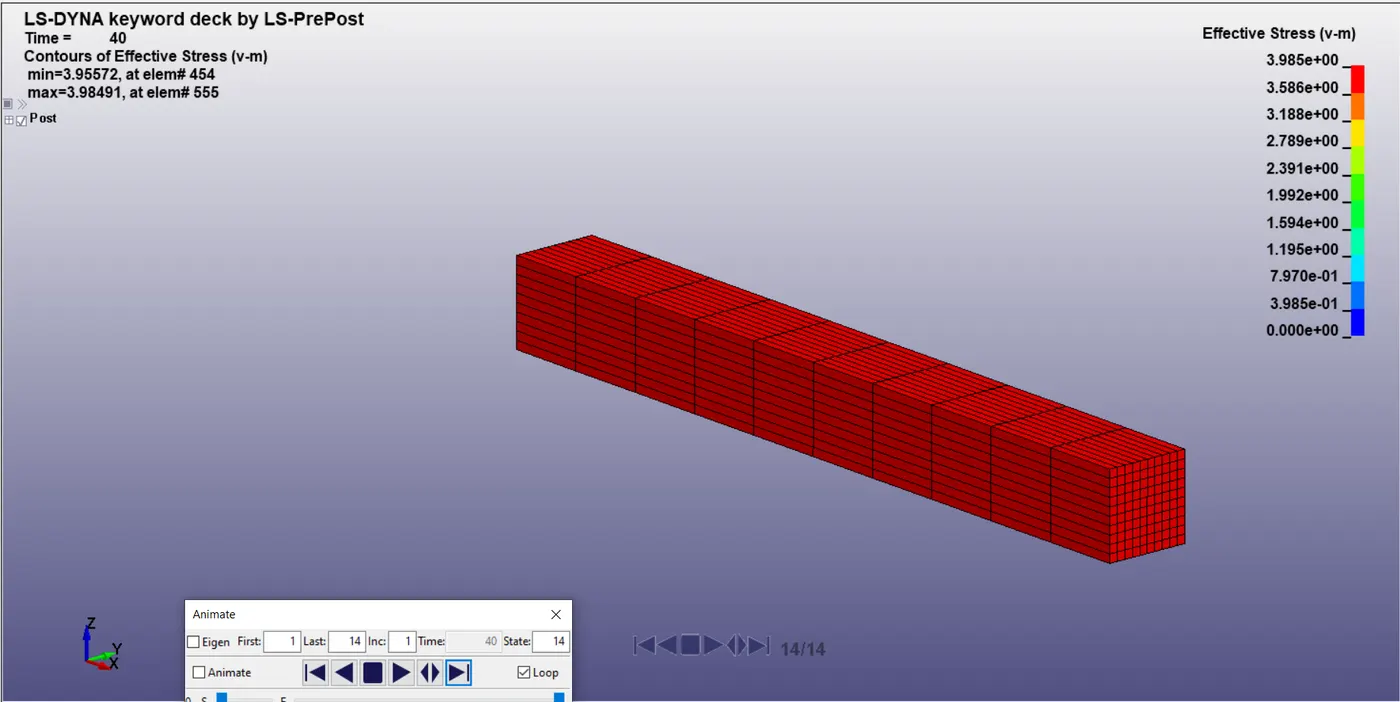
Setting the fringe range to static we see that the stress being experienced is uniform throughout the length of the solid cube with no stress concentration anywhere. A peak stress of 3.985 Mpa is experienced towards the end of the simulation when the stretch ratio reaches around 5.
Sectional Forces : The forces being experienced across the section which we created in the x-direction can be plotted as shown below.
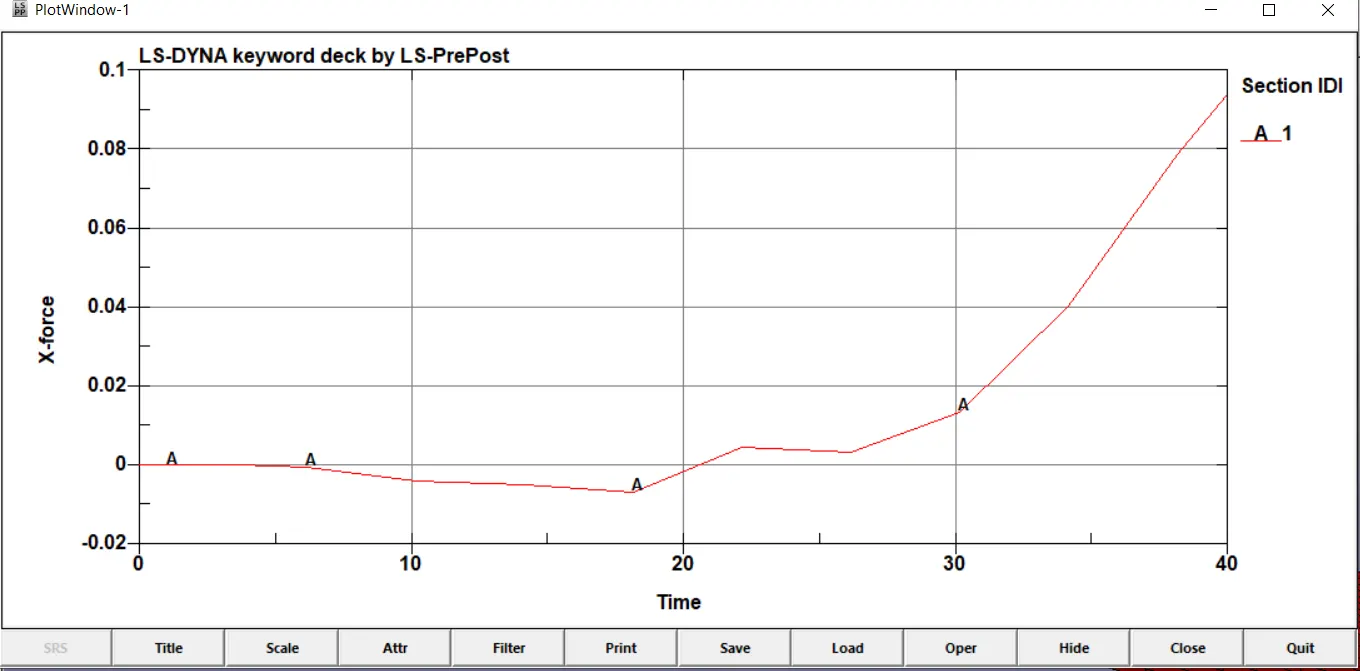
We can see the x-force increase towards the end of the simulation of 40ms.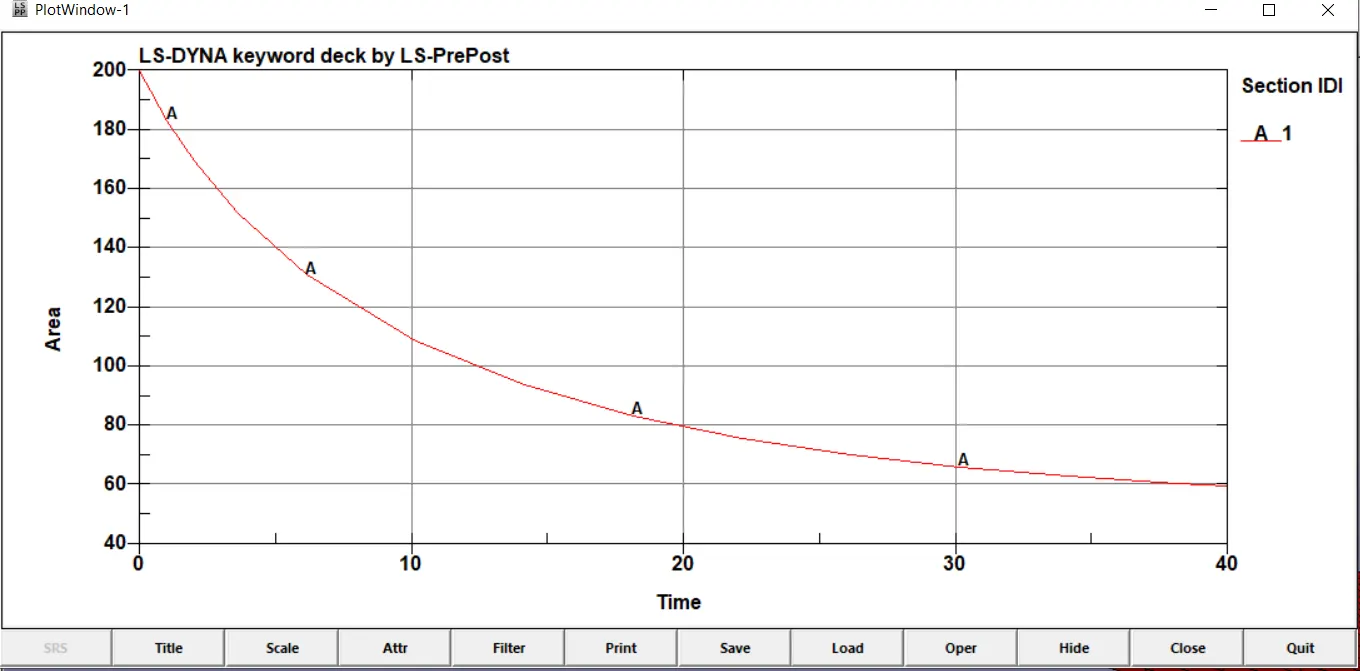
We can see in the above plot the reduction in area of the cross section. Since it consists of 2 cloumns of elements of 100mm.sq. each the toal area starts ar 200mm.sq and towards the end of the simulation it is left at 60mm.sq. indicating 30mm.sq. per column of elements which is the real cross sectional area.
Stress vs stretch ratio for uniaxial test : Next we plot the desired graphs for simulations of different elforms namely elform 1,2 -1 & -2 as shown below. Then we plot the graph for Stress vs stretch ratio for the different elforms. To get this first we must plot the stress vs strain for each simulation.
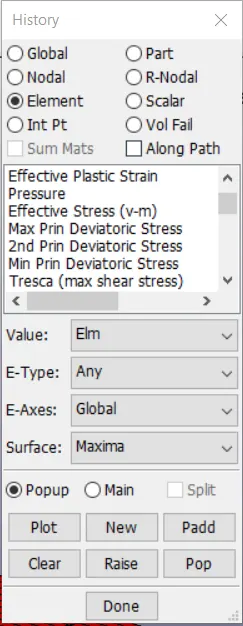
Go to history--> forst plot effective plastic strain, then plot effective stress against time, save both the graphs.
Then go to XY option-->cross plot, select strain on x-axis and stress on y-axis. and save the resulting graph. The graph will look like this. For all the case scenarios the same lement is chosen for uniformity.
Elform = 1
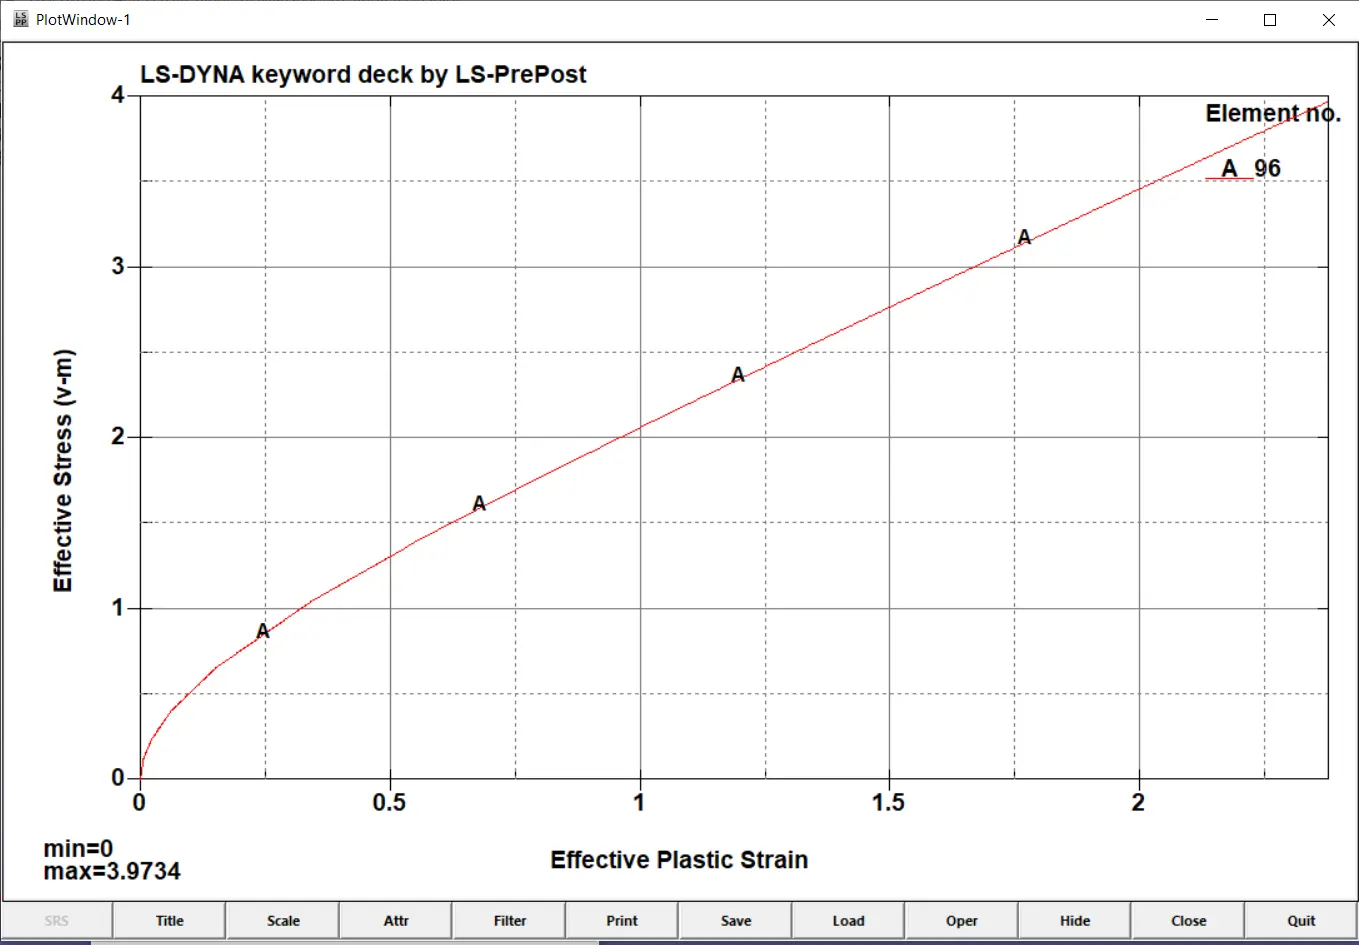
Elform = 2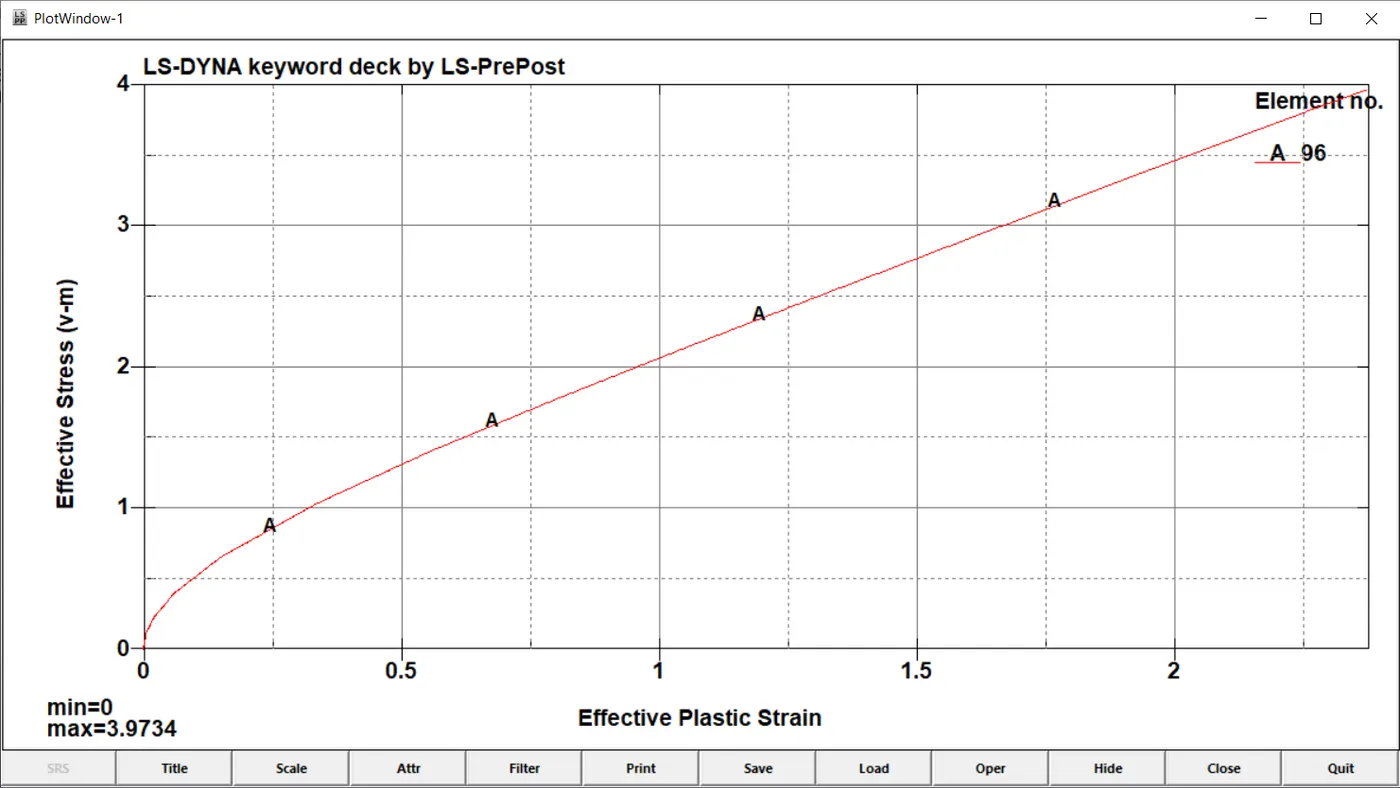
Elform = -1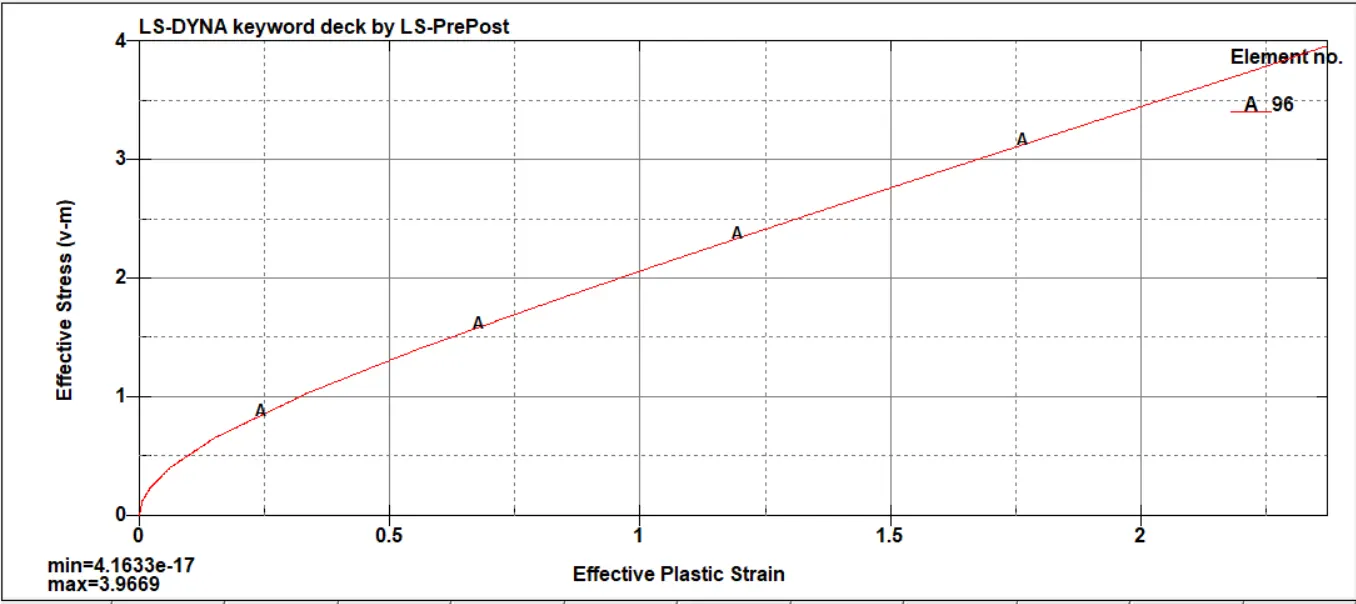
Elform = -2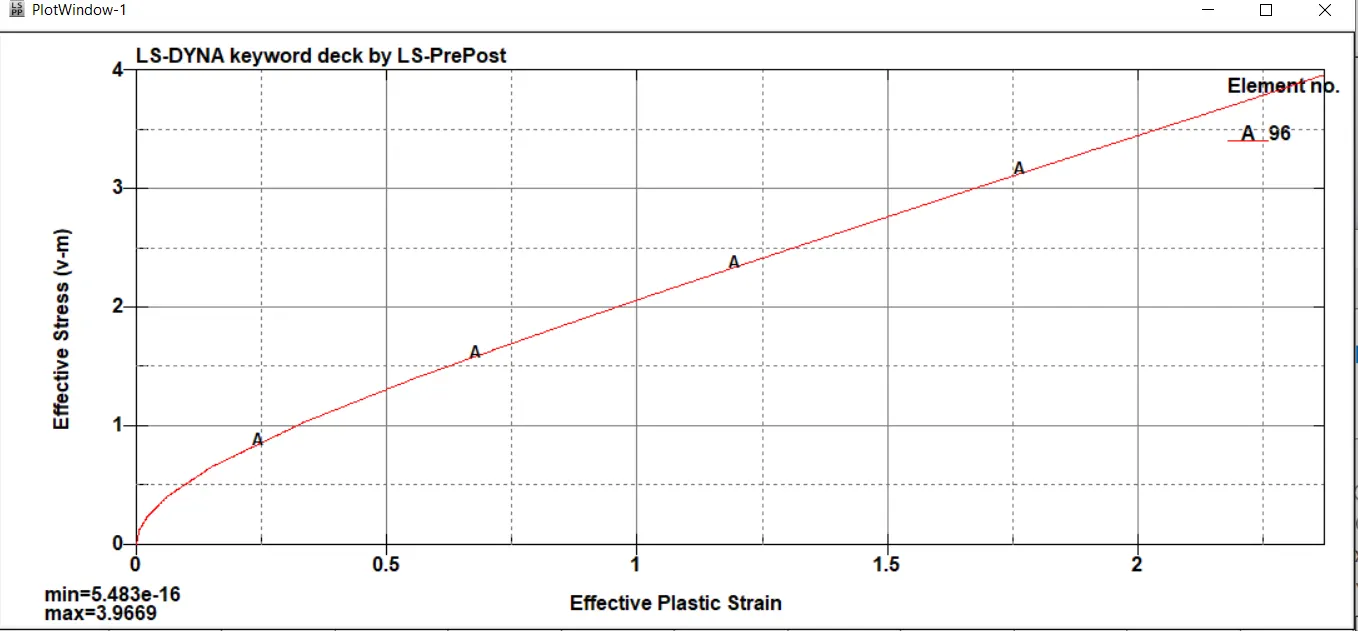
Next we save these graphs in .csv format. Open it in excel and to convert strain to Stretch ratio we perform the following operation
Stretch Ratio = (Strain*2) + 1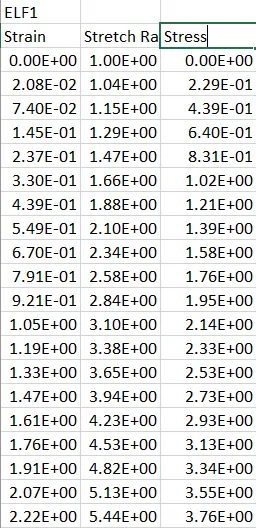
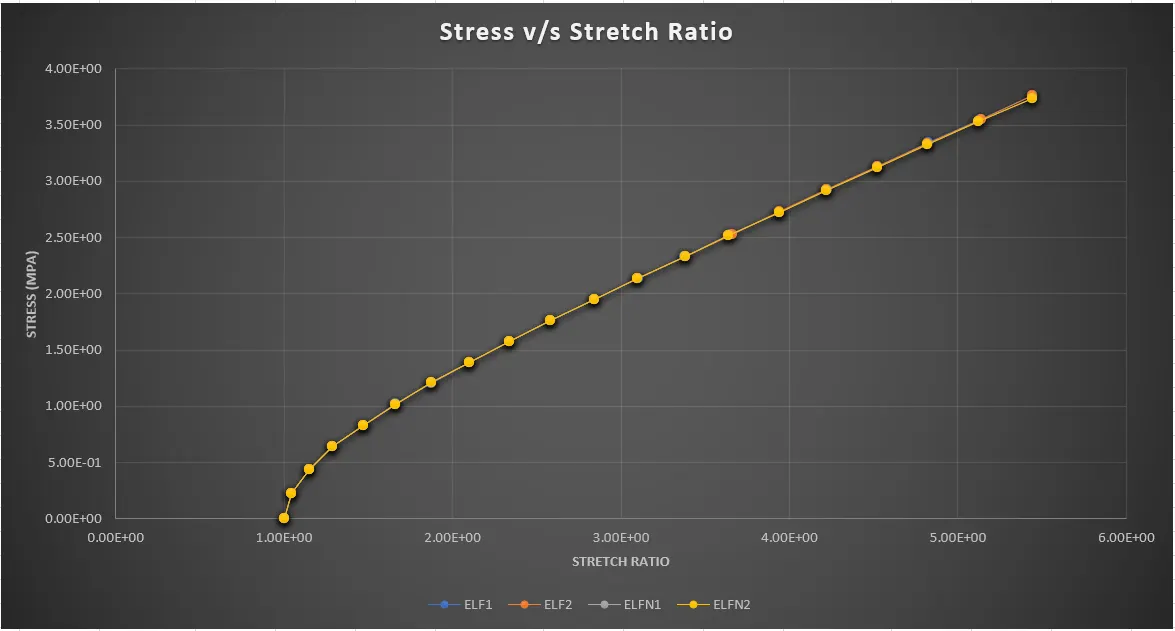
In this way we plot and convert the data for all the elform simulations inro 1 excel sheet and we plot the graph for it. There is not much difference in the plots of the different elforms since the simulation is fairly linear and not complicated. The graph plotted looks like this.
Conclusion :
The tensile data for various elforms has been studied using hyperelastic material card and the required output has been obtained.
Result : The excel sheet has been uploaded with data for various elforms (graph is not accurate due to limitations with google sheets), hence a picture of proper graph has been uploaded above. on y-axis stress is given in Mpa and on y-axis stretch ratio is given (upto 5.5)