Week-6 Calculate the Stretch Ratio by comparing the ELFORM (-2,-1,1,2) with Ogden_Material Model.
#7 // Week-6 Calculate the Stretch Ratio by comparing the ELFORM (-2,-1,1,2) with Ogden_Material Model.
AIM: To perform the simulation using ELFORM = 1, 2, -1, -2 and calculate the stretch ratio.
KEYWORDS: ELFORM, Stretch ratio, Strain, Stress, etc.,
SOFTWARE: LS-Dyna
OBJECTIVE:
1) To Create a block of 10mmx10mmx10mm dimension with 10 elements for each direction and use the material card attached (Ogden_Material.k).
2) Use appropriate boundary conditions to simulate uniaxial tensile behavior for the model.
3) To choose a type of solver (explicit/implicit) and justify the chosen solver.
4) To create an Excel sheet with proper conversion and calculation of stress/strain and stretch ratio for all the ELFORM.
Problem statement:
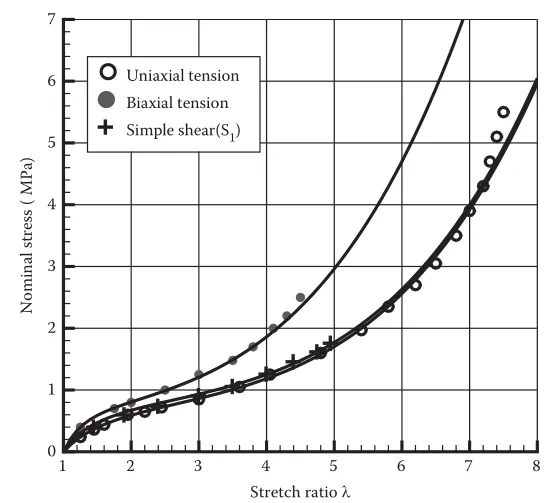
Create a block of 10mmx10mmx10mm dimension with 10 elements for each direction and use the material card attached (Ogden_Material.k) that is representative of the material properties from the above figure.
Use appropriate boundary conditions to simulate tensile behavior for the model and finally compare the results from your simulation to the plot above up to stretch ratio 5. Only the uniaxial plot is to be compared.
Compare the results for the simulation using ELFORM = 1, 2, -1, -2
The unit of µ in the material definition is in MPa and α is a dimensionless quantity. Modify those quantities according to your unit systems.
Use a proper solver (Implicit/Explicit) and also explain the reason.
INTRODUCTION:
An Ogden model is a hyperelastic material model that can be used for predicting the nonlinear stress-strain behavior of materials such as rubber or polymer. Ogden's model has introduced Ogden in 1972. The Ogden model has been frequently used for the analysis of rubber components like O-rings and seals. Even though the Ogden model is a hyperelastic material model, its strain energy density function is expressed by the principal stretch ratio.
PROCEDURE:
1/ Open LS-Dyna Project Manager > Start LS Prepost > Import the given material file "Ogden_Material.k".
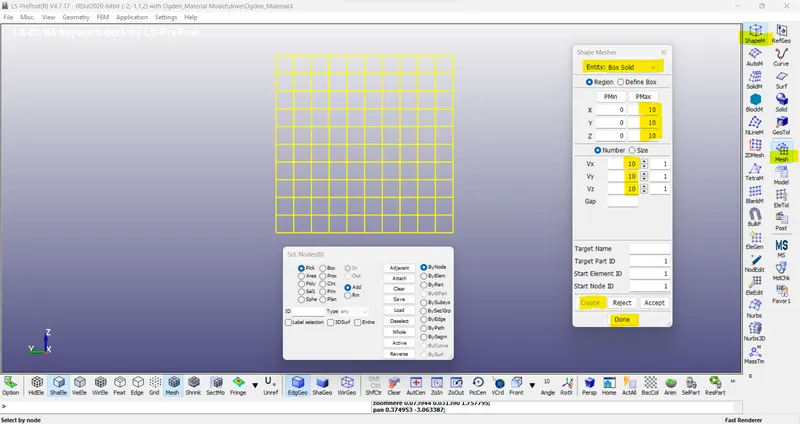
2/ Go to Element and Mesh option > Shape Mesher > Enter the values shown below in the popup. This would create a solid box of dimensions 10mm*10mm*10mm with 10 elements in each direction.
Section Creation:
3/ The section properties of the FE model created are assigned as a solid element with different ELFORM such as,
Case (1). ELFORM = 1, constant stress solid element. [Under integrated constant stress; needs hourglass stabilisation; efficient and accurate.]
Case (2). ELFORM = -1, Fully integrated S/R solid intended for elements with poor aspect ratio, efficient formulation. [Similar to ELFORM 2, but shear locking is accounted for; efficient formulation (CPU time).]
Case (3). ELFORM = 2, Fully integrated S/R solid, [Reduced integrated; no hour glass stabilisation needed; slower than ELFORM 1; shear locking can occur.]
Case (4). ELFORM = -2, Fully integrated S/R solid intended for elements with poor aspect ratio, accurate formulation. [Similar to -1, more accurate, more computational cost.]
Go to Keyword Manager > Section > Solid > Enter the values as shown in the figure below.
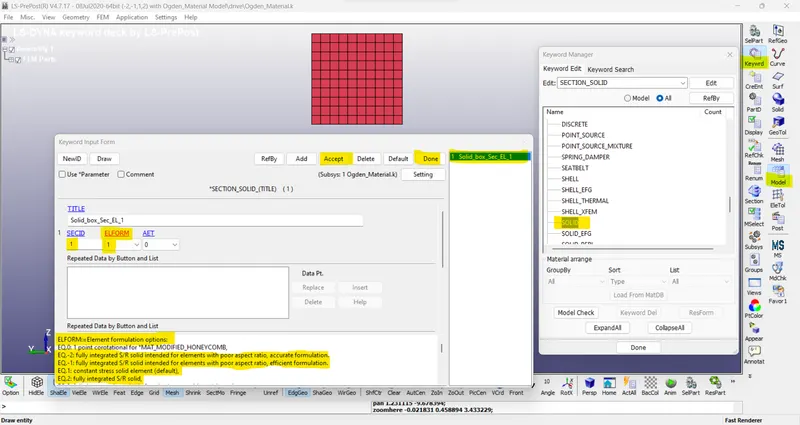
Note: For the different cases of simulation select different values of ELFORM from the drop-down and save it as a different extension file and run the analysis. The definitions of various ELFORM are performed.
Material:
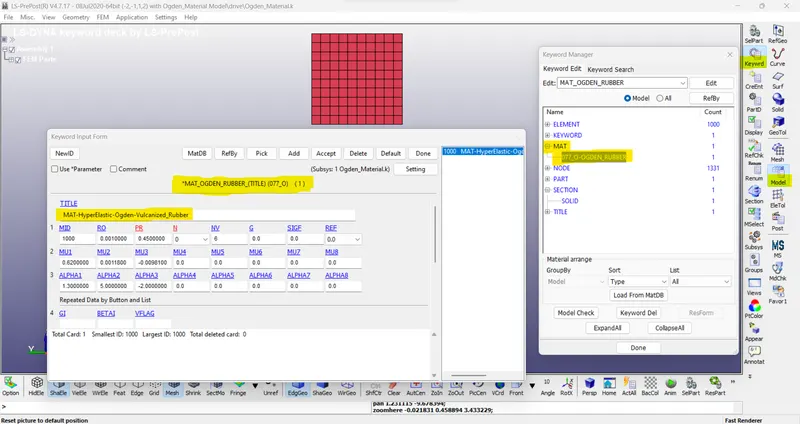
4/ The material card given in the below image is already provided in the keyword file, the unit system followed is gm-mm-ms and it is assigned to the solid block part.
Assigning Material and Section to PART:
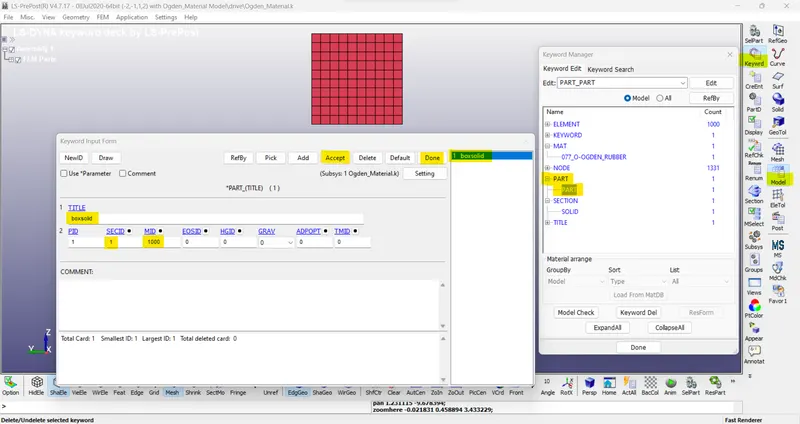
5/ The material and section properties are assigned to the solid part as shown in the image given below.
Boundary Conditions:
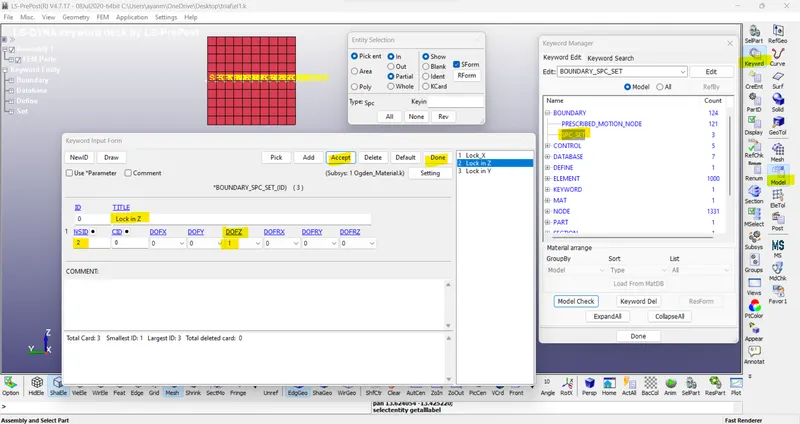
SPC_Set ->
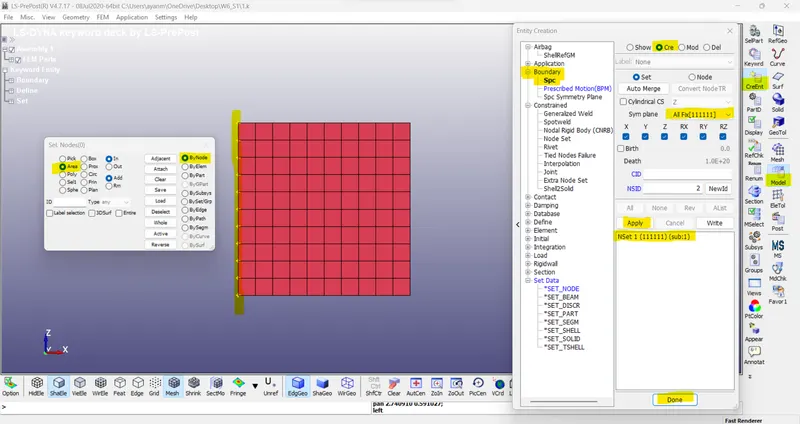
6/ To perform the uniaxial tensile test on the specimen, the nodes of one of the faces are fixed along the X-axis.
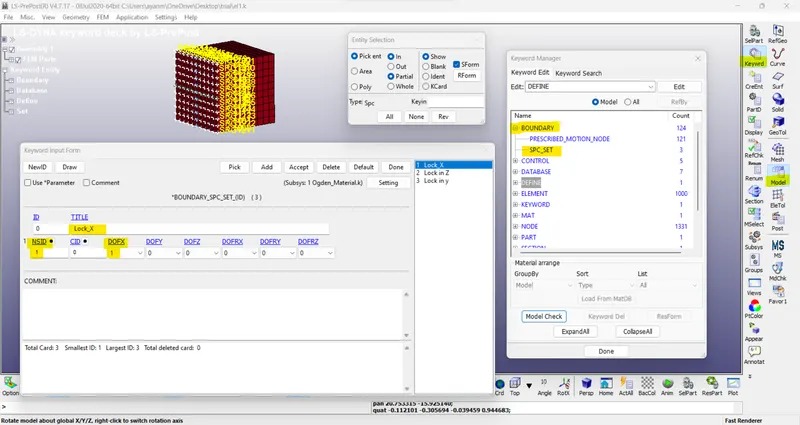
7/ Then we fix the vertical middle nodes along the ‘Z direction’ fixed in the Y-direction.
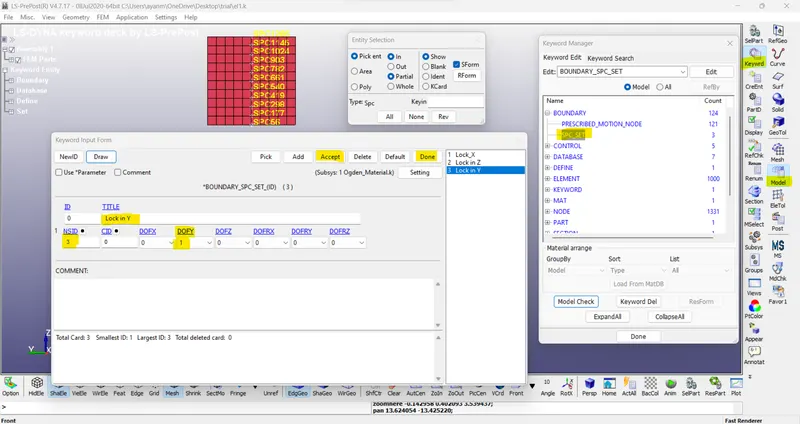
8/ Then we fix the horizontal Middle nodes along the Y-direction fixed in the Z-direction.
Psecribed_Motion ->
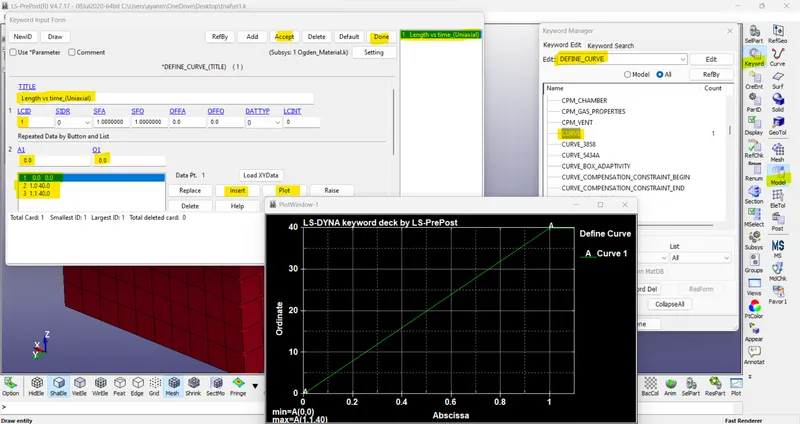
9/ The minimum load to be applied on the moving surface to attain a stretch ratio of 5, is calculated by using the following relation,
True strain = ln (1+Engg.strain)
Stretch Ratio = 1+Engg.strain
5 = 1+ ( delta L / L )
delta L = 40 mm
Hence, the minimum value of 40mm is taken to define the load curve.
/ Define Curve: go to Keyword Manager > All > Define > Curve.
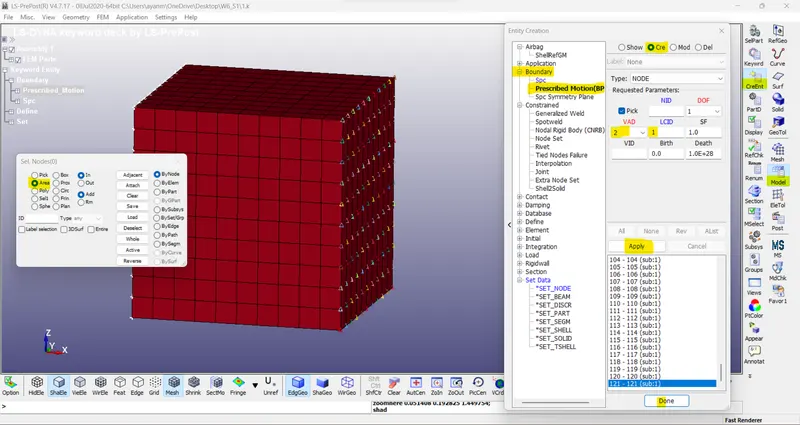
10/ The node-set and load curve IDs are assigned to the prescribed motion set so the selected nodes move along the X direction.
Control Cards:
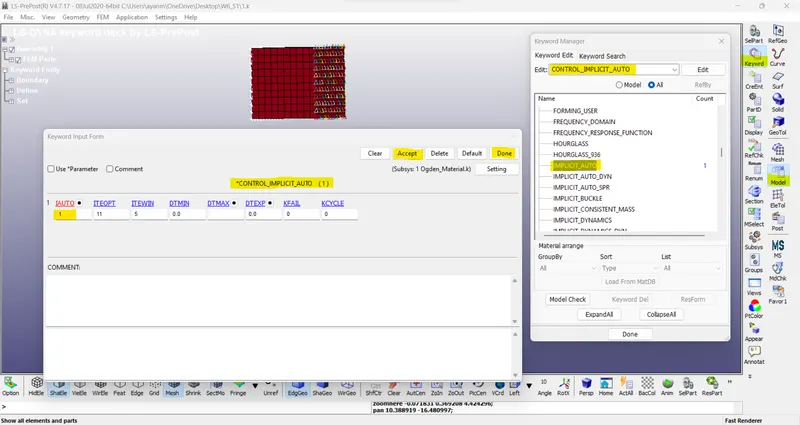
11/ CONTROL_IMPLICIT_AUTO card as shown in the below image is used for automatic time step control during implicit analysis. The input value for the Automatic time step control flag = IAUTO = 1.
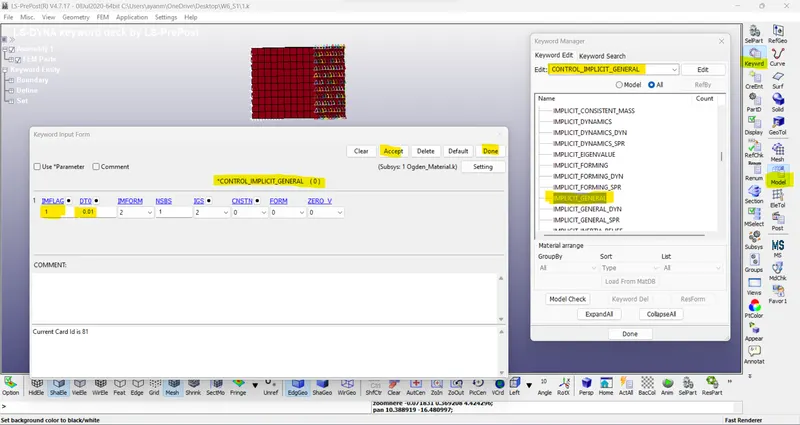
12/ CONTROL_IMPLICIT_GENERAL card as shown in the below image is used to activate implicit analysis and define associated control parameters. This keyword is required for all implicit analyses.
The input value for IMFLAG=Implicit/Explicit switching flag = 1 (implicit analysis)
DT0=Initial time step size for implicit analysis = 0.01.
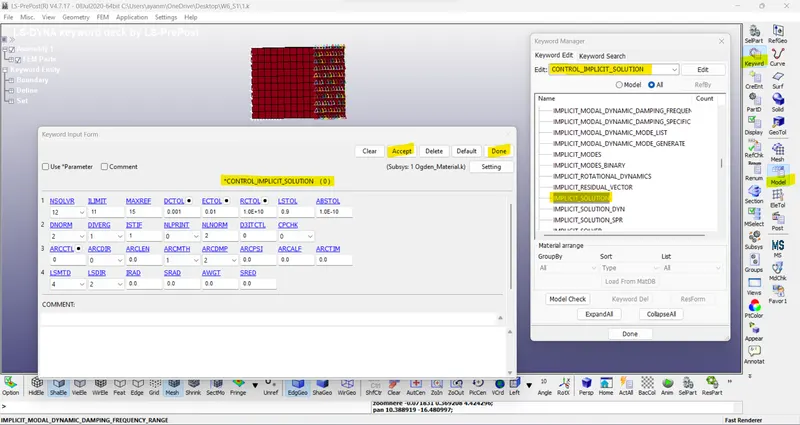
13/ CONTROL_IMPLICIT_SOLUTION card as shown in the below image is used to specify whether a linear or nonlinear solution is desired. The default values are set as it is in the card.
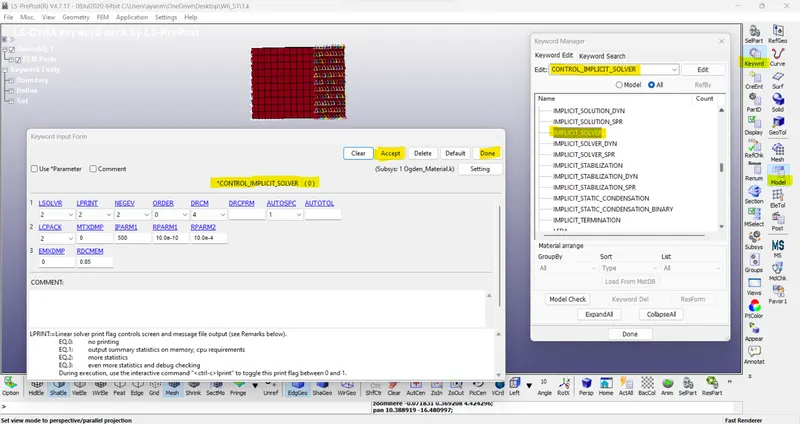
14/ CONTROL_IMPLICIT_SOLVER card as shown in the below image is used for implicit calculation.
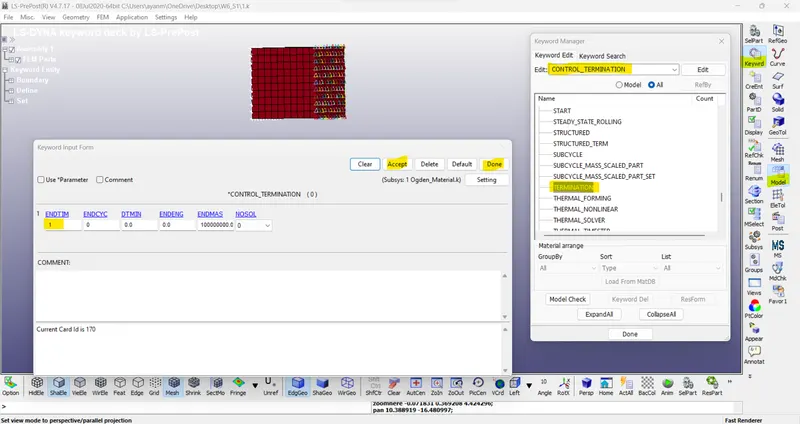
15/ The control termination function as shown in the below image is enabled to specify the end time of the simulation. The termination time is set for 1 ms.
Database:
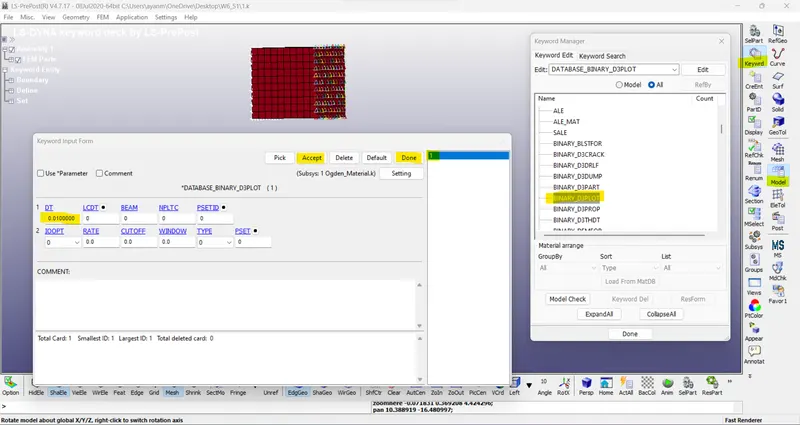
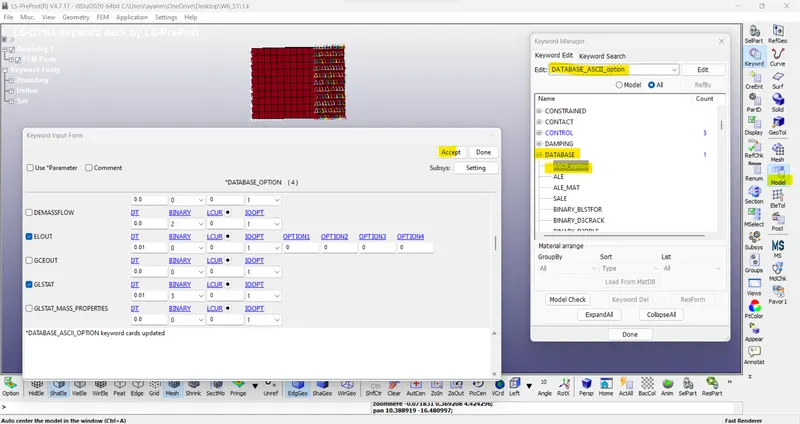
16/ The time step value of 0.01 ms is given for the BINARY_D3PLOT as shown in the below image and the DATABASE_ASCII option for GLSAT and ELOUT.
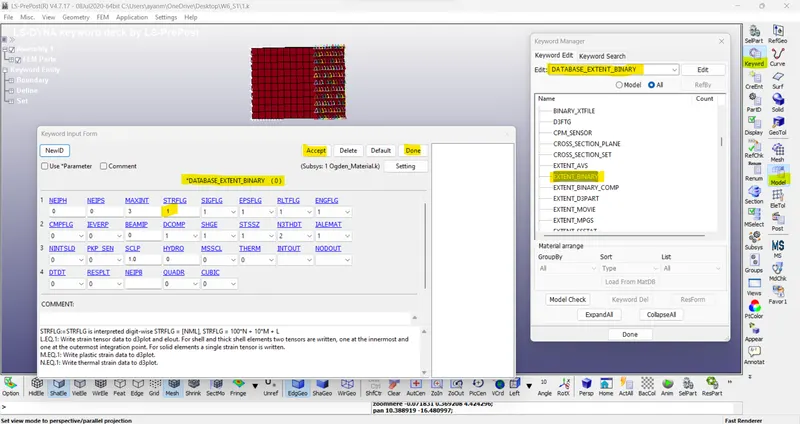
17/ The DATABASE_EXTENT_BINARY card with STRFLG =1, as shown in the below image is used to compute the elastic strain in the model.
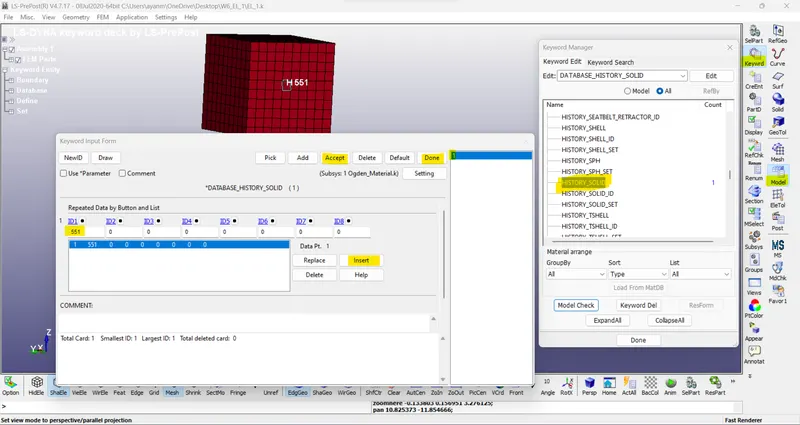
18/ The DATABASE_HISTORY_SOLID card as shown in the below image is used to compute the stress/strain of a 551 node in the model.
/ The keyword file is saved using the ‘.k’ extension and is made to run in the solver by getting normal termination messages for different cases of ELFORM.
Results:
CONTOUR PLOTS:
Case 1: ELFORM '1' element formulation
The X-Stress and X-Strain contours are shown in the figures below.
Case 2: ELFORM '2' element formulation
The X-Stress and X-Strain contours are shown in the figures below.
Case 3: ELFORM '-1' element formulation
The X-Stress and X-Strain contours are shown in the figures below.
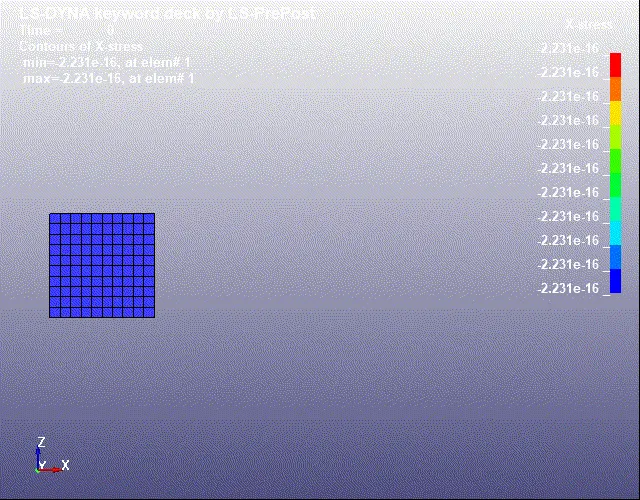
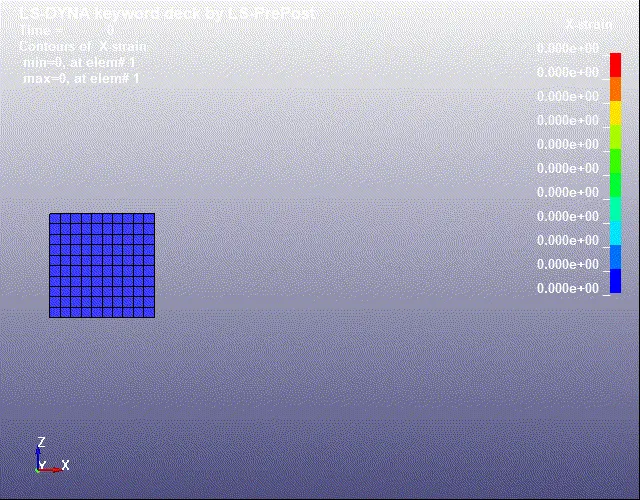
Case 4: ELFORM '-2' element formulation
The X-Stress and X-Strain contours are shown in the figures below.
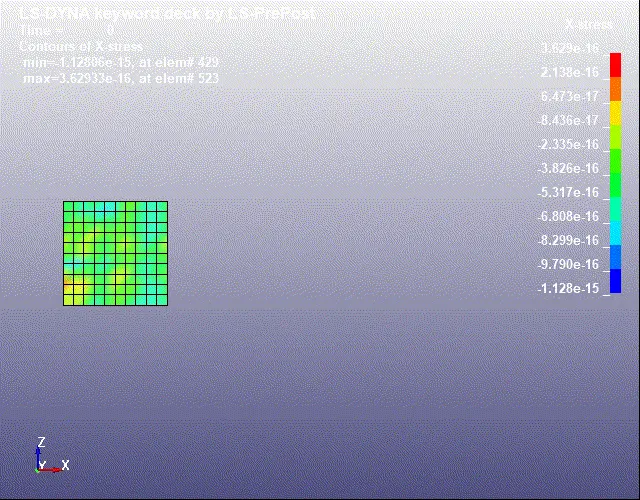
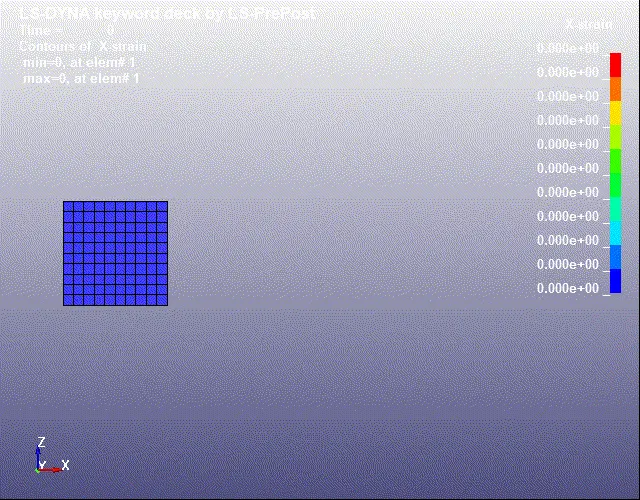
From the results, it is observed the maximum value of X-Stress and X-Strain are the same for all the element formulations and the values are 4 MPa and 1.6 respectively.
True stress and strain curves have been plotted and saved in.csv format and then the graph has to be plotted for engineering stress and stretch. for this it is required to convert true stress and true strain to engineering stress and engineering strain and engineering strain are converted to stretch ratio using these formulae.
ɛt = ln(1+ɛe) = ln λ
to find the engineering strain natural log when taken to the other side the engineering strain is the (exponential of true strain - 1).
Engg. Strain, ɛe = Exp(ɛt) - 1 .............(1)
to find the stretch ratio, 1 is added to the engineering strain
Stretch ratio, λ = 1+ɛe ................(2)
finally, engineering stress is obtained by dividing the true stress with stretch
σt = σe * (1 + ɛe)
σt = σe * λ.
or, Engg. Stress, σe = σt / (1 + ɛe); ...............(3)
//Note- `epsilon underset t`= True Strain. | `epsilon underset e`= Engineering Strain. | `lamda`= Stretch ratio
`sigma underset t`= True Stress | `sigma underset e`= Engineering Stress. //
// Note- Now To plot True Stress / Strain & form calculation and conversion in Engineering Stress / Strain, Stretch ratio,
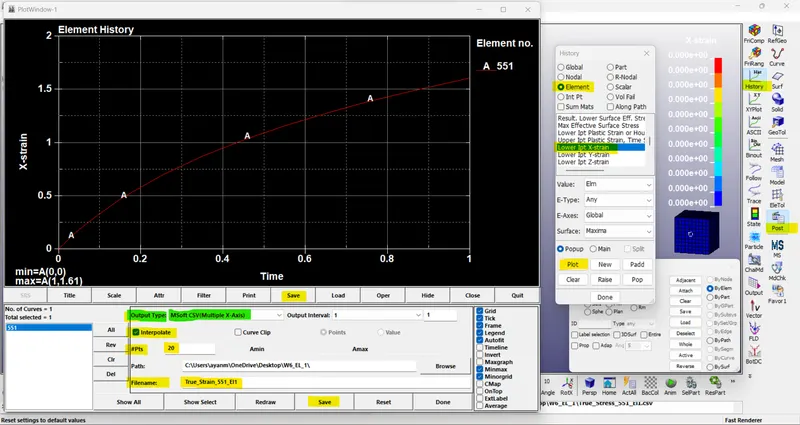
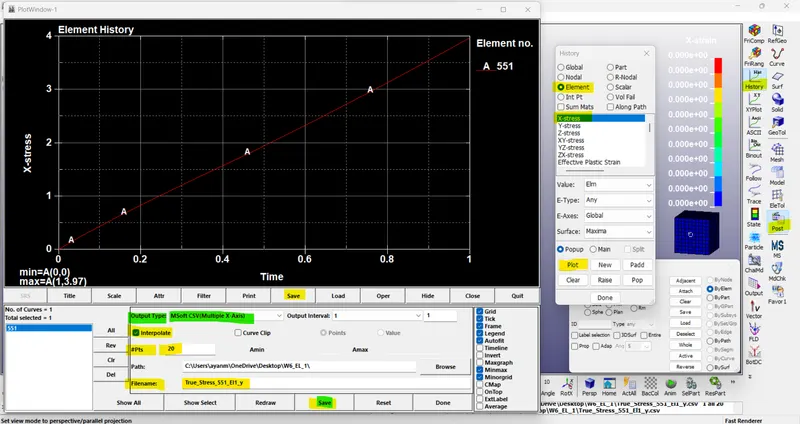
/1/ Go to d3plot > Post > History > Element > Lower Ipt X-strain (for True Strain) / X-stress (for True Stress) > Plot > Save > check Interpolate + #pts -> 20 > Filename > Save.
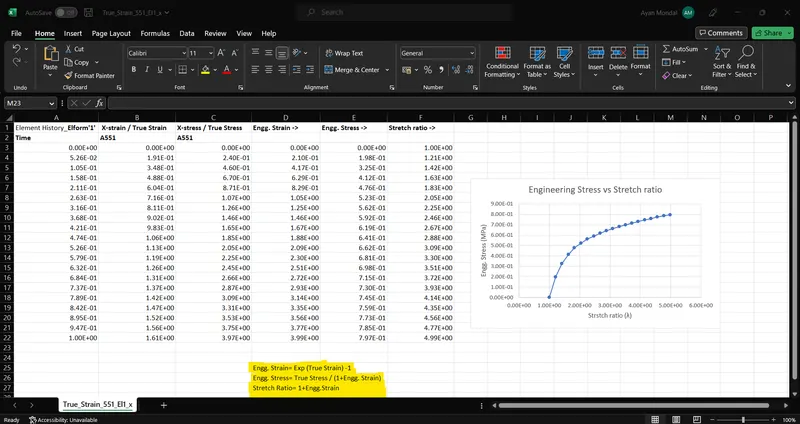
/2/ Go to the destination folder & open True Stress/Strain vs time in Excel polt and then put 1,2,3 formula to converse in Engg Strain/Stress, Stretch ratio in Excel,
/3/ Finally, with Engg. Stress (Y-axis) & Stretch ratio (X-axis) we plot the graph in Excel > Insert > Chart.
//
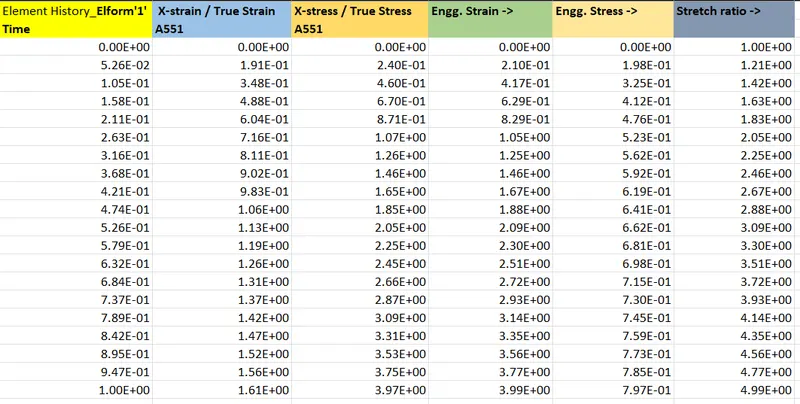
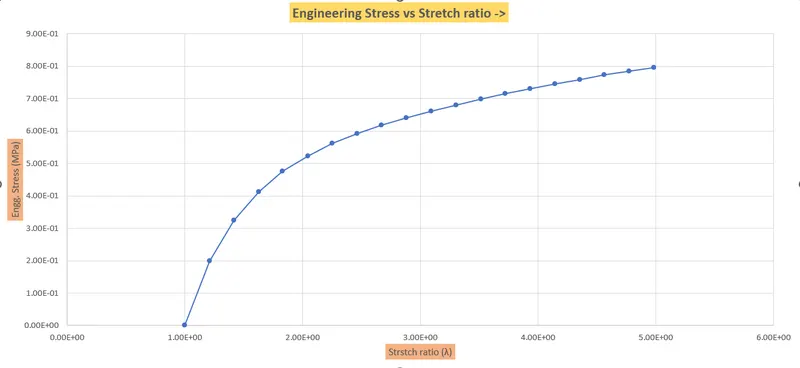
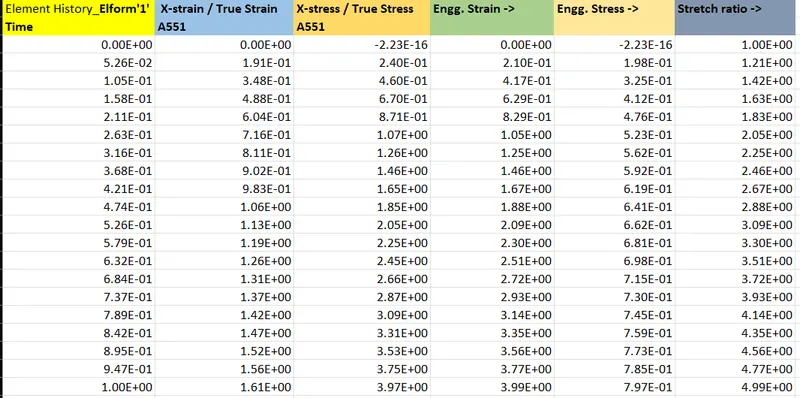
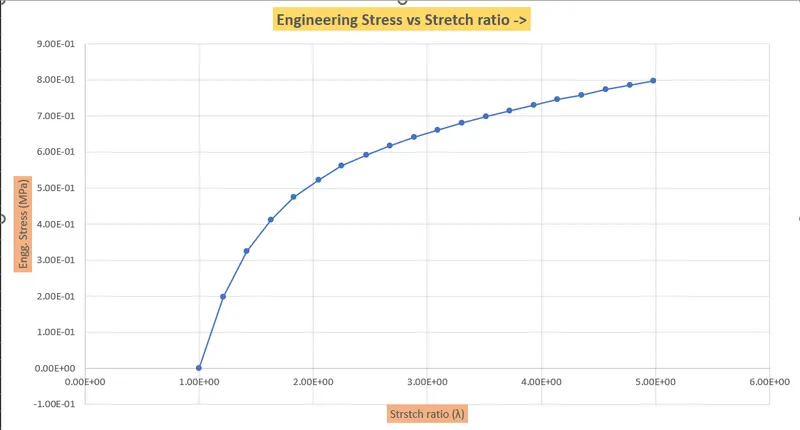
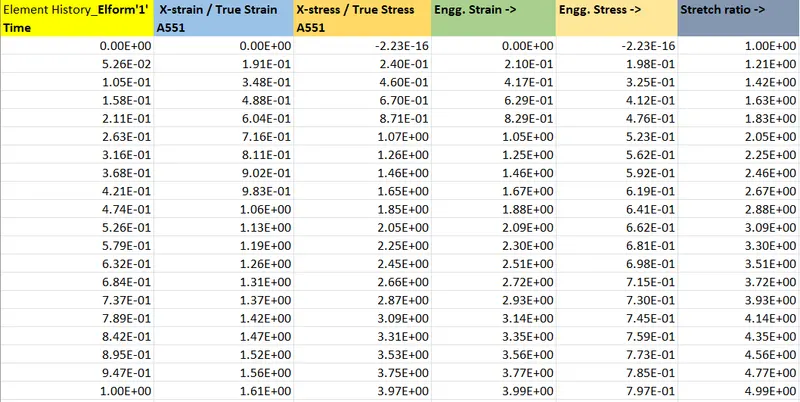
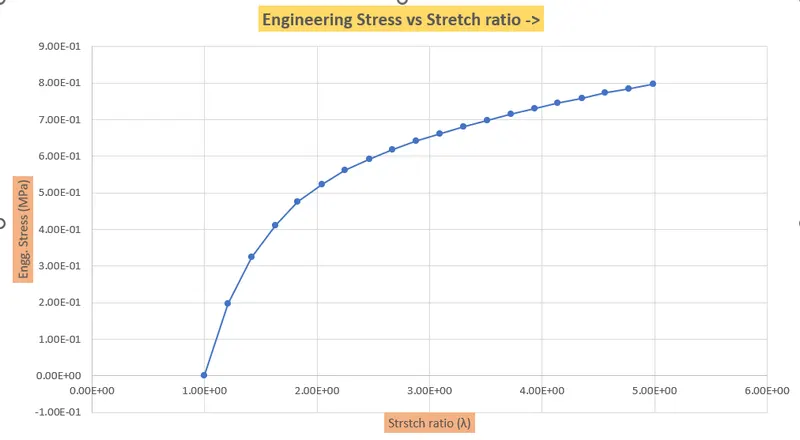
The values of the stretch ratio obtained for all four cases are shown below.
Case 1: ELFORM ‘1’ element formulation
Case 2: ELFORM ‘2’ element formulation
Case 3: ELFORM ‘-1’ element formulation
Case 4: ELFORM ‘-2’ element formulation
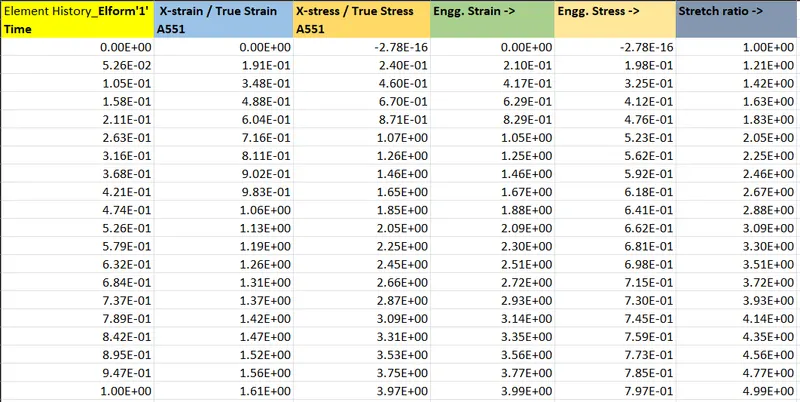
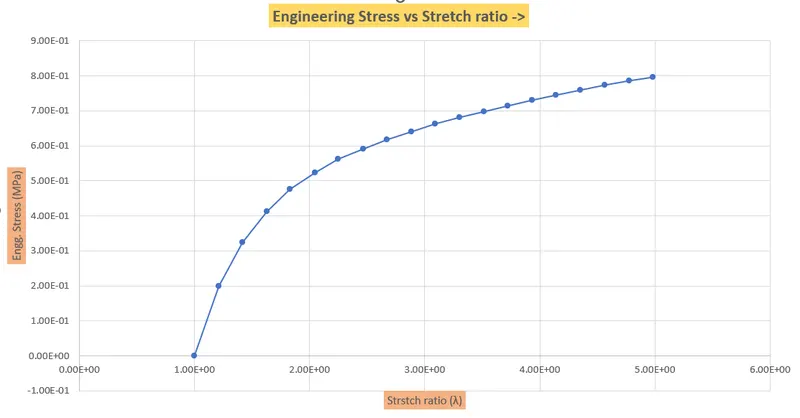
From the stretch ratio plots, it can be inferred that there is a huge deviation from the actual plot given in the problem statement. The plots for various element formulations are almost the same. It is due to the simplicity of the model. If there is a complex geometry involved, then significant change can be observed in the results. Here, the actual test-up might not be given as the boundary conditions for the problem. For example, temperature plays a significant role during the test. Also, the rate of application of load highly varies in actual when compared to simulated results thereby causing deviation in the obtained results.
Comparison:
- Since this is the uniaxial tensile test, we are getting similar results for different element formulations.
- Also, the deformation we have given to the cube was not so large for this type of hyperelastic material, so the difference cannot be observed.
- For different boundary conditions and different loading conditions, we can get different results with changes in element formulation type in a more efficient manner and clearly visible.
- Since the element formulation (1) is constant stress solid element, which defaults, a constant point element is invoked, which is good to propose the strain energy function.
- Element formulation (2) is a selectively reduced integrated solid element, which gives constant pressure throughout the element to avoid pressure locking, but type (1) is more accurate the type (2) for implicit problems.
- Element formulation types (-1) and (-2) are fully integrated elements intended for elements with poor aspect ratios. Among which type (-1) is more efficient and type (-2) is a more accurate formulation.
- Since Element formulation (-1) has some side effects related to some particular deformation modes, we can conclude that Element formulation (-2) is more accurate and mostly preferred for the solid elements in Implicit problems.
CONCLUSION:
The case setup was done as per the objective and the corresponding output requests are obtained. An implicit solver is used for the simulation because the effect of strain rates is minimal.
The value of the stretch ratio is calculated for various element formulations.