Week - 5 - Modelling Spotwelds
Aim:, To model spotwelds with both beam and solid elements and compare the results for the given assembly of parts and run a crash test
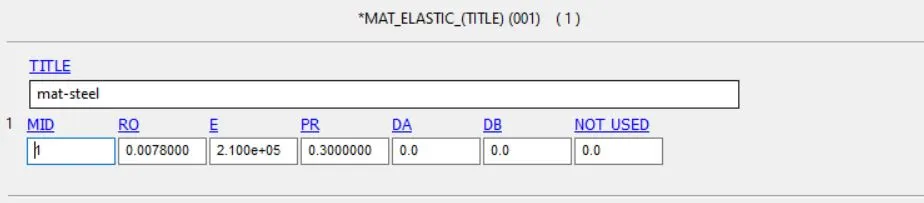
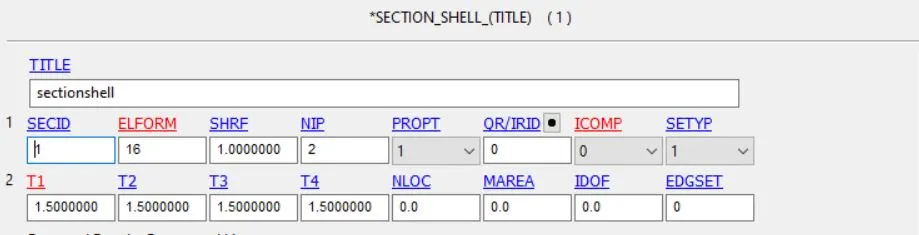
Procedure:Mesh was provided. First step was to provide material of the craashbox and also define section for the shell
The given model was imported and in between the 2 sections connection was made by creating spotwelds. In our case two models were prepared and run through the same simulation, the only difference being while modeling of spotweld , one was modeled by using beam elements and another was created using shell elements.
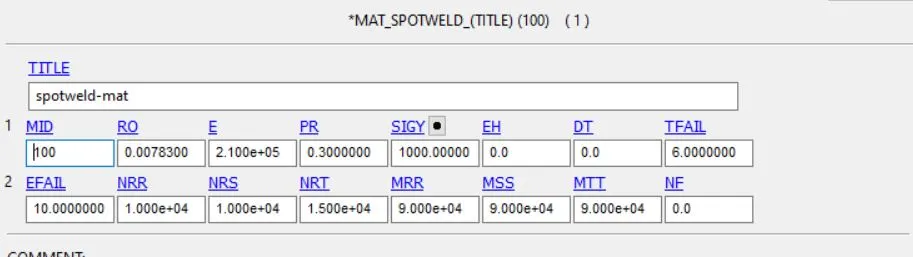
Spotweld material was used to define the material property of the spotwelds as shown below. Now as we plan to check the failure criterion of both the spotweld, in both the cases the TFAIL was given as 6.
As mentioned we had two cases while creating our spotwelds, one with beam elements and another was created using shell elements. The elements was created using ELEMENT generation- Beam- create beam elements and the we selected the nodes that was to be joined between both the shells, similarly for the solid spotweld case, similar procedure was used. The cards are summarized below.
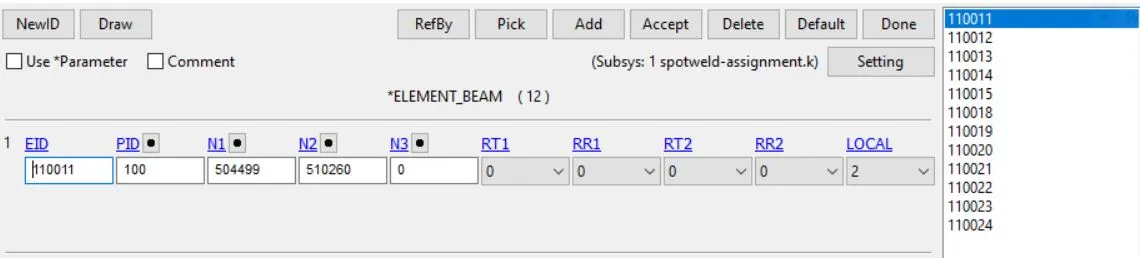
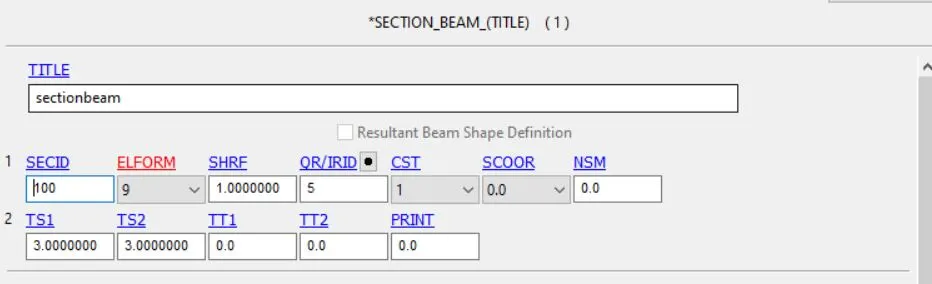
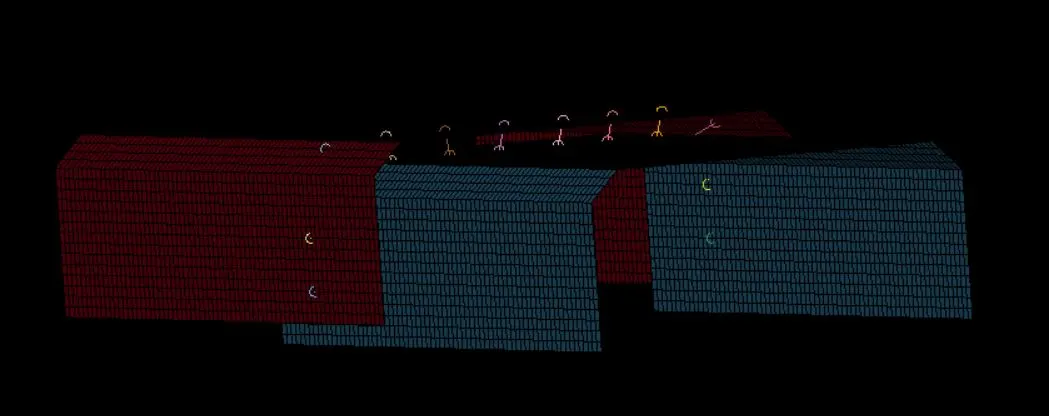 Fig: The spotwelds with beam elements
CASE 2: for solid elements
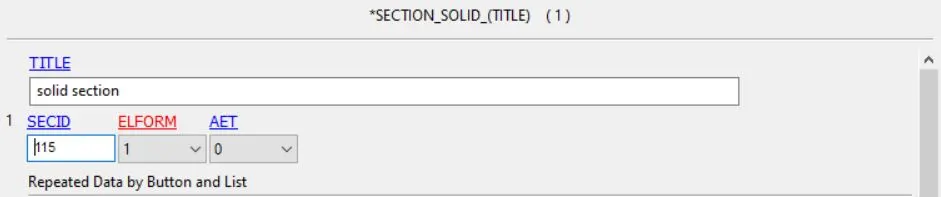
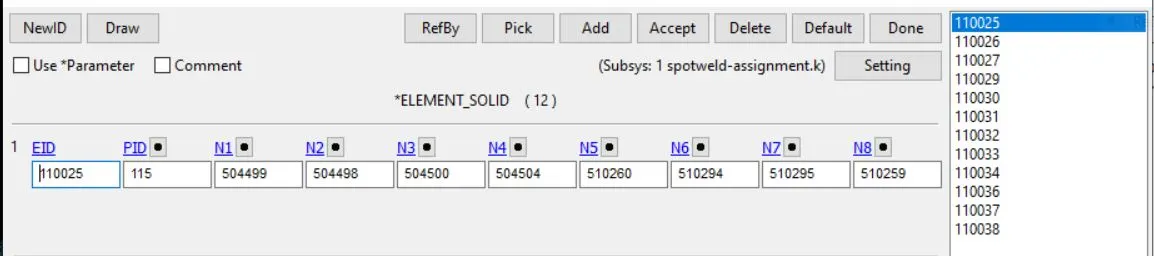
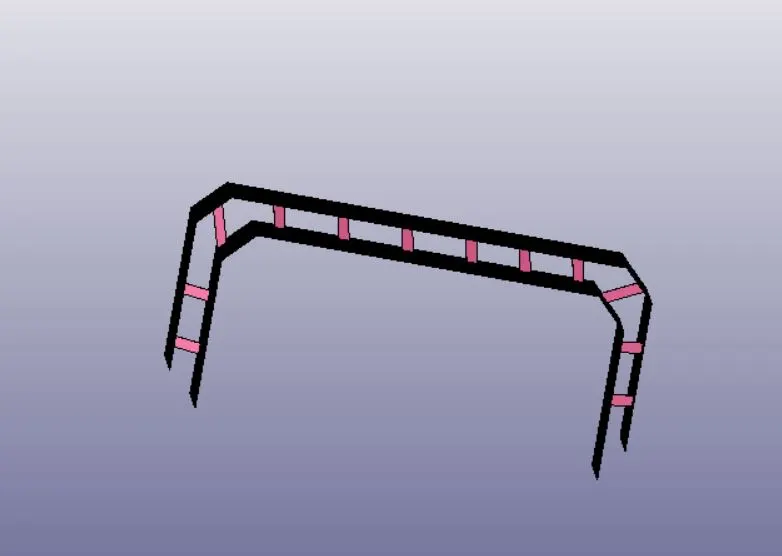
Fig: The spotwelds with solid elements.
As we aim to study the failure criterion of both the spotwelds, we constrained one one with boundary spc and in other shell in the opposite side, I implemented a curve with displacement as shown below, the displacement is given in such directions which would imitate the phenomeon when the body hits a rigid walls, the displacement occurs in the opposite directin of displacement
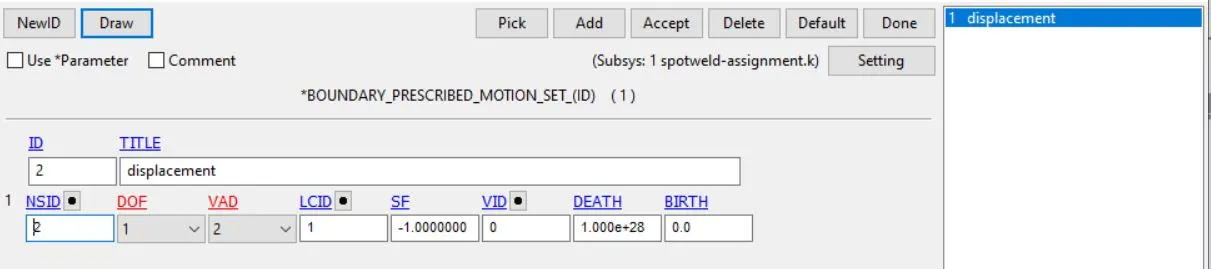
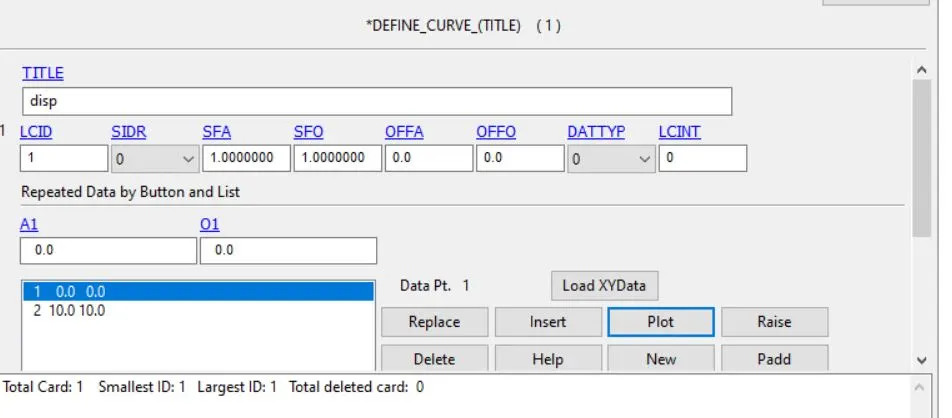
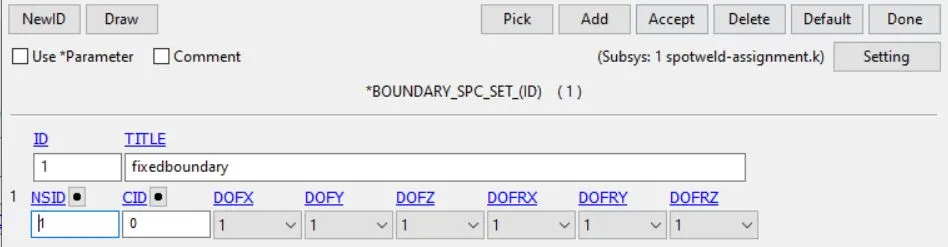

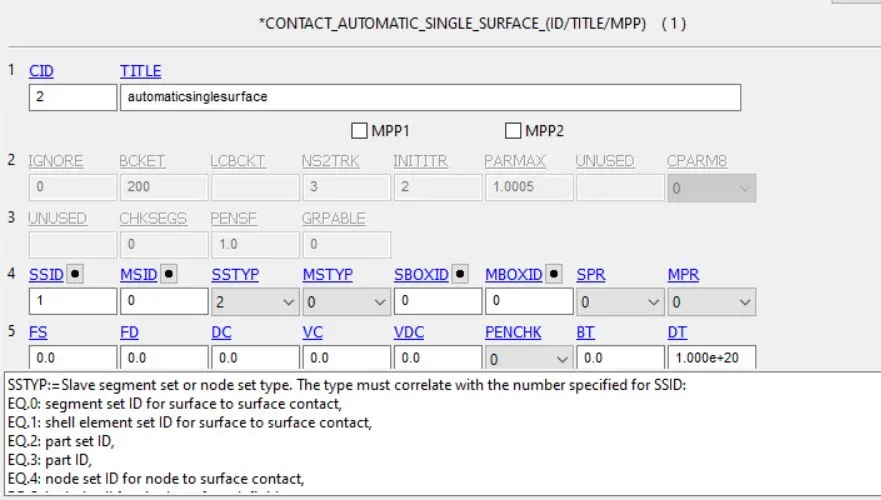
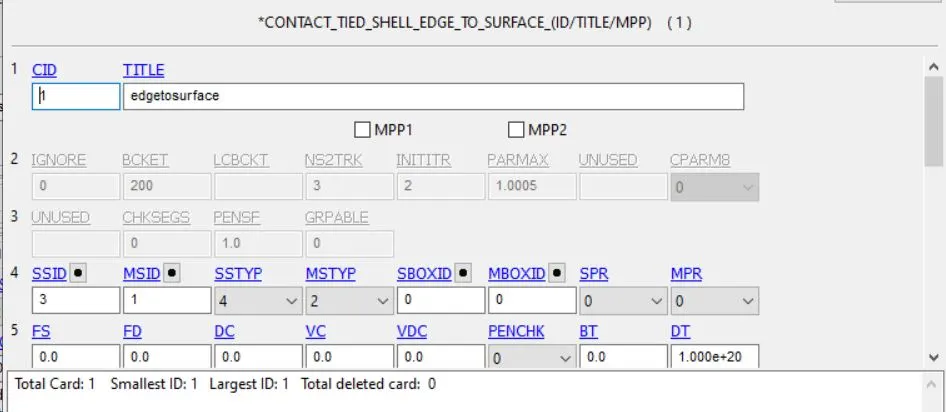 Database ASCII options (GLSTAT, SLEOUT, SECFORCE,NODOUT) were set with dt=1, and control termination of dt=10.
As expected the spotfailed failed at the TFAIL=6, as shown below for both beam and solid cases.
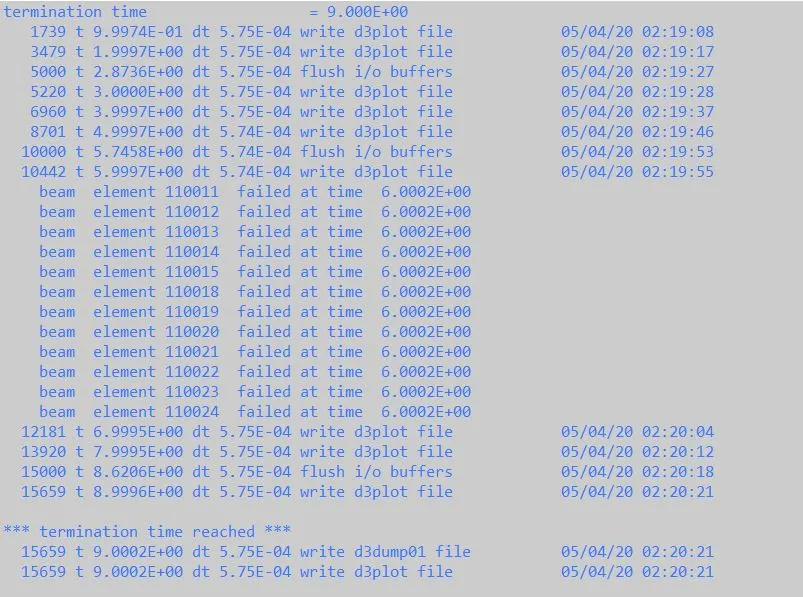
Fig: Normal termination for beam case
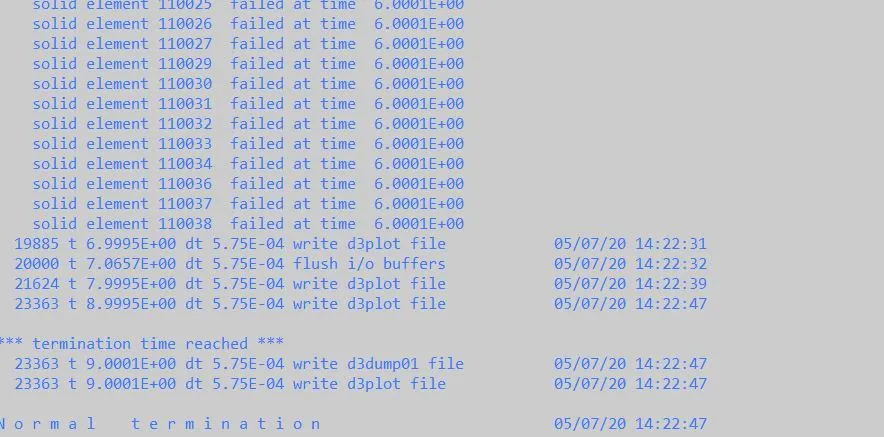 Fig: Fig :Normal termination for solid case
Post Processing:
Fig: Effective stress (beam) before failure step
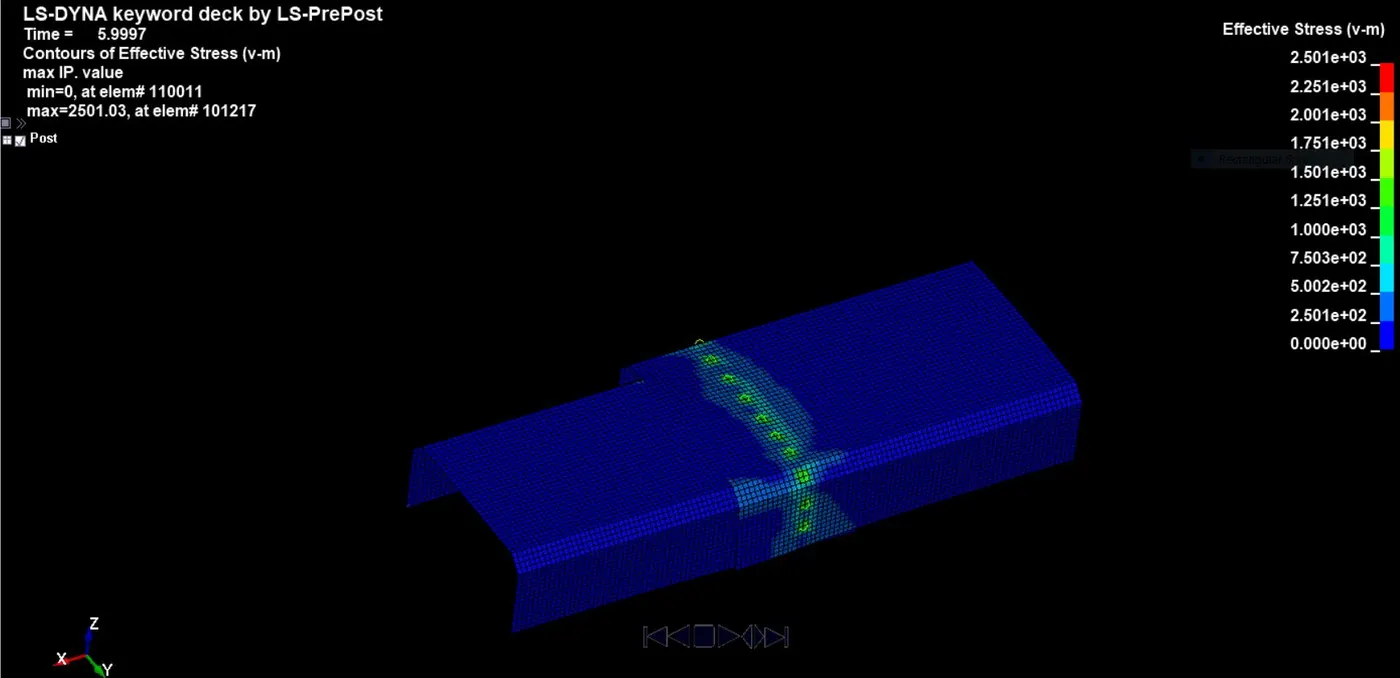
Fig: Effective stress (beam) after failure step
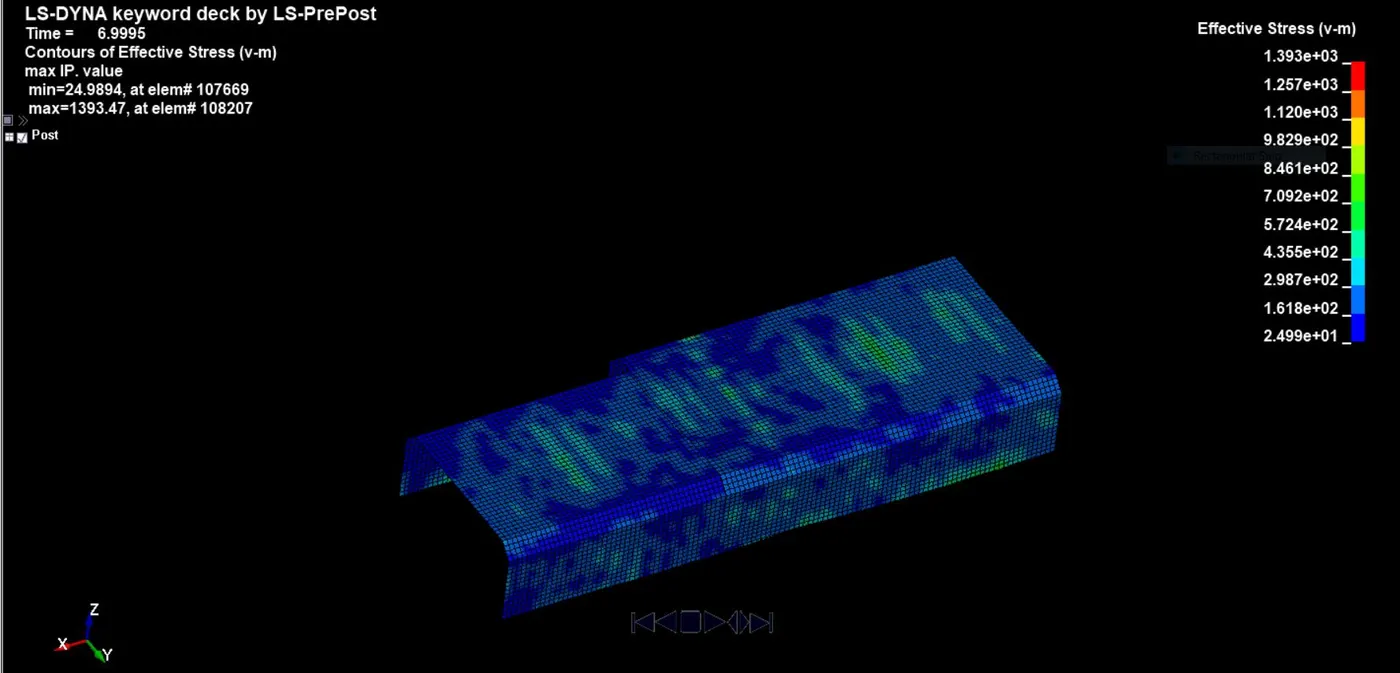
Fig: Effective stress (solid) before failure step
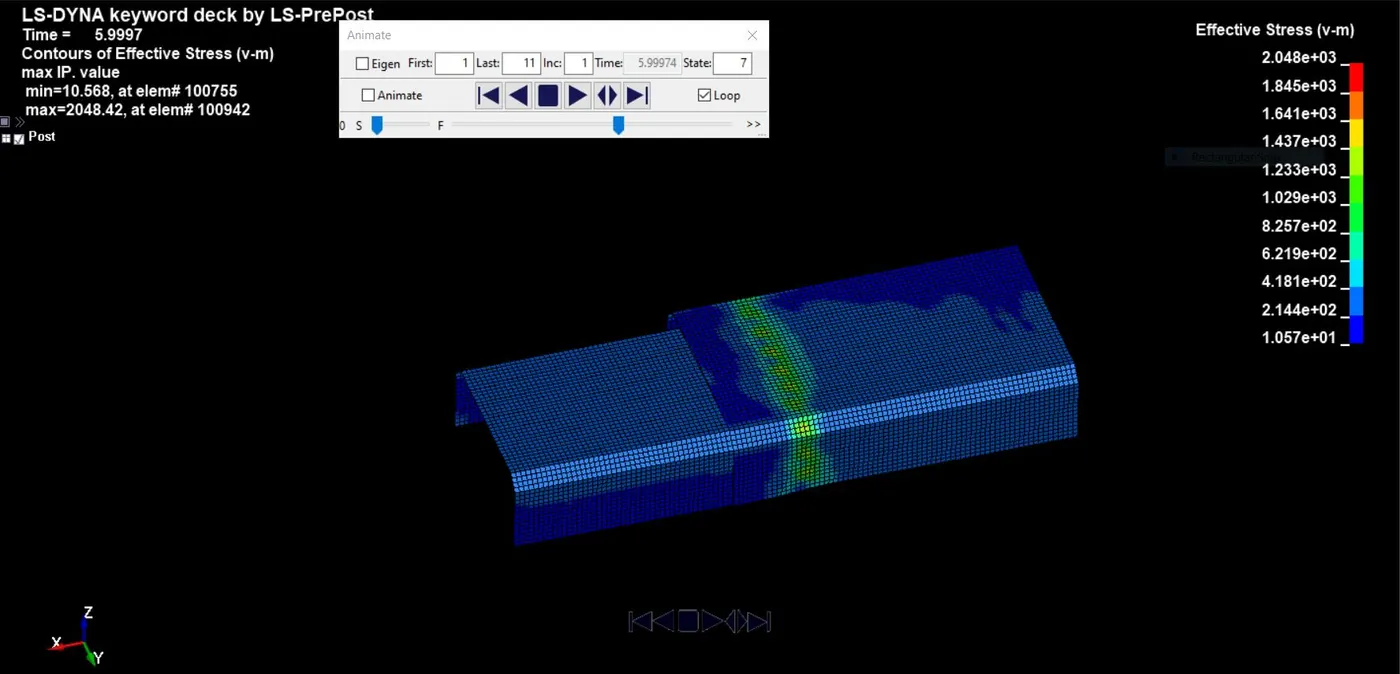
Fig: Effective stress (solid) after failure step
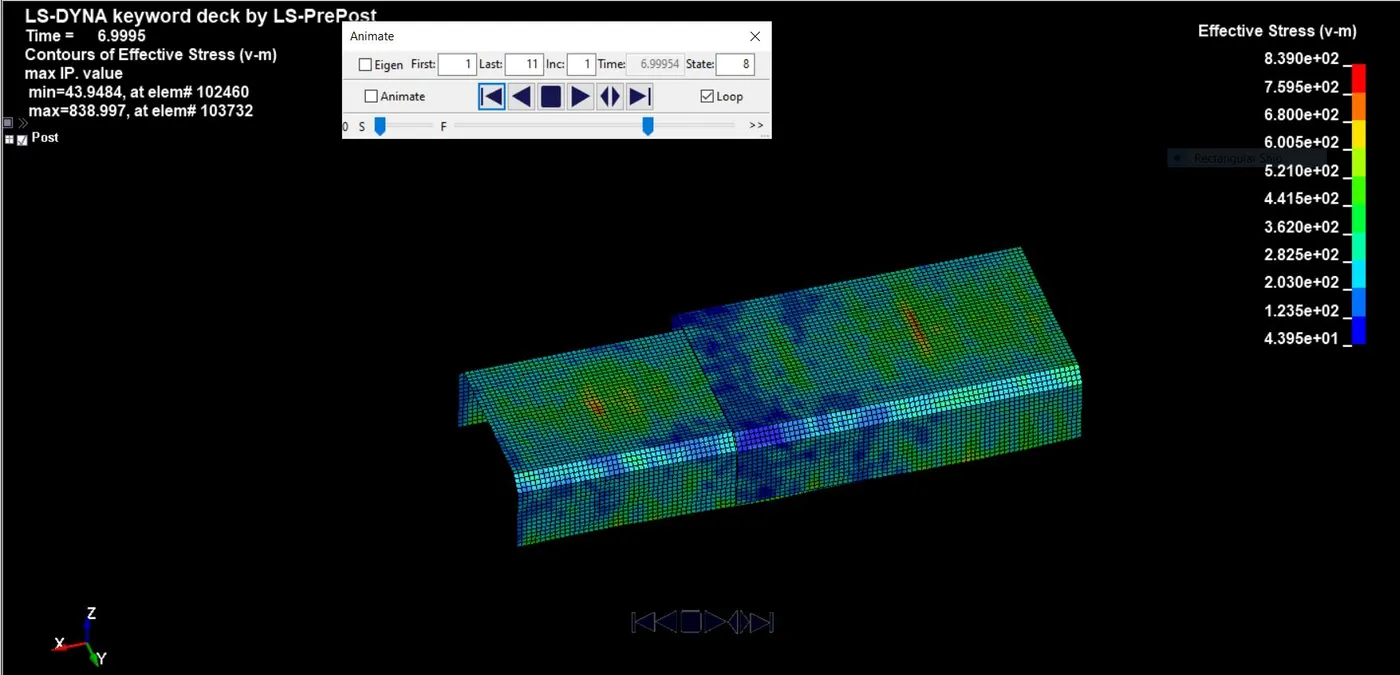
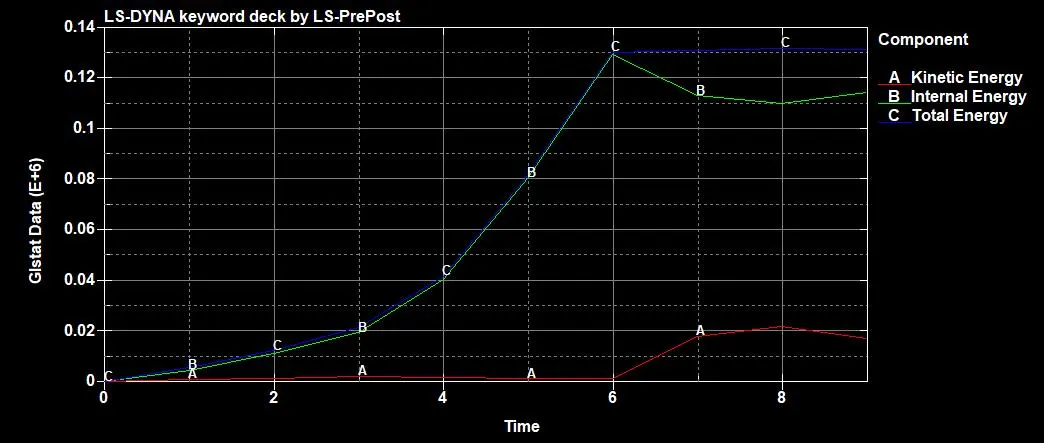
Fig: GLstat (beam): as we can see, the failure occurs at 6ms, we can see the kinetic energy increases and internal energy decreasing with same proportion.
Similar phenomenon is seen in GLstat (solid):
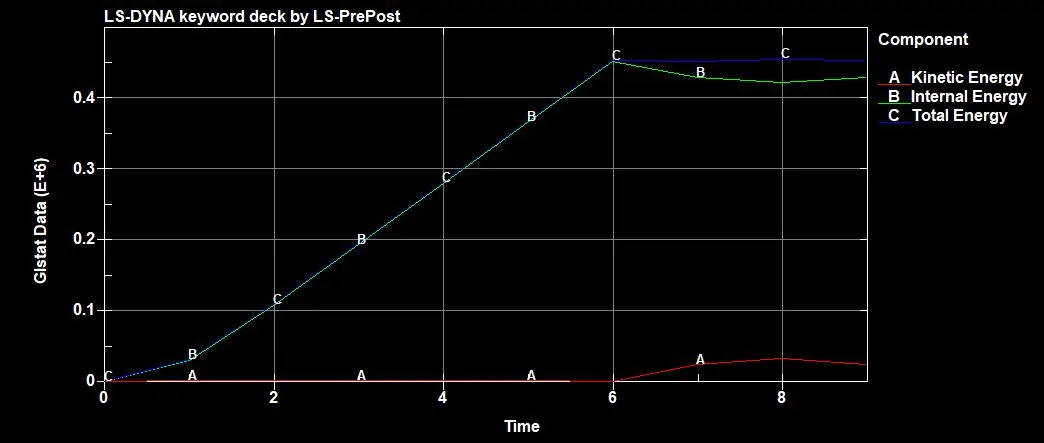
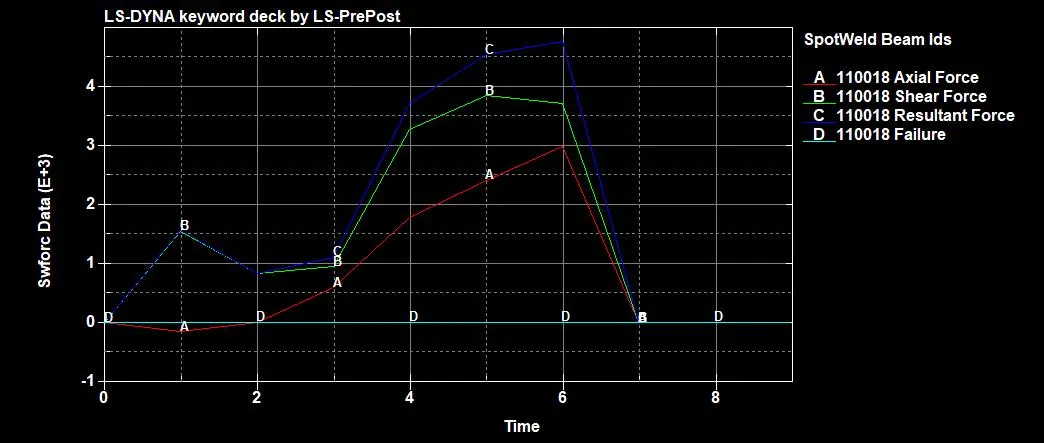
Fig: SWforce (beam): From the plot, shown below we can again see that after the failure time of 6ms, the axial force, shear force starts decreasing after it peaks just before failure.
Similar phenomenon was seen for SWforce (solid):
CONCLUSION :
1. From the SWFORCE plot, we can see that after the failure time of 6ms, the axial force, shear force starts decreasing after it peaks just before failure.
For both the beam and solid element cases, the shear forces are higher than the axial forces.
2. In the GLSTAT plots in both cases, we can see, the failure occurs at 6ms, we can see the kinetic energy increases and internal energy decreasing with same proportion.
N.B.- The keyword files for both the cases and for both the animation are attached below