Week 5 - Genetic Algorithm
AIM : To optimise the stalagmite function and find the global maxima of the function using Matlab Coding and to plot graphs for all 3 studies and for F maximum vs no. of iterations.
OBJECTIVE :
- To explain the concept of genetic algorithm and the syntax for ga in MATLAB in your report.
- To write a program to optimise the stalagmite function and find the global maxima of the function using Matlab Coding.
- To plot graphs for all 3 studies and for F maximum vs no. of iterations.
THEORY :
Genetic Algorithm:
The genetic algorithm is a method for solving both constrained and unconstrained optimization problems that is based on natural selection, the process that drives biological evolution. The genetic algorithm repeatedly modifies a population of individual solutions. At each step, the genetic algorithm selects individuals from the current population to be parents and uses them to produce the children for the next generation. Over successive generations, the population "evolves" toward an optimal solution. You can apply the genetic algorithm to solve a variety of optimization problems that are not well suited for standard optimization algorithms, including problems in which the objective function is discontinuous, nondifferentiable, stochastic, or highly nonlinear. The genetic algorithm can address problems of mixed integer programming, where some components are restricted to be integer-valued.
This flow chart outlines the main algorithmic steps.

Example:
A genetic algorithm is a search heuristic that is inspired by Charles Darwin’s theory of natural evolution. This algorithm reflects the process of natural selection where the fittest individuals are selected for reproduction in order to produce offspring of the next generation.
Notion of Natural Selection:
The process of natural selection starts with the selection of fittest individuals from a population. They produce offspring which inherit the characteristics of the parents and will be added to the next generation. If parents have better fitness, their offspring will be better than parents and have a better chance at surviving. This process keeps on iterating and at the end, a generation with the fittest individuals will be found.
This notion can be applied for a search problem. We consider a set of solutions for a problem and select the set of best ones out of them.
Five phases are considered in a genetic algorithm.
- Initial population
- Fitness function
- Selection
- Crossover
- Mutation
Initial Population:
The process begins with a set of individuals which is called a Population. Each individual is a solution to the problem you want to solve. An individual is characterized by a set of parameters (variables) known as Genes. Genes are joined into a string to form a Chromosome (solution). In a genetic algorithm, the set of genes of an individual is represented using a string, in terms of an alphabet. Usually, binary values are used (string of 1s and 0s). We say that we encode the genes in a chromosome.
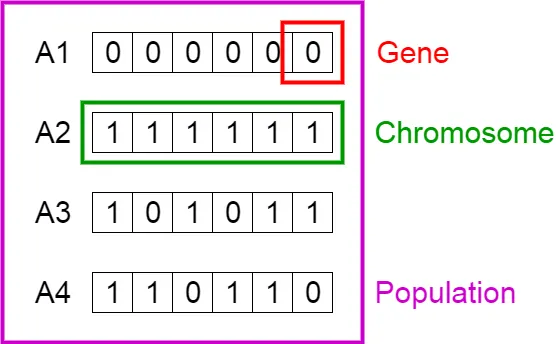
Population, Chromosomes and Genes
Fitness Function:
The fitness function determines how fit an individual is (the ability of an individual to compete with other individuals). It gives a fitness score to each individual. The probability that an individual will be selected for reproduction is based on its fitness score.
Selection:
The idea of selection phase is to select the fittest individuals and let them pass their genes to the next generation. Two pairs of individuals (parents) are selected based on their fitness scores. Individuals with high fitness have more chance to be selected for reproduction.
Crossover:
Crossover is the most significant phase in a genetic algorithm. For each pair of parents to be mated, a crossover point is chosen at random from within the genes.
For example, consider the crossover point to be 3 as shown below.
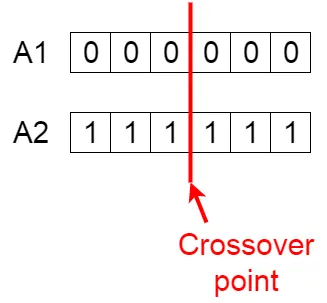
Crossover point
Offspring are created by exchanging the genes of parents among themselves until the crossover point is reached.
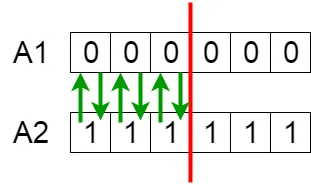
Exchanging genes among parents
The new offspring are added to the population.
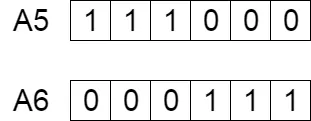
New offspring
Mutation:
In certain new offspring formed, some of their genes can be subjected to a mutation with a low random probability. This implies that some of the bits in the bit string can be flipped.
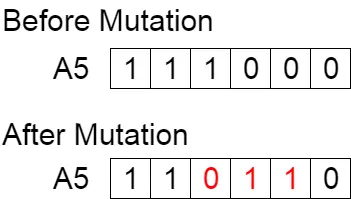
Mutation: Before and After
Mutation occurs to maintain diversity within the population and prevent premature convergence.
Termination:
The algorithm terminates if the population has converged (does not produce offspring which are significantly different from the previous generation). Then it is said that the genetic algorithm has provided a set of solutions to our problem.
SYNTAX FOR ga IN MATLAB:
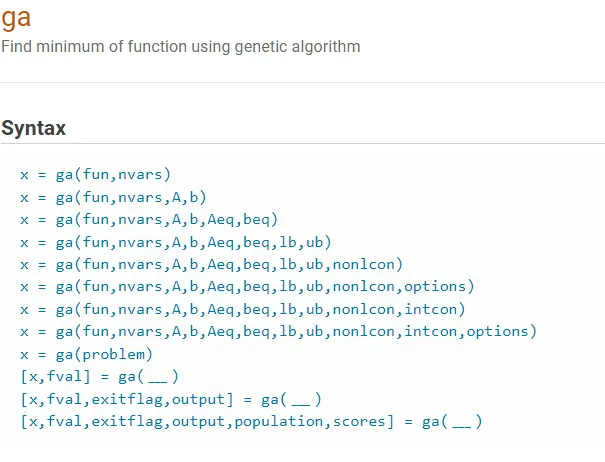
Description
x= ga(fun,nvars)x, to the objective function,fun.nvarsis the dimension (number of design variables) offun.
x= ga(fun,nvars,A,b)xtofun, subject to the linear inequalitiesA*x≤b.gaevaluates the matrix productA*xas ifxis transposed (A*x').
x= ga(fun,nvars,A,b,Aeq,beq)xtofun, subject to the linear equalitiesAeq*x=beqandA*x≤b. (SetA=[]andb=[]if no linear inequalities exist.)gaevaluates the matrix productAeq*xas ifxis transposed (Aeq*x').
x= ga(fun,nvars,A,b,Aeq,beq,lb,ub)x, so that a solution is found in the rangelb≤x≤ub. (SetAeq=[]andbeq=[]if no linear equalities exist.)
x= ga(fun,nvars,A,b,Aeq,beq,lb,ub,nonlcon)nonlcon. The functionnonlconacceptsxand returns vectorsCandCeq, representing the nonlinear inequalities and equalities respectively.gaminimizes thefunsuch thatC(x)≤0andCeq(x) = 0. (Setlb=[]andub=[]if no bounds exist.)
x= ga(fun,nvars,A,b,Aeq,beq,lb,ub,nonlcon,options)options. (Setnonlcon=[]if no nonlinear constraints exist.) Createoptionsusingoptimoptions.
x= ga(fun,nvars,A,b,Aeq,beq,lb,ub,nonlcon,intcon)x= ga(fun,nvars,A,b,Aeq,beq,lb,ub,nonlcon,intcon,options)intcontake integer values.
x= ga(problem)problem, a structure described inproblem.
[, for any previous input arguments, also returnsx,fval] = ga(___)fval, the value of the fitness function atx.
[also returnsx,fval,exitflag,output] = ga(___)exitflag, an integer identifying the reason the algorithm terminated, andoutput, a structure that contains output from each generation and other information about the performance of the algorithm.
[also returns a matrixx,fval,exitflag,output,population,scores] = ga(___)population, whose rows are the final population, and a vectorscores, the scores of the final population.
MATLAB CODE :
%CASE 1: program to to optimise the stalagmite function and find the global maxima of the function.

clear all
close all
clc

%defining our search space
x = linspace(0,0.6,150);
y = linspace(0,0.6,150);
num_cases=50;

%creating 2D mesh
[xx,yy] = meshgrid(x,y);


%evaluating the stalagmite function
for i=1:length(xx)
    for j=1:length(yy)
        input_vector(1)=xx(i,j);
        input_vector(2)=yy(i,j);
        f(i,j)= stalagmite(input_vector);
    end
end


tic
for k= 1:num_cases;
    [inp,fval(k)]=ga(@stalagmite,2);
    x_1(k)= inp(1);
    y_1(k)= inp(2);
end
study1_time=toc

figure(1)
subplot(2,1,1)
hold on
grid on
surfc(xx,yy,-f)
title('stalagmite plot')
xlabel ('X')
ylabel ('Y')
zlabel('Function Vlaues')

shading interp
plot3(x_1,y_1,-fval,'marker','o','markersize',5,'markerfacecolor','g')
title('unbounded inputs')
subplot(2,1,2)
plot(-fval)
xlabel('iterations')
ylabel('function minimum')

%CASE 2: program to study statistical behavior
tic
for s = 1:num_cases
    [input,fval(s)]= ga(@stalagmite,2,[],[],[],[],[0,0],[0.6,0.6]);
    x_2(s)= input(1);
    y_2(s)= input(2);
end
study2_time = toc

figure(3)
subplot(2,1,1)
surfc(xx,yy,-f)
shading interp
hold on
plot3(x_2,y_2,-fval,'marker','o','markersize',5,'markerfacecolor','g')
title('unbounded inputs')
subplot(2,1,2)
plot(-fval)
xlabel('iterations')
ylabel('function minimum')

%CASE 3: program to study increasing ga iterations
options = optimoptions('ga')
options = optimoptions(options,'PopulationSize',500)
tic
for m = 1:num_cases
    [input,fval(m)]= ga(@stalagmite,2,[],[],[],[],[0,0],[0.6,0.6],[],[],options);
    x_3(m)= input(1);
    y_3(m)= input(2);
end
study3_time =toc

figure(4)
subplot(2,1,1)
surfc(xx,yy,-f)
hold on
shading interp


plot3(x_3,y_3,-fval,'marker','o','markersize',5,'markerfacecolor','g')
title('unbounded inputs')
subplot(2,1,2)
plot(-fval)
xlabel('iterations')
ylabel('function minimum')
CODE EXPLANATION:
- First, Linspace command is used to define x & y with 150 elements between zero and 0.6 including the bounds. Then num cases is set which will be used as counter for iteration to 50.
- then a 2D grid is made using meshgrid command is created from x & y input tobe output to xx & yy.
- then for loop is used to solve the genetic algorithm for every element in the 2D mesh grid.
- the length of rows & column (which have equal length) are used as counters, then the input vector is declared as ga requires input vector which is each value in the mesh grid.
- then output of stalagmite function is stored in matrix,then tic command is used to start a timer, then for loop bounded by the number of iterations is formed, then ga code is entered for unbounded statistical study which have the following format: Tinputs, fopt] ga(fun, nvars) inputs represent the values of parameters x & y for which the function has the least value (fopt).
- then figure1 is plotted by the following steps
- First subplot command is used to partition the plot window in order to draw more than one plot in the same window, two rows and one column are specified and then the position of
- each plot is selected
- then x,y,& z axis are labelled
- then shading interp is used to smoothen the function plot and to remove the grid lines 19. then plot 3 command is used to plot a point in 3D, here it will plot- fopt because we need
- the maximum value of the function not the minimum 20. then the graph title is selected, then fopt value of the function is plotted on the second plot in the second row
- then its x & y axis are labelled, then the same study is made but this time it is bounded (has lower & upper limit) which requires the same commands and step excepts the ga command which have the following format:
- [input, fopt] ga(fun, nvars, A, b, Aeq, beq, lb, ub) Inputs, fopt, fun & nvars are the same as study-1
- the range of the genetic algorithm is bounded by introducing values for lower and upper bounds and hence the values of global maxima and the values of x & y will be within then defined search space in inputs
- then increasing population size study was done which is the same as before but it had different ga code of:
- [inputs, fopt ga(fun, nvars, A. b. Aeq, beq, lb, ub, nonicon, IntCon, options) = inputs, fopt, fun and nvars, A, b, Aeq, beq lb, ub are the same as study-1 and study-2
- the range of the genetic algorithm is bounded as in study-2 but to improove the accuracy,
- the commands optimoptions is introduced to increase the Population Size500, then total time is computed
- then using fprintf command the results are printed in the command windows, then the study time is printed
- then x, y coordinate of the maximum optimum values are printed
- then the optimum values of the function (maximum value) is printed which is calculated from the (negative mean) of the all iterations of the output value and the negative sign is used to get the maximum value
- then the study time of the whole 3 studies combined is printed.
RESULT :
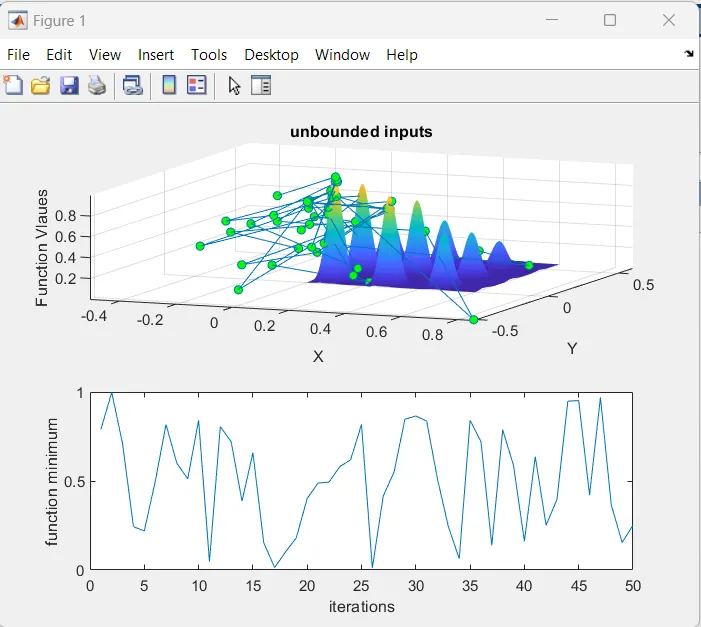
In figure1, it can be seen that since the inputs are boundless GA algorithm has mapped local maxima points outside our stalagmite function. Also we can not infer a particular value of global maxima from the above graph, and it is hence pointless. The study time is very less as the ga' algorithm is made only to run for 50 iterations.
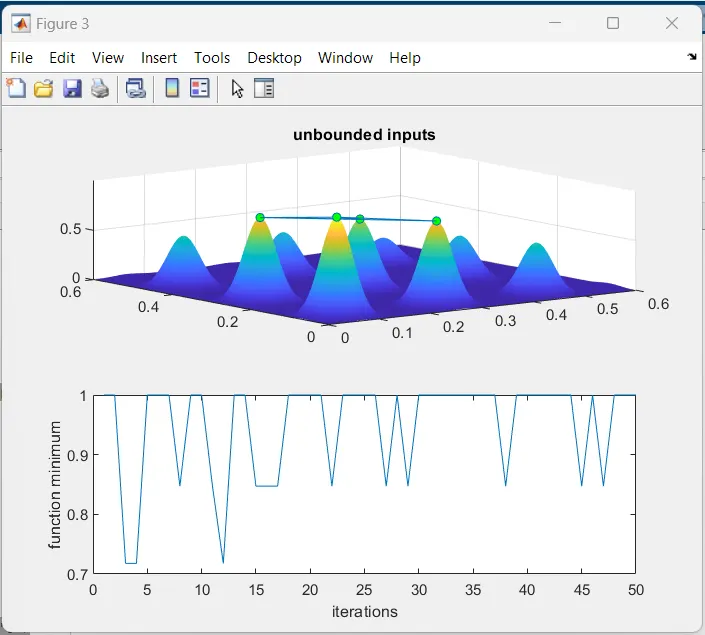
In figure2 is more clear and optimized compare to the first iterations since here the bounds were defined and we could get only the values within our range. We are now more clear on the range within which our maxima lies.
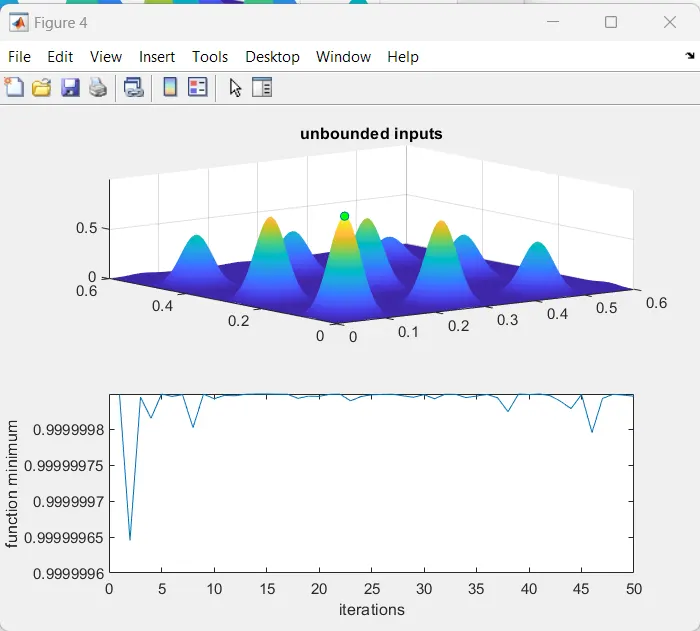
In figure4, we are getting the optimized value of global maxima with accurate range, since we increased the number of iterations and population size. Since the number of iterations and population size is increased the study time is so high.
CONCLUSION : In conclusion, by using all these cases or studies the most optimised genetic algorithm for population we find out better case to find exact values of population.