Week 5 - Genetic Algorithm
%Genetic Algorithm
%Start Of the Program
close all
clear all
clc
x=linspace(0,0.6,150);
y=linspace(0,0.6,150);
Limit=30;
%Creating 2D array using meshgrid function
[xx yy] = meshgrid(x,y);
%Nested loop for array value input
for i = 1:length(xx)
for j=1:length(yy)
input_vector(1)=xx(i,j);
input_vector(2)=yy(i,j);
f(i,j)= stalagmite_fun(input_vector);
end
end
tic
for i=1:Limit
[input,fval(i)]=ga(@stalagmite_fun,2);
x_out(i)=input(1);
y_out(i)=input(2);
end
Case_time_1=toc;
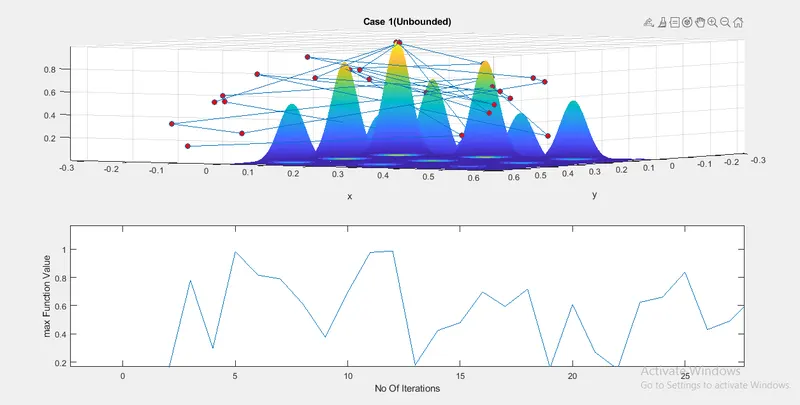
figure(1)
subplot(2,1,1)
surfc(xx,yy,-f)
hold on
shading interp
xlabel('x')
ylabel('y')
title('Case 1(Unbounded)','color','k')
plot3(x_out,y_out,-fval,'marker','o','markersize',6,'markerfacecolor','r');
subplot(2,1,2)
plot(-fval);
xlabel('No Of Iterations')
ylabel('max Function Value')
%Case:2 Inserting Bounding Box
tic
for i=1:Limit
[input,fval(i)]=ga(@stalagmite_fun,2,[],[],[],[],[0;0],[0.6;0.6]);
x_out(i)=input(1);
y_out(i)=input(2);
end
Case_time_2=toc
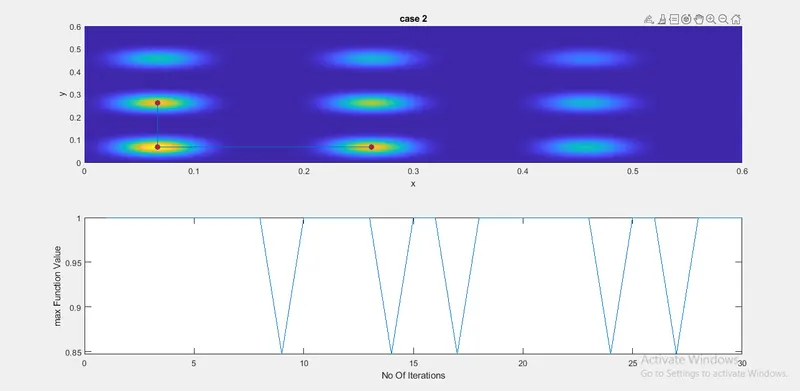
figure(2)
subplot(2,1,1)
hold on;
surfc(xx,yy,-f)
xlabel('x')
ylabel('y')
title('case 2','Color','k')
shading interp
plot3(x_out,y_out,-fval,'marker','o','markersize',6,'markerfacecolor','r');
subplot(2,1,2)
plot(-fval)
xlabel('No Of Iterations')
ylabel('max Function Value')
%Case:3
options=optimoptions('ga');
options=optimoptions(options,'populationsize',100)
tic
for i=1:Limit
[input,fval(i)]=ga(@stalagmite_fun,2,[],[],[],[],[0;0],[0.6;0.6],[],[],options);
x_out(i)=input(1);
y_out(i)=input(2);
end
Case_time_3=toc
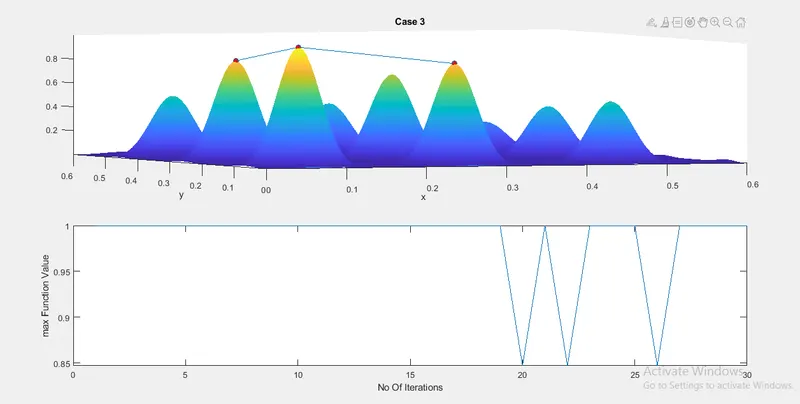
figure(3)
subplot(2,1,1)
hold on
surfc(xx,yy,-f)
shading interp
xlabel('x');
ylabel('y');
title('Case 3','color','k')
plot3(x_out,y_out,-fval,'marker','o','markersize',6,'markerfacecolor','r')
subplot(2,1,2)
plot(-fval)
xlabel('No Of Iterations')
ylabel('max Function Value')
%Case:4
options=optimoptions('ga');
options=optimoptions(options,'populationsize',300)
tic
for i=1:Limit
[input,fval(i)]=ga(@stalagmite_fun,2,[],[],[],[],[0;0],[0.1;0.1],[],[],options);
x_out(i)=input(1);
y_out(i)=input(2);
end
Case_time_4=toc
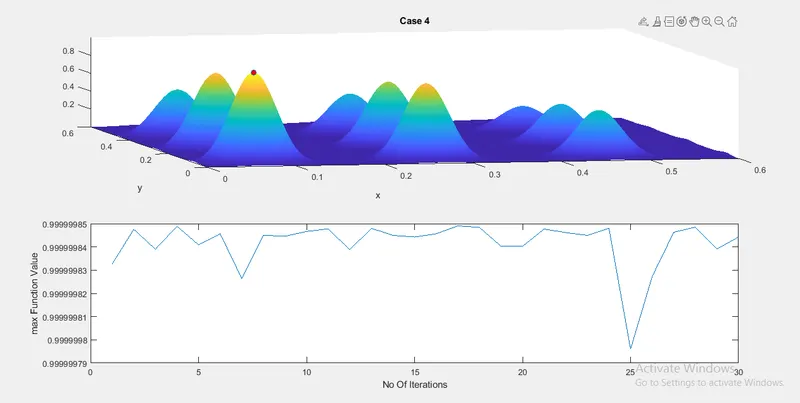
figure(4)
subplot(2,1,1)
hold on
surfc(xx,yy,-f)
shading interp
xlabel('x');
ylabel('y');
title('Case 4','color','k')
plot3(x_out,y_out,-fval,'marker','o','markersize',6,'markerfacecolor','r')
subplot(2,1,2)
plot(-fval)
xlabel('No Of Iterations')
ylabel('max Function Value')
%Displaying the values of x & y for maximum value of function
disp(input)
%End Of Program