Week 5 - Genetic Algorithm
Aim:- To optimise the stalagmite function and find the global maxima of the function using Genetic algorithm
Equations:- Since for this there is no Equation , but we have the a syntax for this i.e..
f=ga(fun,nvars,A,b,[],[],lb,ub,nonlcon,IntCon,options)
fun - fitness function.
nvars- number of variables,
A,b= Linear inequality constraints
Aeq,beq=Linear equality constraints
lb- Lower bound(limit),
ub- Upper bound(limit),
nonlcon : Use for nonlinear constraints
IntCon : to get solution in integer.
options- To set population size minimize with non-default options
Objective of project:-
The objective of project is to get the best possible solution for a given problem.
Body of content:-
% A program for a GA

clear all
close all
clc

% defining space
x=linspace(0,0.6,150);
y=linspace(0,0.6,150);

num_case = 50 ;

% creating a 2dimensional mesh
[xx yy]= meshgrid(x,y);

% evaluating the stalagmite function
for i=1:length(xx)
    for j=1:length(yy)
        input_vector(1)=xx(i,j);
        input_vector(2)=yy(i,j);
        F(i,j)=stalagmite(input_vector);
    end
end

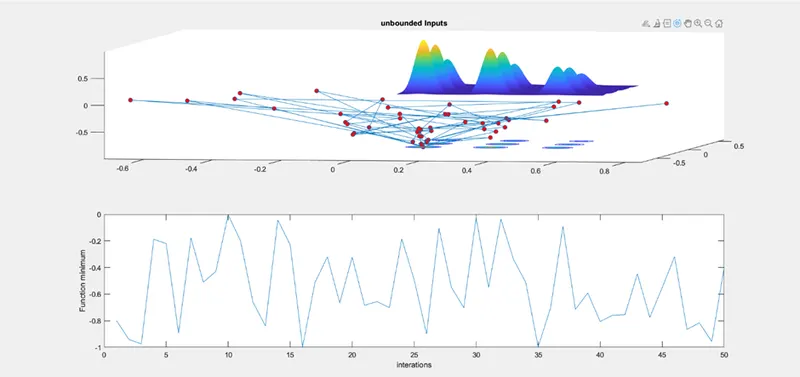
% case 1:- statistical behaviour
tic
for i =1:num_case
 [inputs,fopt(i)]= ga(@stalagmite,2);
 xopt(i)=inputs(1);
 yopt(i)= inputs(2);
end
study1_time=toc;

% plotting
figure(1)
subplot(2,1,1)
hold on
surfc(xx,yy,-F)
shading interp
plot3(xopt,yopt,fopt,'marker','o','MarkerFaceColor','r');
title('unbounded Inputs')
subplot(2,1,2)
plot(fopt)
xlabel('interations')
ylabel('Function minimum')
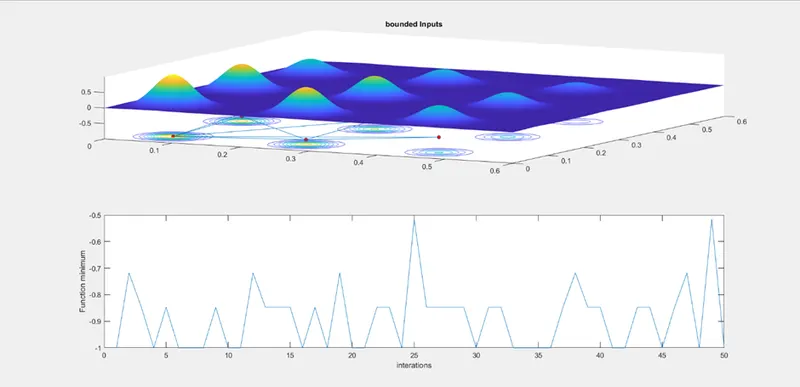
%case 2:- statistical behaviour with upper and lower bounds
tic
for i =1:num_case

 [inputs,fopt(i)]= ga(@stalagmite,2,[],[],[],[],[0;0],[1;1]);
 xopt(i)=inputs(1);
 yopt(i)= inputs(2);
end
study2_time=toc;

% plotting
figure(2)
subplot(2,1,1)
hold on
surfc(xx,yy,-F)
shading interp
plot3(xopt,yopt,fopt,'marker','o','markersize',5,'markerfaceColor','r')
title('bounded Inputs')
subplot(2,1,2)
plot(fopt)
xlabel('interations')
ylabel('Function minimum')
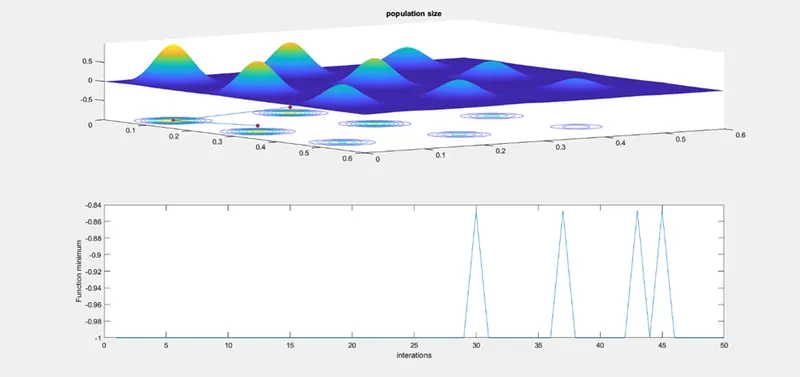
%case 3:- Increasing ga interations
tic
options=optimoptions('ga');
options= optimoptions(options,'PopulationSize',170);

for i =1:num_case

 [inputs,fopt(i)]= ga(@stalagmite,2,[],[],[],[],[0;0],[1;1],[],[],options);
 xopt(i)=inputs(1);
 yopt(i)= inputs(2);
end
study3_time=toc;

% plotting
figure(3)
subplot(2,1,1)
hold on
surfc(xx,yy,-F)
shading interp
plot3(xopt,yopt,fopt,'marker','o','markersize',5,'markerfaceColor','r')
title('population size')
subplot(2,1,2)
plot(fopt)
xlabel('interations')
ylabel('Function minimum')
function:-
function F=stalagmite(input_vector)
% input_vector(1)=x
% input_vector(2)=y


term1= (sin(5.1*pi*input_vector(1)+0.5))^6;
term2= exp(-4*log(2)*((input_vector(1)-0.0667)^2/0.64));
term3= (sin(5.1*pi*input_vector(2)+0.5))^6 ;
term4= exp(-4*log(2)*((input_vector(2)-0.0667)^2/0.64));

F= -(term1*term2*term3*term4);
end
Here we can say that A program of Genetic algorithm is ready to go with a proper execution, well in these we have used the commands like clc ,clear all ,Inputs , plot , x-label ,y-label.
Commands use for: -
- Clear all = used to clear the workspace.
- CLC = used to clear the command window.
- Close all = used to close the background program.
- % Inputs = used this command for better clarification to enter or add new terms.
- Plot = used for plotting a graph, terms used in bracket as shown above , always the same terms means exact words or letters used in Inputs so that we won’t get errors will running program.
- x-label & y-label = used for name recognition in x-axis & y-axis
- Hold on = Adding new plots or frame.
- Hold off = Hold the new plots or frame.
- For loop = To repeat the specified number of times.
- Axis = We used this command to inbuilt the plot or frame inside it , we can say like a frame of this dimensions.
- Legend = used this command to show a label in a plot itself
- Title = used this command to give heading .
- linewidth = used this command to increase the thickness of line.
- Tic = start stopwatch timer.
- Toc = The actual time taken to complete.
- Shading = The shading controls the colour shading of surface and patch graphics objects.
- Surfc = Contour plot under surface plot
Explanation of GA & syntax:-
>Genetic algorithm is used to find out the best possibilities of solution for the given problem , A genetic algorithm is nothing but a method to try and try to get the best result for a particular problem , In these GA there are two optimization i.e.. constraint and unconstraint optimization. The constraint optimization has a bounded conditions to get the stable result and for the unconstraint optimization has a unbounded conditions to get the unstable result.
f=ga(fun,nvars,A,b,[],[],lb,ub,nonlcon,IntCon,options)
where,
fun = fitness function.
nvars = number of variables.
A,b = Linear inequality constraints.
Aeq,beq = Linear equality constraints.
lb = Lower bound(limit).
ub = Upper bound(limit).
nonlcon = Use for nonlinear constraints.
IntCon = to get solution in integer.
options = To set population size minimize with non-default options.
Stopping criteria of GA:-
As soon the algorithm reaches to the point then it will get stop.