Week 5 - Curve fitting
CURVE FITTING
Objective: The main objective of this project is to perform a curve fitting process on the given data and obtain its best function which describes the data.
Curve fitting: It is the process of constructing a curve with a given data and find out its best curve fit by using a mathematical function
Project:
- In this, the data given is the specific heat at constant pressure (CP) with temperature with 3200 points.
- Cp is a function of temperature which is assumed to be a polynomial of varying order and each function is used to perform the curve fitting process.
- The different equations used for Cp are:
Cp(t) = a⋅t + b
Cp(t) = a⋅t2 + b⋅t + c
Cp(t) = a⋅t3 + b⋅t2 + c⋅t+ d
Cp(t) = a⋅t4+ b⋅t3 + c⋅t2 + d⋅t + e
Cp(t) = a⋅t5 + b⋅t4 + c⋅t3 + d⋅t2+ e⋅t + f
A code was written using 3rd degree equation (cubic function) which is as follows:
#Program for Curve fitting
import math
import matplotlib.pyplot as plt
import numpy as np
from  scipy.optimize import curve_fit

#Curve fit function
def func(t,a,b,c,d):
    return a*(t**3) + b*(t**2) + c*(t) + d       #3rd degree polynomial equation is written,** is used instead of power

#Reading Thermodynamic data file
def read_file():

    temperature = []
    Cp = []
    for line in open('data','r'):
        values = line.split(',')               #Split command is used to split the data where comma(,) symbol is used
        temperature.append(float(values[0]))   #Temp value is at position with index 0
        Cp.append(float(values[1]))            #Cp value is at position with index 1 in given data file
    return[temperature,Cp]


#Main program
temperature,Cp = read_file()
popt,pcov = curve_fit(func,temperature,Cp)     #This code helps us in finding the variables a,b,c,d using matrix eq solving
Fit_Cp = func(np.array(temperature),*popt)     #*popt is used to read the entire array

plt.plot(temperature,Cp)
plt.plot(temperature,Fit_Cp)
plt.legend(['Actual data','Curve fit'])
plt.xlabel('Temperature[K]')
plt.ylabel('Cp')
plt.show()
Explanation of code:
- Firstly import the required modules for computing the code. In this curve_fit is to be imported from scipy.optimization.
- Now a read file function is created in which temperature and Cp empty arrays are created. In this split is used for differing the values and then temperature and Cp are appended and returned for continuous loop.
- In the main program a read file is created for reading temperature ,Cp values are read and stored in 2 arrays. After the data has been read a curve fit operation is performed and from the curve fit, we get 2 outputs: popt and pcov.
- Popt is an array which stores the values of variables after computing for further usage. Pcov is the array where the covariance of the optimum values are stored and using the Pcov array we can determine the accuracy of the coefficients obtained from the curve fit.
- Now np.array() of temperature is utilized where values are stored in an array and entire array of temperature is used as an argument utilizing each value and function return value is calculated instead of using loop.
- The * in *popt refers to pointer operator. The pointer operator points to each and every value in the popt array. The coefficient array is passed as an argument in a manner similar to the temperature array and the pointer operator is used to pass the coefficients individually to the polynomial.
- Now plots are plotted and are compared between the actual data and then curve fit data.
Results:
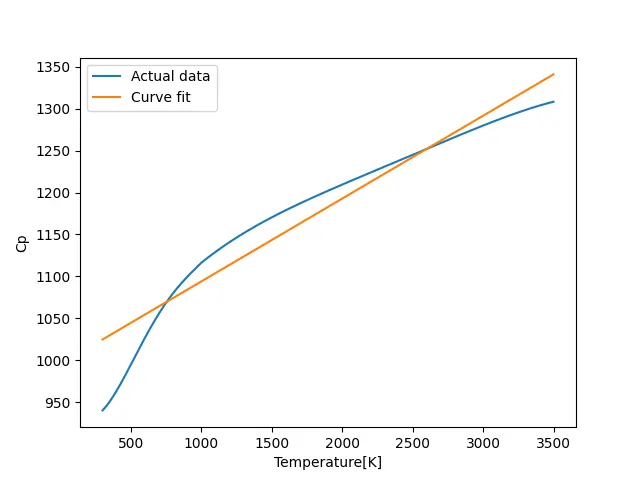
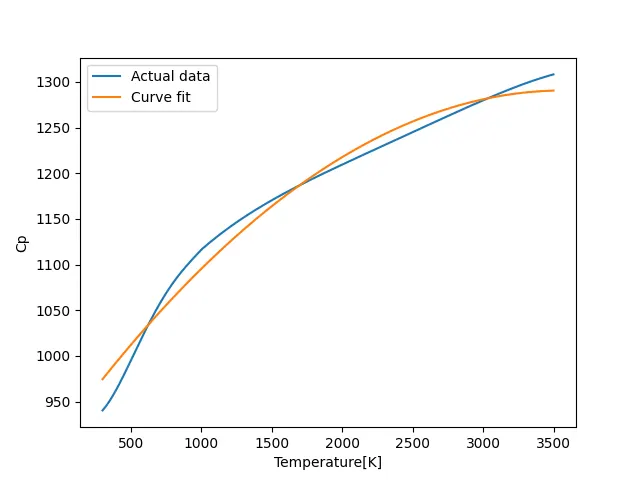
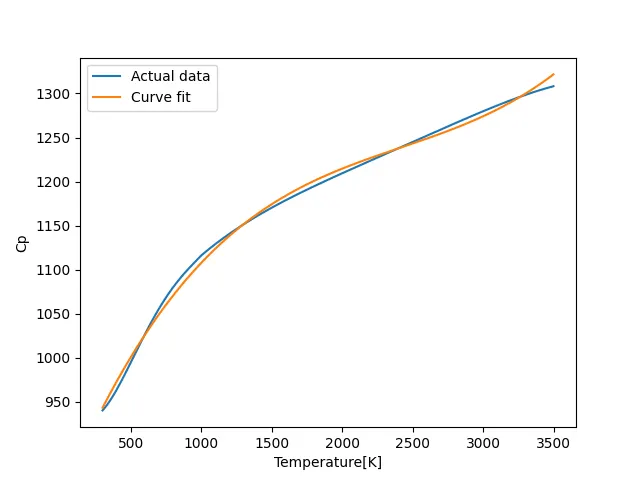
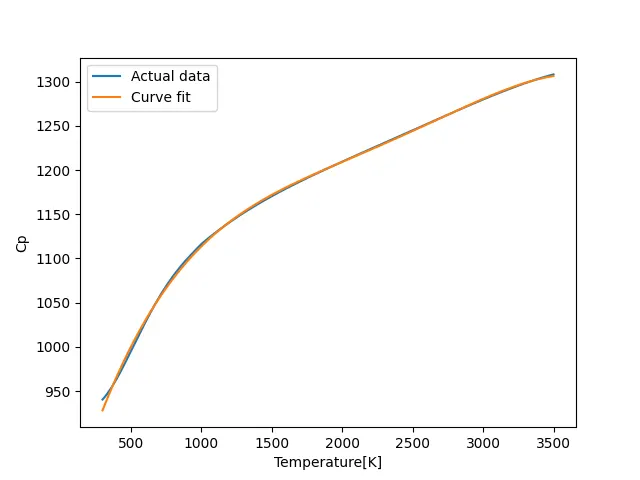
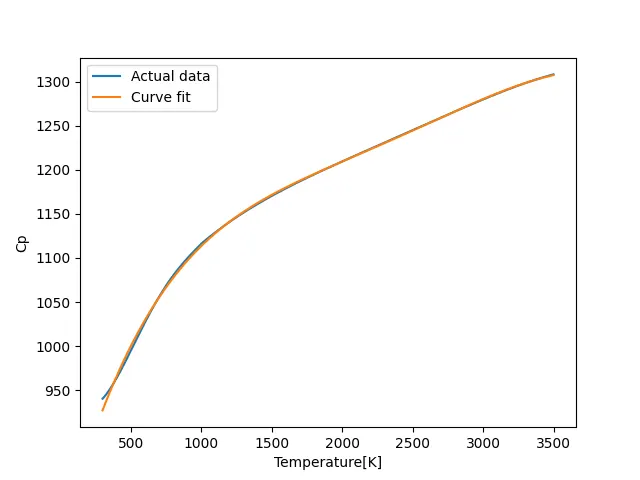
Now lets observe the results obtained for using different polynomial functions such as from 1st order(linear) to 5th order which are as below:
- Linear order polynomial function fit:
- 2nd order polynomial function fit:
- 3rd order polynomial function fit:
- 4th order polynomial function fit:
- 5th order polynomial function fit:
Conclusion:
- As we see from different figures we can come to a conclusion that the fits gets accurate as the order polynomial increases. So linear order is bad fit and 3rd order polynomial is closely fit. As we see more 4th and 5th polynomial functions gives better results but as the order increases the coefficients of higher order nears to zero which is bad sign.
- So instead of that split between ranges of temperatures can be used having a appropriate polynomial function can be utilized for perfect fit.