Week 5 - Curve fitting
1. popt- An array of optimal values for the parameters which minimizes the sum of squares of residuals.
pcov-2d array which contains the estimated covariance of popt. The diagonals provide the variance of the parameter estimate.
2. np.array- converts python lists (temperature) into a numpy arrray, so that we can perform all mathematical operations using np.array which cannot be achived using python lists.
3. * in popt is the reference ie the values stored in the popt array
4. Linear curve fit Code:
import numpy as np
import matplotlib.pyplot as plt
from scipy.optimize import curve_fit

def func(t,a,b):
	return a*t+ b

def read_file():
	temp = []
	cp = []
	for line in open('data','r'):
		values = line.split(',')
		temp.append(float(values[0]))
		cp.append(float(values[1]))

	return[temp,cp]

temp,cp = read_file()
popt, pcov = curve_fit(func,temp,cp)
fit_cp = func(np.array(temp),*popt)

plt.plot(temp,cp,color="blue",linewidth=3)
plt.plot(temp,fit_cp,color="red",linewidth=3)
plt.legend(['Actual data','Curve fit'])
plt.xlabel('Temperature')
plt.ylabel('Cp')
plt.savefig('linear_fit.png')
plt.show()
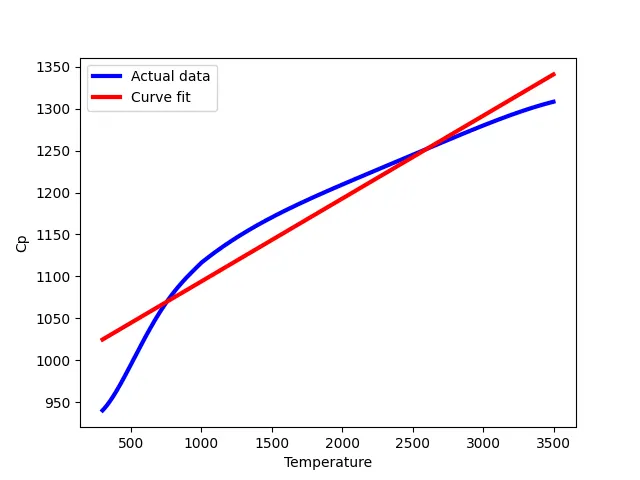
Output :
Cubic curve fit Code :
import numpy as np
import matplotlib.pyplot as plt
from scipy.optimize import curve_fit

def func(t,a,b,c,d):
	return a*pow(t,3)+ b*pow(t,2) + c*t +d

def read_file():
	temp = []
	cp = []
	for line in open('data','r'):
		values = line.split(',')
		temp.append(float(values[0]))
		cp.append(float(values[1]))

	return[temp,cp]

temp,cp = read_file()
popt, pcov = curve_fit(func,temp,cp)
fit_cp = func(np.array(temp),*popt)

plt.plot(temp,cp,color="blue",linewidth=3)
plt.plot(temp,fit_cp,color="red",linewidth=3)
plt.legend(['Actual data','Curve fit'])
plt.xlabel('Temperature')
plt.ylabel('Cp')
plt.savefig('Cubic_fit.png')
plt.show()
Output:
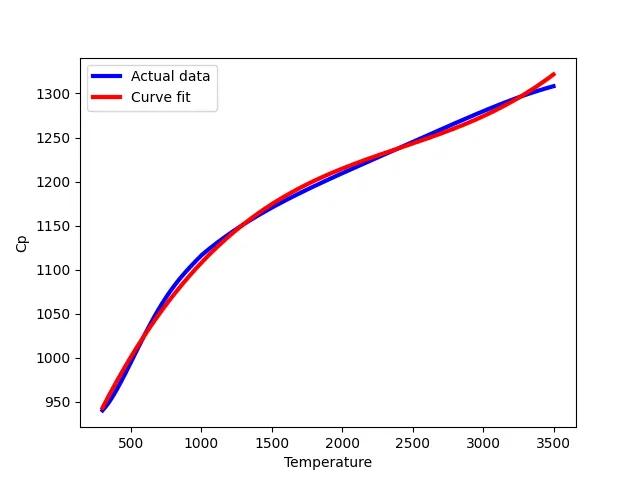
5. By increasing the degree of the cure we can improve the curve fit.