Curve fitting
CURVE FITTING
AIM:
1. What does popt and pcov mean? (Watch the video to get some context)
2. What does np.array(temperature) do?
3. What does the * in *popt mean?
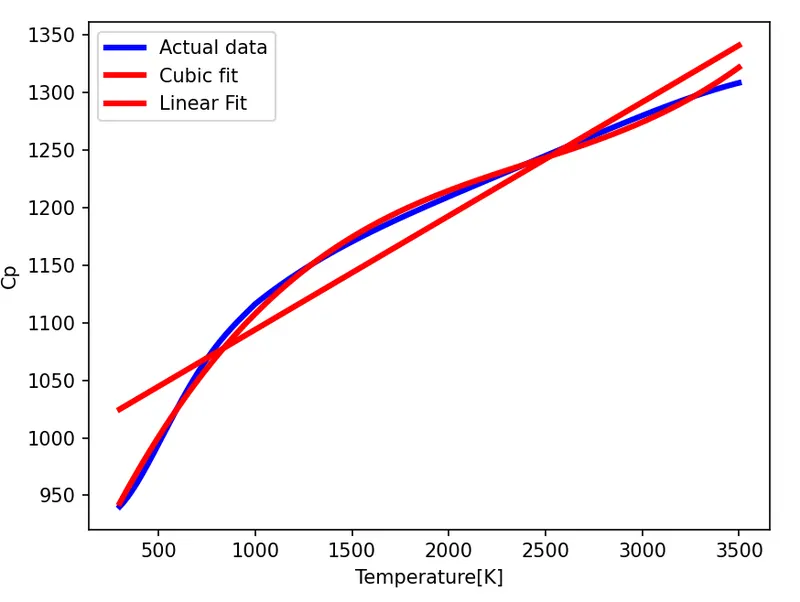
4. Write code to fit a linear and cubic polynomial for the Cp data. Explain if your results are good or bad.
5. What needs to be done in order to make the curve fit perfect?
6. Show empirically as to how well your curve has been fit.
PROGRAM:
import numpy as np
import matplotlib.pyplot as plt
from scipy.optimize import curve_fit

#CURVE FIT FUNCTION
def func(t,a,b,c,d):
	return a*pow(t,3)+b*pow(t,2)+c*t+d

def func1(t,a,b):
	return a*t+b


#READING THERMODYNAMIC DATA FILE
def read_file():
	temperature=[]
	cp=[]

	for line in open('data','r'):
		values=line.split(',')
		temperature.append(float(values[0]))
		cp.append(float(values[1]))

	return[temperature,cp]


#MAIN PROGRAM
temperature,cp=read_file()
popt,pcov=curve_fit(func,temperature,cp)
popt1,pcov1=curve_fit(func1,temperature,cp)
fit_cp= func(np.array(temperature), *popt)
fit_cp1= func1(np.array(temperature), *popt1)


plt.plot(temperature,cp,color="blue",linewidth=3)
plt.plot(temperature,fit_cp,color="red",linewidth=3)
plt.plot(temperature,fit_cp1,color="red",linewidth=3)
plt.legend(['Actual data','Cubic fit','Linear Fit'])
plt.xlabel('Temperature[K]')
plt.ylabel('Cp')
plt.show()
PRINCIPLE;
Curve Fit: The process of constructing curve or a mathematical function from a series of data points. It also deals with Derive the relation between the independent variable(eg.x) to the dependent variable(e.g. y).
In the present study we plot the linear and cubic fit and compare the results of both.
Linear curve
First degree polynomial equation is y=ax+b
Where a is the slope of the line. It is an exact fit through any two points with distinct x coordinates. Here the order of polynomial is 1 and the no of unknown=2(a,b).i.e. number of unknows is always 1 greater than the order of the polynomial.
If n is the order of the polynomial ,n+1 is the no of unknowns.
Cubic Curve
Third order polynomial equation used is y= ax3+bx2+cx+d. Here the order of polynomial is 3 and the number of unknows (a,b,c,d). Hence curve fitting a third order equation gives more accurate results compared to linear curve.
RESULTS
- DV
- np.array(temperature) reads the file data and passes of the data to a new filename temperature. The variable temperature contains only the temperature in the data file
- popt return the optimised coefficient into opot array
- Program writtten as above
- To improve the accuracy of the fit, splitwise fit operation is best suited