Week 5 - Curve fitting
1.What does popt and pcov mean?
- popt is an array with the optimal parameters obtained using a non-linear least squaresfit.
- pcov is a 2d array with the estimated covariance of the parameters in popt.
2.What does np.array(temperature) do?
A numpy array is a grid of values, all of the same type.Here it is being used to pass the values of temperatue to the function.
3.What does the * in *popt mean?
The star here means that it is being referenced. Any and all change which could have occure to popt while in a function would be reflected in the original popt.
5.What needs to be done in order to make the curve fit perfect?
A curve fit can almost never be perfect because experimental data will always vary from a perfect equation. However the fit can be made as close as possible by trying different order equations, extrapolation, dividing the data and curve fitting them separately or on very rare case finding an equation which fits the data perfectly.
Program 1 : Linear function
import numpy as np
import matplotlib.pyplot as plt
from scipy.optimize import curve_fit

def func(t,a,b):

       return a*t + b

def read_file():

	temp = []
	cp = []
	for line in open ('data','r'):        # opening a file and reading the data
	    values = line.split(',')          # splitting line using comma
	    temp .append(float(values[0]))    # appending or adding data into the temp file
	    cp.append(float(values[1]))

	return [temp,cp]


temp,cp = read_file()                     # calling the function read_file and storing the values into temp & cp
popt,pcov = curve_fit(func,temp,cp)       # popt = coefficients i.e a & b , pcov = estimated covarience of popt
fit_cp = func(np.array(temp), *popt)      # we are passing temp as numpy array


plt.plot(temp,cp,color="red",linewidth=3)
plt.plot(temp,fit_cp,color="blue",linewidth=3)
plt.legend(['actual data','curve fit data'])
plt.xlabel('temperature [K]')
plt.ylabel('cp')
plt.show()
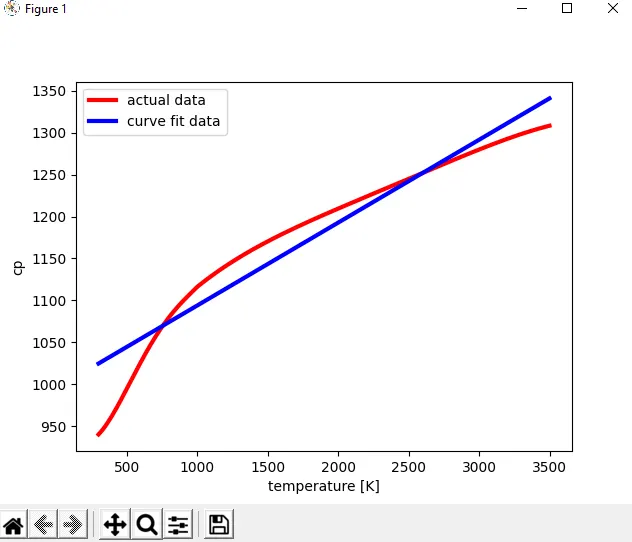
output :
Program 2 : Cubical function
import numpy as np
import matplotlib.pyplot as plt
from scipy.optimize import curve_fit

def func(t,a,b,c,d):

       return a*pow(t,3)+ b*pow(t,2) + c*t + d
def read_file():

	temp = []
	cp = []
	for line in open ('data','r'):        # opening a file and reading the data

	    values = line.split(',')          # splitting line using comma

	    temp .append(float(values[0]))    # appending or adding data into the temp file

	    cp.append(float(values[1]))

	return [temp,cp]


temp,cp = read_file()
popt,pcov = curve_fit(func,temp,cp)       # popt = coefficients i.e a , b , c & d  , pcov = estimated covarience of popt
fit_cp = func(np.array(temp), *popt)      # we are passing temp as numpy array

plt.plot(temp,cp,color="red",linewidth=3)
plt.plot(temp,fit_cp,color="blue",linewidth=3)
plt.legend(['actual data','curve fit data'])
plt.xlabel('temperature [K]')
plt.ylabel('cp')
plt.show()
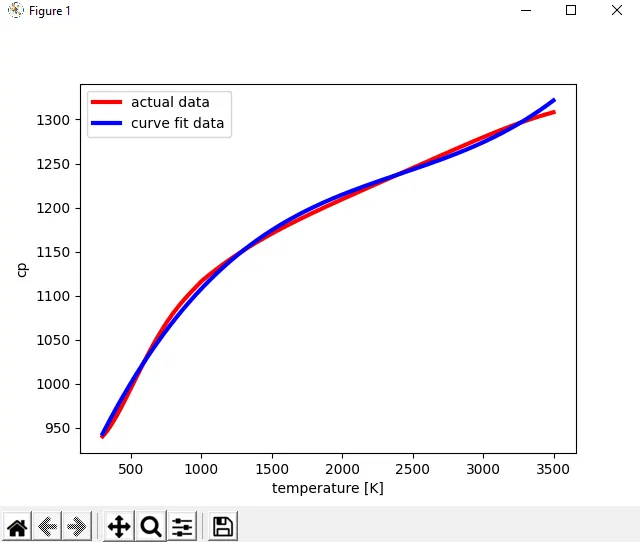
Output: