Week 5 Challenge
Aim: To calculate the wind loads and do the structural analysis of the bridge by applying wind load.
Given data:
- The height of the bridge above ground level is 9 m.
- It is located in open terrain with well-scattered obstructions of height less than 10m. (terrain category-2)
- The pier size is 1.5 x 1.5 m.
Assumption:
Bridge deck width = 10 m & thickness 0.2 m.
The total length of the bridge is considered as 20 m with intermediate pier support at 10 m in length.
3 nos of the pier at each end.
The depth of the pier below GL =3 m.
The main girder beam section is considered as 0.5 m x 1 m.
The Cross girder beam section is considered as 0.4 m x 0.8 m.
The cross girders are given at an interval of 5 m length of the bridge.
Fixed support condition is considered for the pier end.
Solution:
Let's consider the location is Chennai,
so basic wind speed (Vb) is 50 m/s
k1(Risk coefficient) = 1.08 (from table 1 of IS 875 part 3)
k2(Height factor) = 1 ( from table 2 of IS 875 part 3)
k3 ( Topography factor)=1
k4 ( Importance factor for the cyclonic region) =1.3 ( As Chennai is a coastal area)
Design wind speed (Vz) = Vb x k1 x k2 x k3 x k4 = 50 x 1.08 x 1 x 1 x 1.3 = 70.3 m/s
wind pressure (Pz) = 0.6 * Vz^2 = 2.97 kN/m2
For design wind pressure (Pd) calculation,
Wind directionality factor (kd) = 1
For area averaging calculation (ka),
Tributary area = pier height above GL x minimum c/c distance of pier in either direction
=9 x 5 =45 m2
Ka=0.9 + ((0.8-0.9)/(100-25))*(45-25) = 0.873
Kc (Combination factor) =1
Now Pd = Pz x Ka x Kd x Kc =2.59 kN/m2.
Structural Analysis in Staad Pro.
Considering the above details of the bridge , A bridge model was prepared in staad pro.
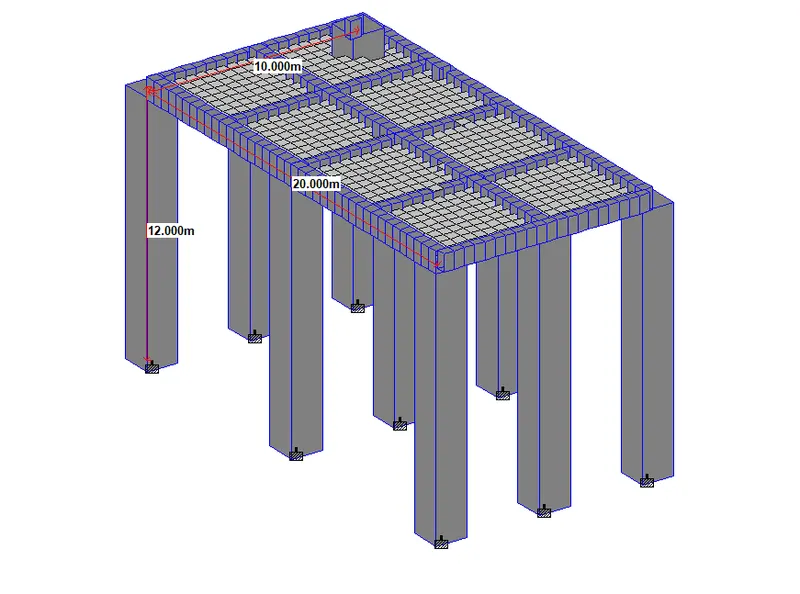
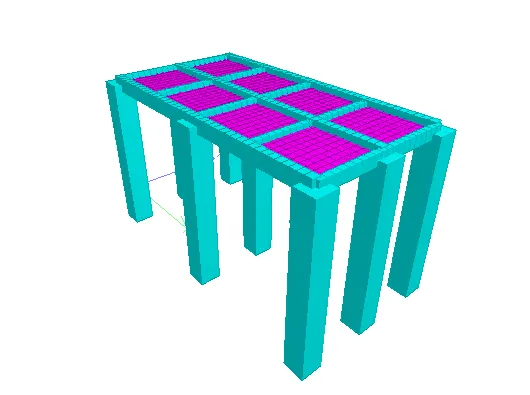
(3D model of the bridge)
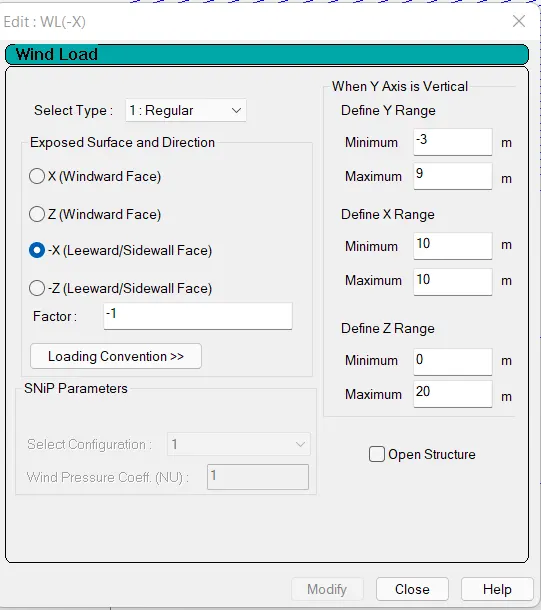
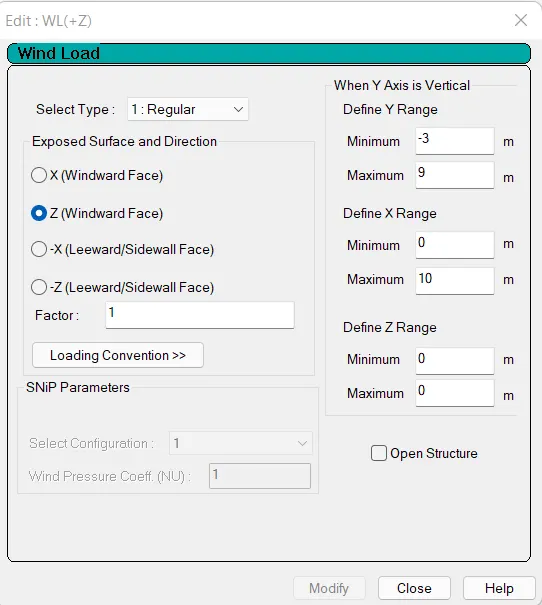
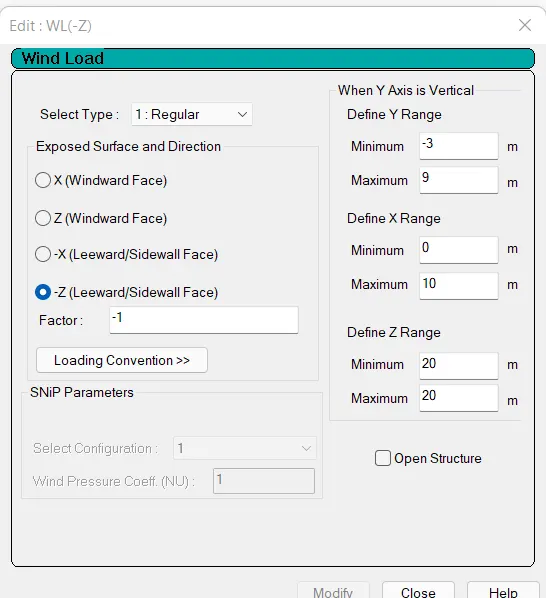
Then in the wind definition custom pressure was given for a particular height as shown below.
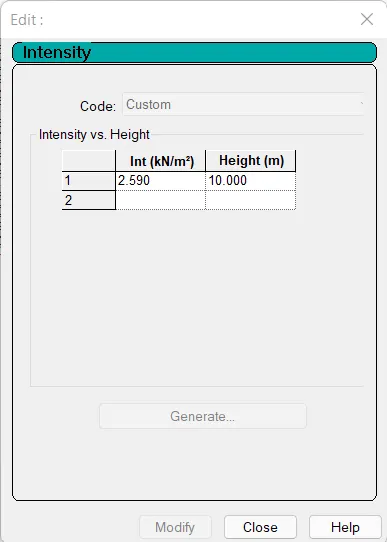
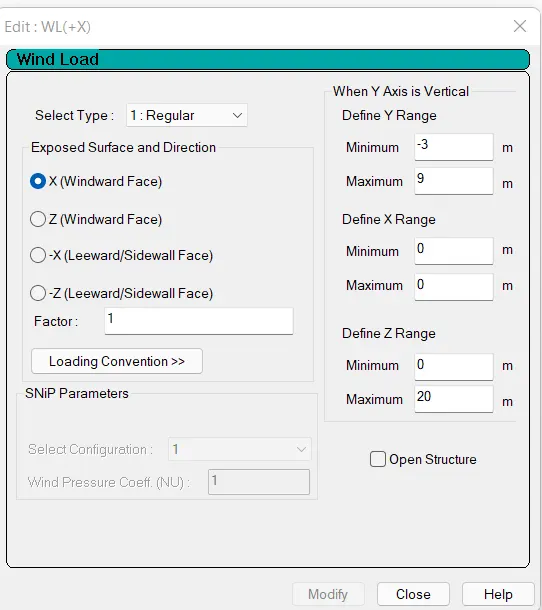
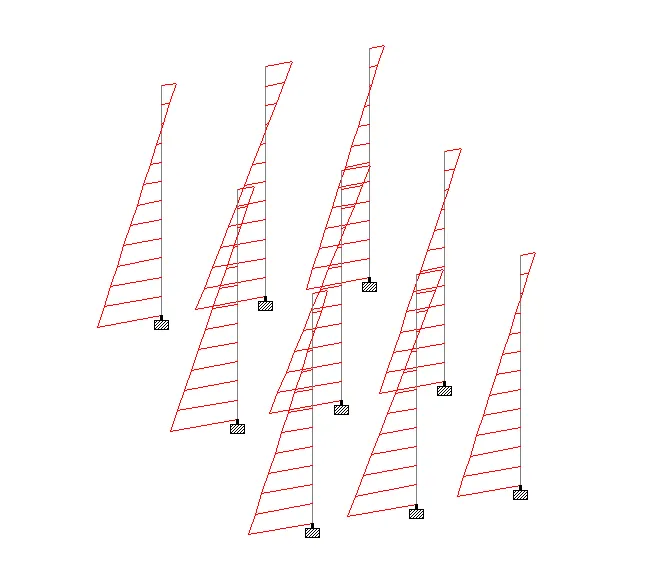
Then 4 wind load cases were generated i.e wind load in +ve X and -ve X direction, wind load in +ve Z and -ve Z direction.
It can be noted that the Pier starts from -3 m up to 9 m in Y-direction.
The 4 load cases generated are shown below.
WL(+X)
WL(-X)
WL(+Z)
WL(-Z)
ANALYSIS AND RESULTS
The result of the analysis due to the application of wind load is summarised below for each component of the bridge.
PIER:
(Bending Moment diagram (Mz) for load case WL(+X))
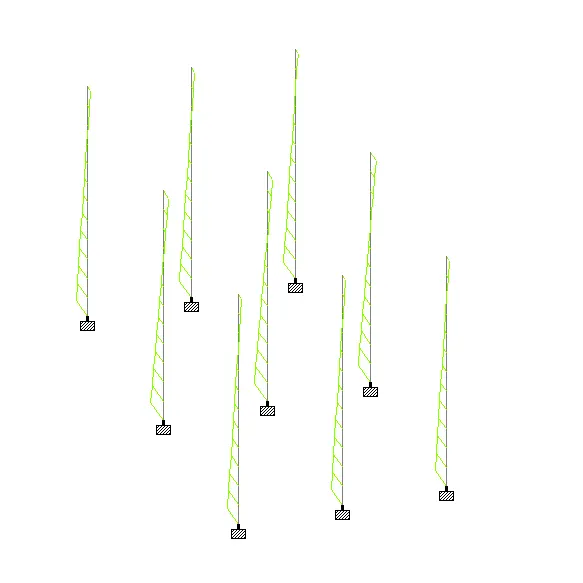
(Bending Moment diagram (My) for load case WL(+Z))
Maximum Bending Moment Observed (My) = 168.488 kN.m for load case (WL(+Z) & WL( -Z))
Maximum Bending Moment Observed (Mz) = 345.740 kN.m for load case (WL(+X) & WL(-X))
Maximum Axial Force observed = 31.083 for load case (WL(+X))
MAIN GIRDER:
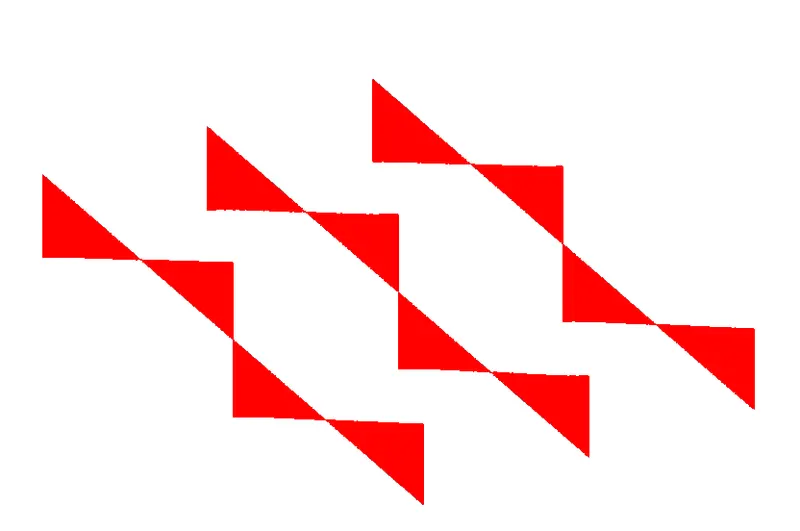
(Bending Moment diagram (Mz) for load case WL(+Z))
Maximum bending moment observed (Mz) = 37.762 kN.m (Span moment) & 36.819 kN.m (Support Moment)
Maximum shear force observed = 7.893 kN
CROSS GIRDER:
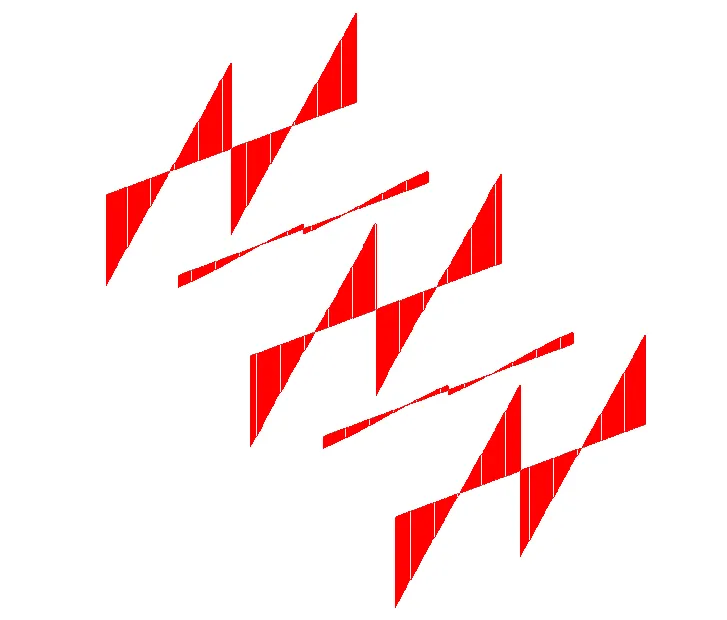
(Bending Moment diagram (Mz) for load case WL(+X))
Maximum bending moment observed (Mz) = 61.428 kN.m (Span moment) & 60.7 kN.m (Support Moment)
Maximum shear force observed = 24.538 kN
BRIDGE DECK:
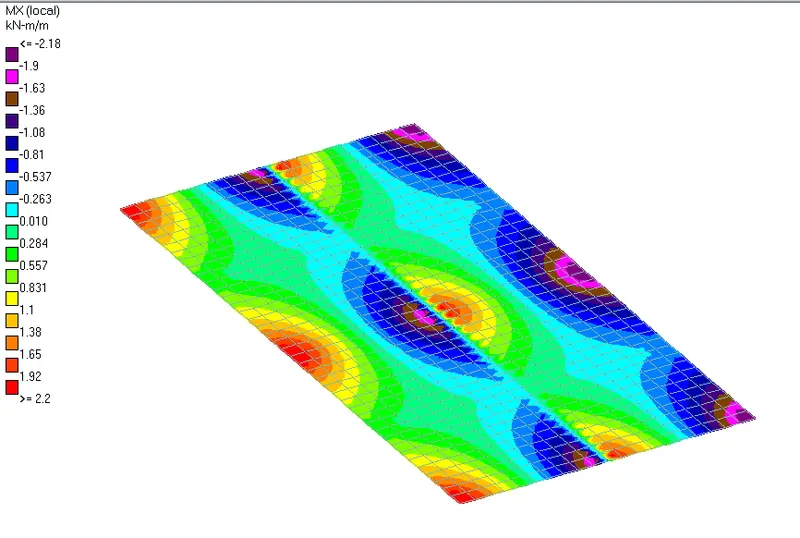
(Bending Moment (Mx) Contour for load case WL(+X))
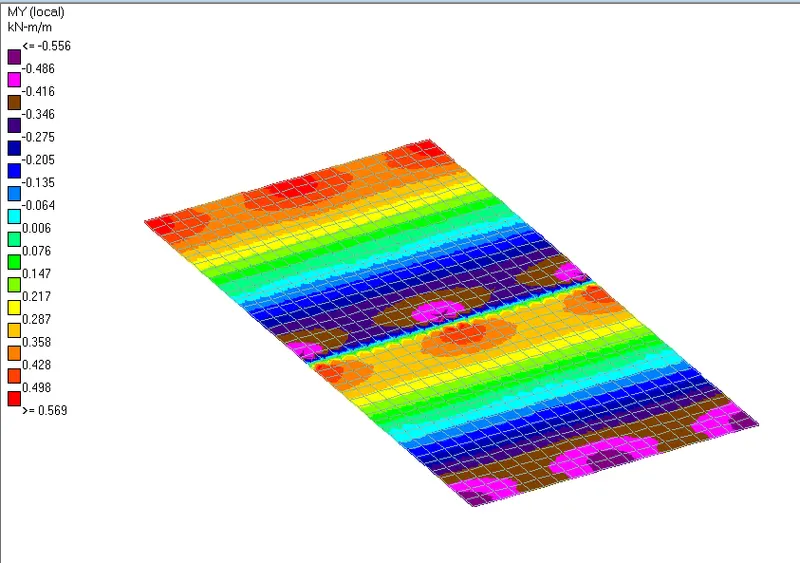
(Bending Moment (My) Contour for load case WL(+Z))
Maximum Bending moment observed (Mx) = 2.198 kN.m
Maximum Bending moment observed (My) = 2.198 kN.m