Battery characteristics using drive cycle
Battery Characteristics using drive cycle
Aim:
Simulating the charge-discharge of the generic battery model using UDDS data on Simulink.
Procedure:
1. For the model, we need the data of the UDDS drive cycle. The drive cycle data is of velocity against a given time. But we need to provide the input as the current. The blocks do not understand by themselves if the input value is current or velocity. In order to do that we, need to calculate the current requirement at every speed at a given time. The following is the Excel file that has the UDDS velocity data converted into the current requirement;
https://docs.google.com/spreadsheets/d/1hMUAoA1XfocKDA6JSXOUJT1MLxYsD7ppMdc-cjURv10/edit?usp=sharing
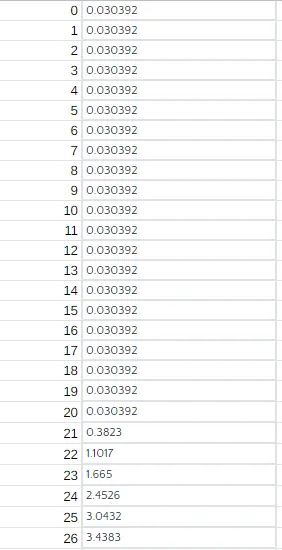
Fig: UDDS Cycle Current Profile
Battery Model:
For the battery model, the following are the blocks used in the Simulink environment;
| Sr No. | Block Used | Purpose |
| 01. | Battery | To provide DC supply to the vehicle. |
| 02. | Controlled current sensor | Take the current profile and give it as input to the battery. |
| 03. | Bus Selector | To take the output as SOC, Voltage drop, and current discharge. |
| 04. | Scope | To display results of SOC, Voltage drop, and Current discharge. |
| 05. | Powergui | To assign a continuous solver, to solve the circuit in a variable step fashion. |
| 06. | From Workspace | To take current against given time from workspace |
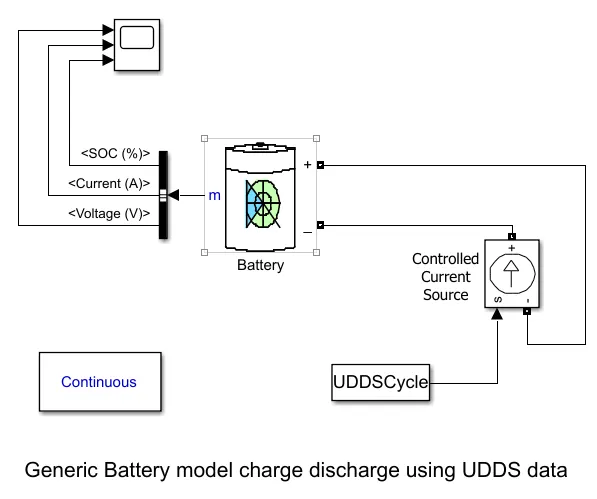
Fig: Generic Battery model to charge-discharge using UDDS data
The UDDS cycle is taken in the current profile form. The input needs to be provided to the battery, the input is provided via a controlled current source. As per the requirement, the battery is discharged. What the battery essentially does is it provides its own status of Voltage, current, and SOC to the bus selector, which further displays the result on Scope. Now for the continuous operation of this model, we need a solver. For this purpose, we have used Continuous powergui, which also essentially means continuous operation. The following are the parameter of the battery;
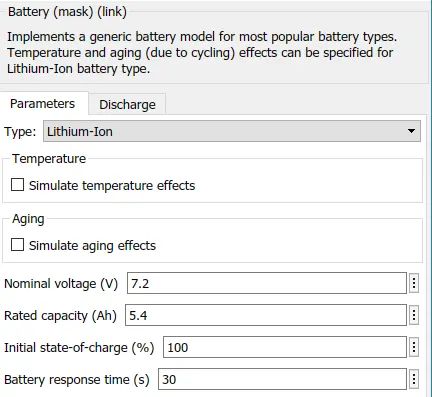
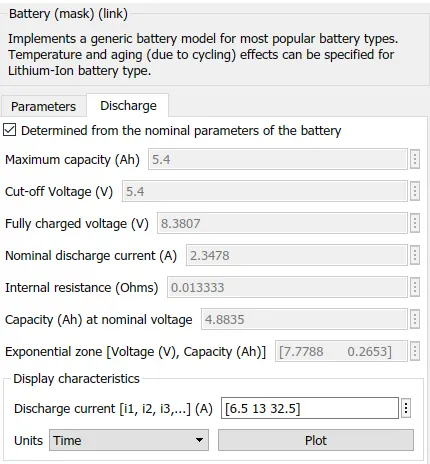
Fig: Lithium-ion battery parameter
We see that the Rated Capacity is 5.4 Ah. That essentially means that when the battery is discharged at a constant current of 5.4 A for an hour, it will be drained completely.
Result:
1. Constant 5.4 A current discharge
For the first test, we kept the constant block with an input of 5.4. The time set was 3600 sec. The result is as below;
0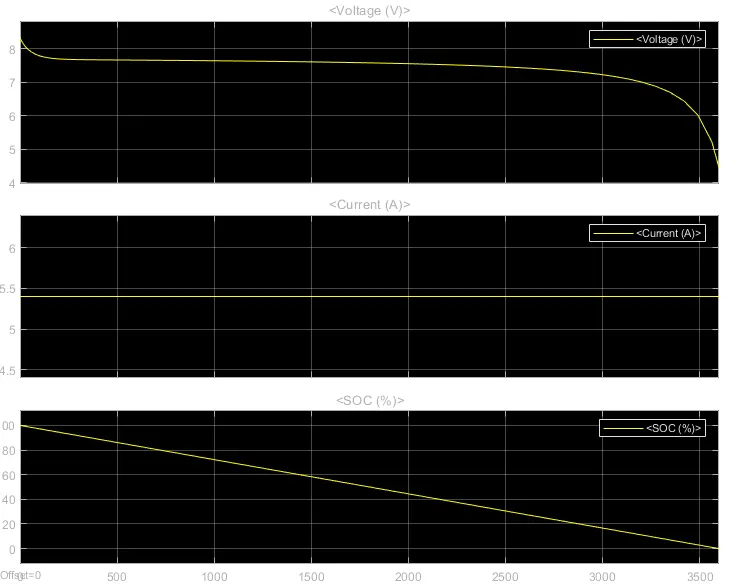
Fig: Result during constant 5 A current demand for 1 Hour
It can be seen that the state of charge goes down to 0, which means the battery is discharged. The current discharge is constant at 5.4 A throughout the cycle. The voltage graph shows the perfect OCV curve on discharging, having exponential area, nominal area as well as the discharge curve.
2. UDDS Cycle
The test has taken the current profile of the UDDS cycle for 1370 sec.
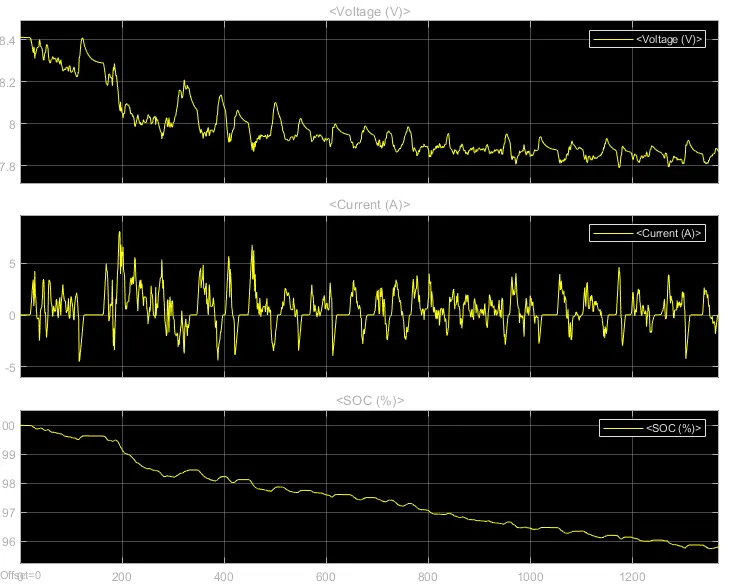
Fig: Result of the UDDS cycle
From the onset, it is clear that due to fulfilling the current requirement, the voltage experiences a drop from just over 8.4 V to nearly 7.9 V. The second graph display the current taken out at any given time. The SOC of the battery fell by nearly 6 percent during the same cycle to reach just touch below 96 percent.
Conclusion:
Simulated the charge-discharge of the generic battery model using UDDS data.