Week 4: Project - Transient simulation of flow over a throttle body
#Objective:To setup Transient simulation of flow over a throttle body.(Throttle inside Elbow)
#Introduction:
We are doing Transient simulation for flow over a throttle body,that is, a throttle plate which act like a butterfly valve to control flow of fluid inside Elbow.
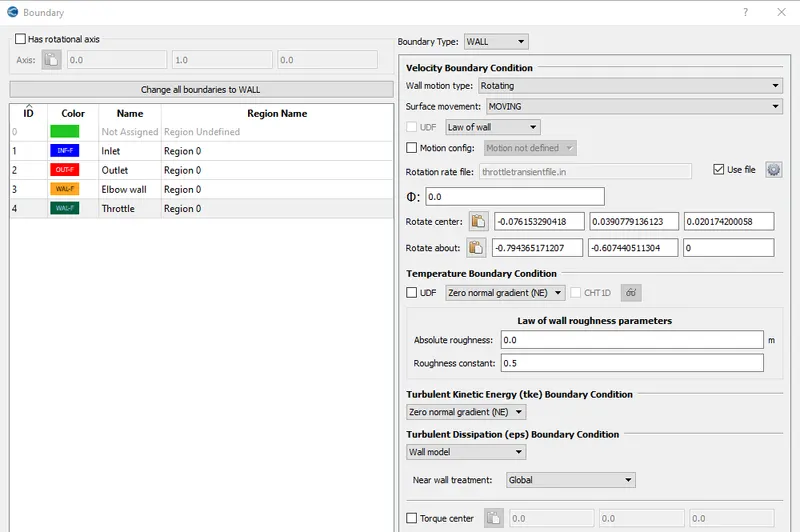
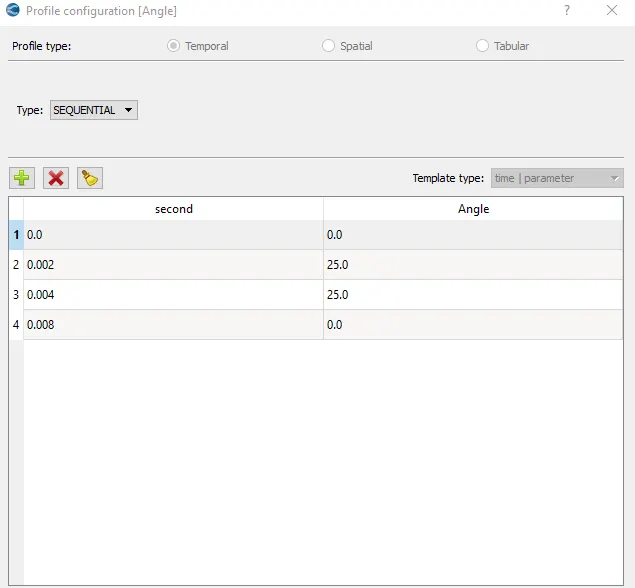
Initially throttle plateis setup in such a position so that it will allow maximum flow inside elbow.Then till 2ms it will rotate by `25^0`.
For 2 to 4 ms ,throttle plate stay in that position and from 4 to 8 ms throttle plate rotate in opposite direction ,reached initial position at 8 ms.
#Geometry:
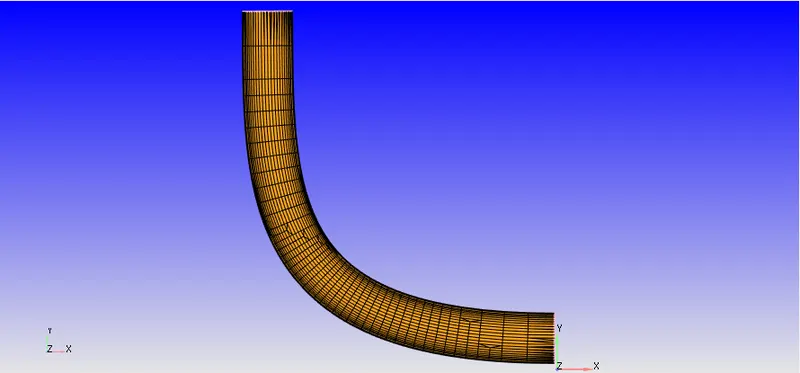
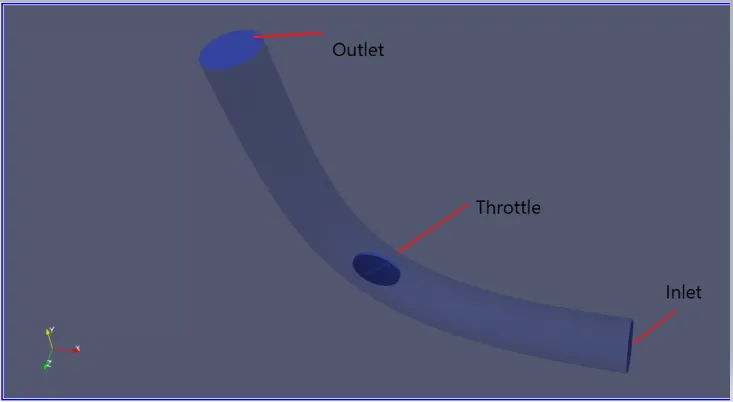
-------------------------------------***********************************-----------------------------
#Calculation of End time for simulation:
Since ,Length or Distance covered by fluid in passing entire elbow from inlet to outlet =0.2 metre.
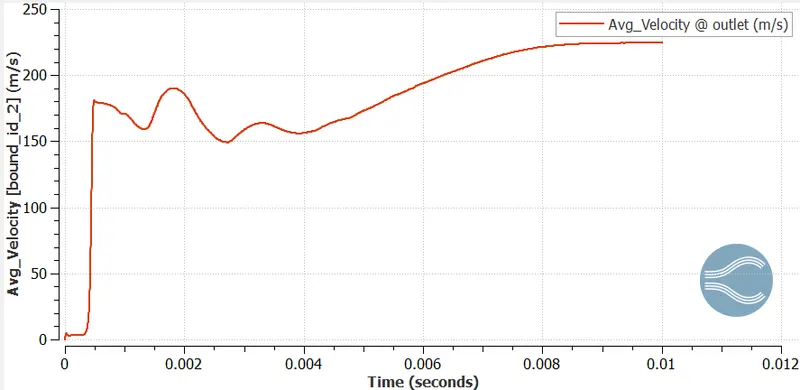
Velocity determined from Steady state simulation (when throttle is in such a position that it allows max fluid to pass through)= 223.59 m/sec.
So, Flow through time =`0.2/223.59` =0.00089 ms
If we take ,Time required for 4 pass(for steady results)= 0.00089*4=0.0036 ms
0.0036 ms would be our End time of Simulation,but in challenge we have to run atleast till 8 ms .
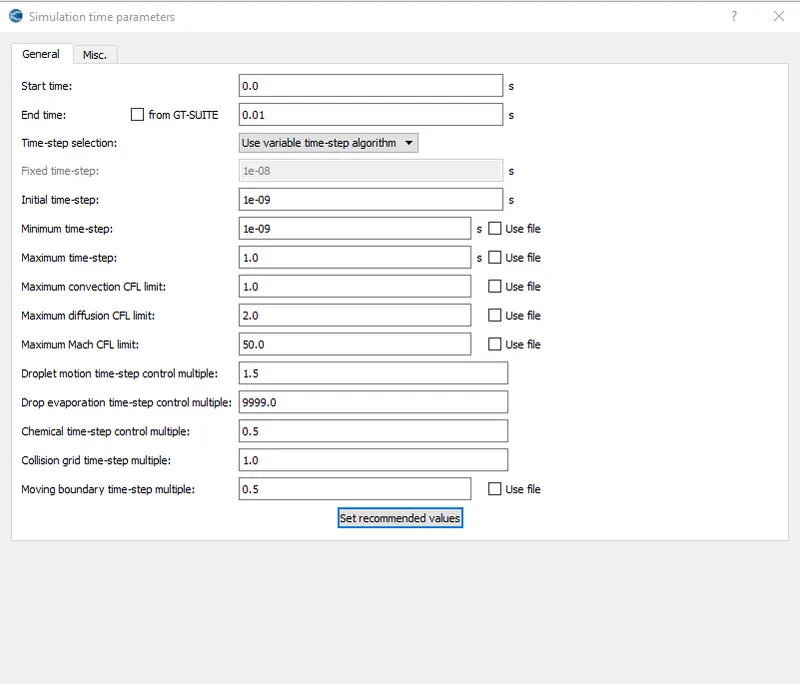
Therefore End time of simulation is 10ms.
-----------------------------------------*****************---------------------------------------------------
#Case Setup:
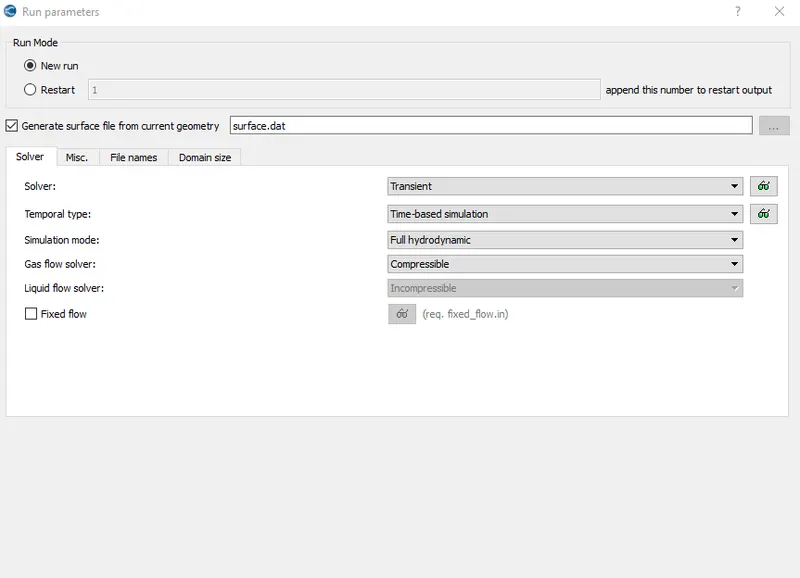
1.Application Type--Time based
2.Materials-Air
Select default setting in:
Gas simulation
Global transport parameter
Reaction Mechanism
3.Simulation parameters
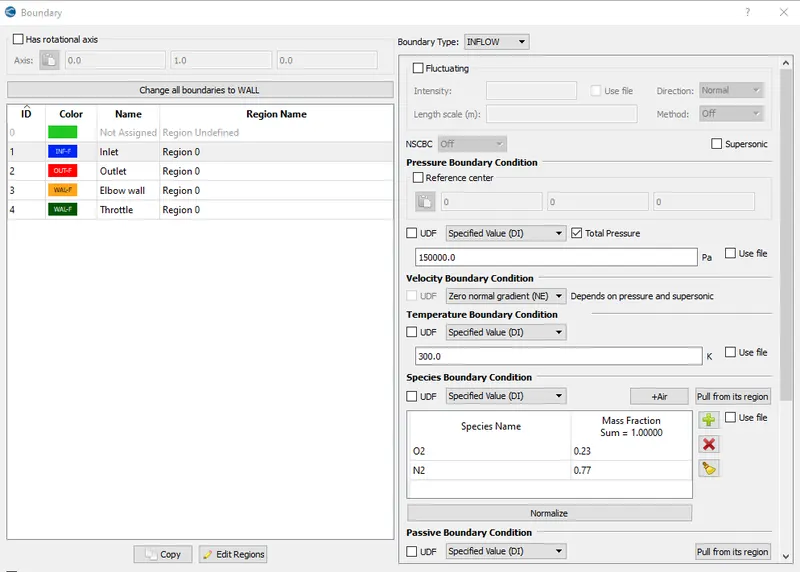
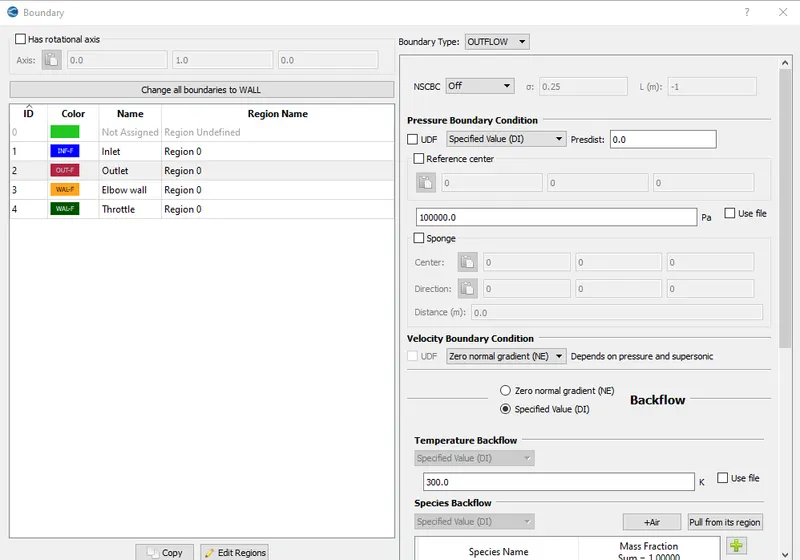
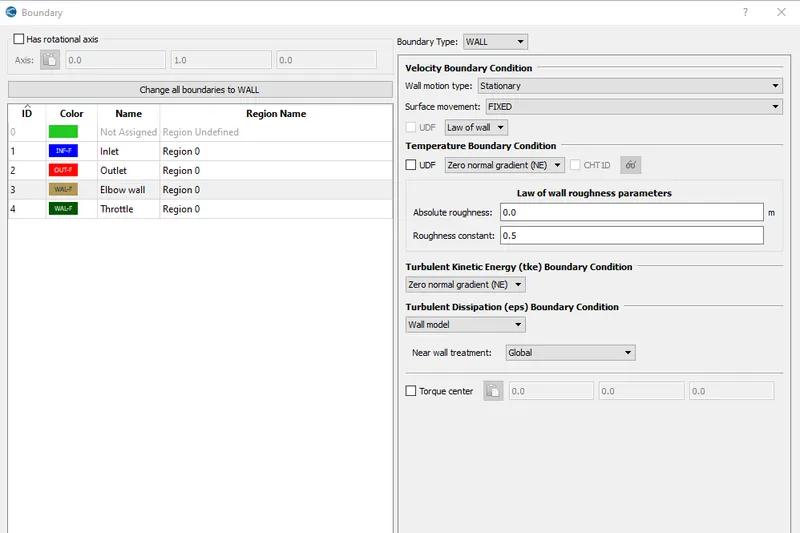
4.Boundary conditions:
5.Initial conditions:No change(default)
6.Physical model:RNG k-`epsilon`
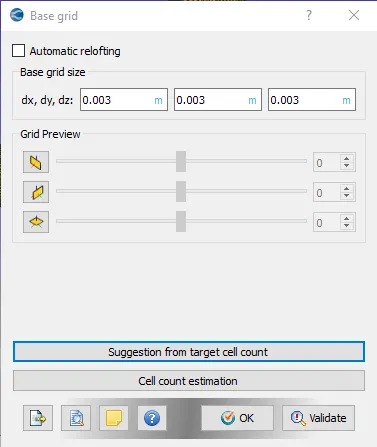
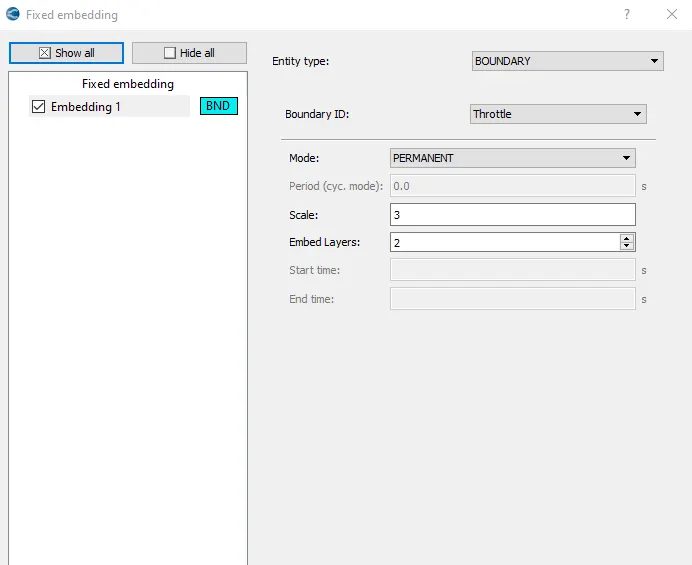
7.Grid control:
8.Output and post processing: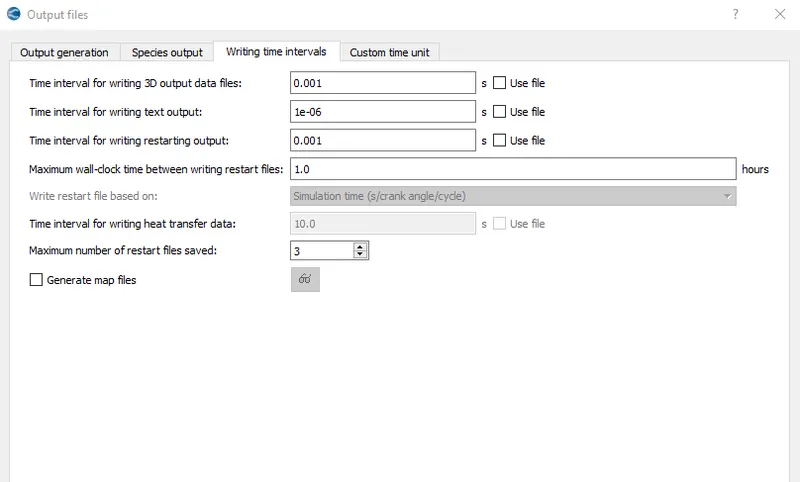
#Mesh:
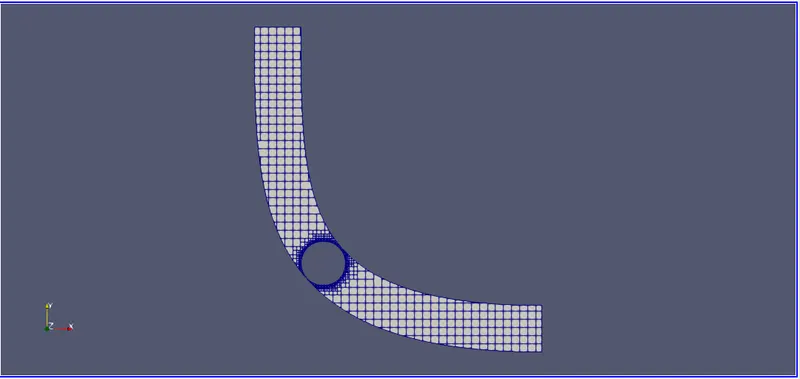
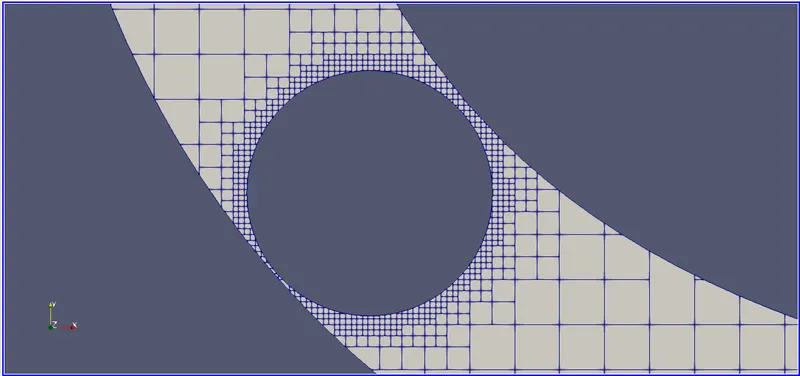
#Results:
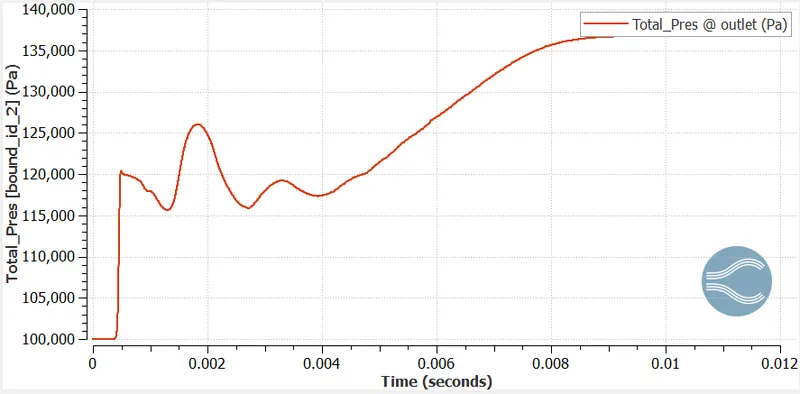
1.Total pressure @ Outlet Line plot:
2.Average velocity @ Outlet Line plot:
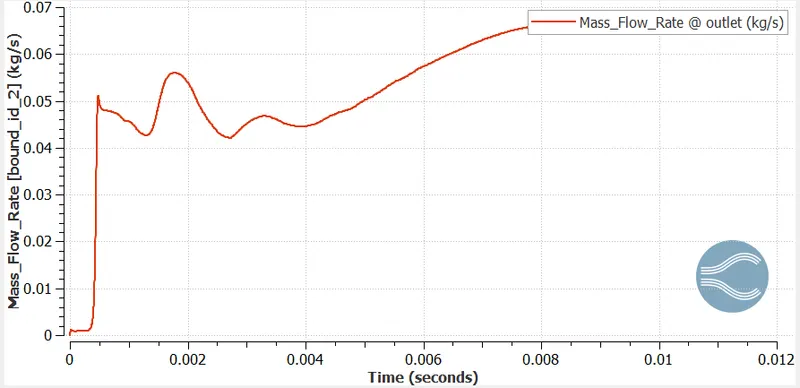
3.Mass flow rate @ outlet:
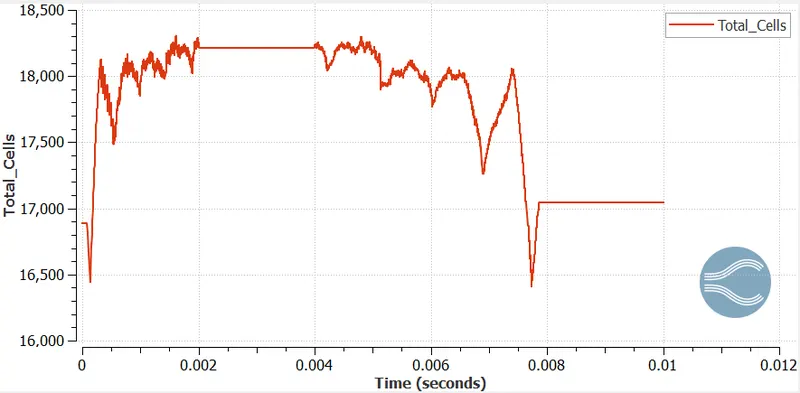
4.Total cells plot:
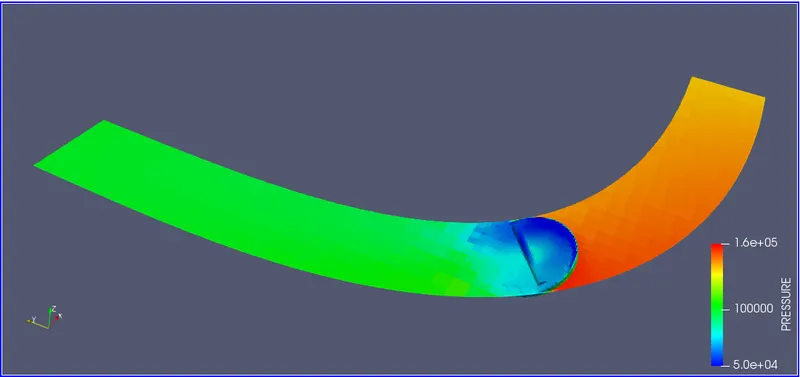
5.Pressure contour plot @ 2 ms (throttle rotated by `25 ^0`) from initial position.
#Pressure plot @ 8 ms (throttle returned to initial position):
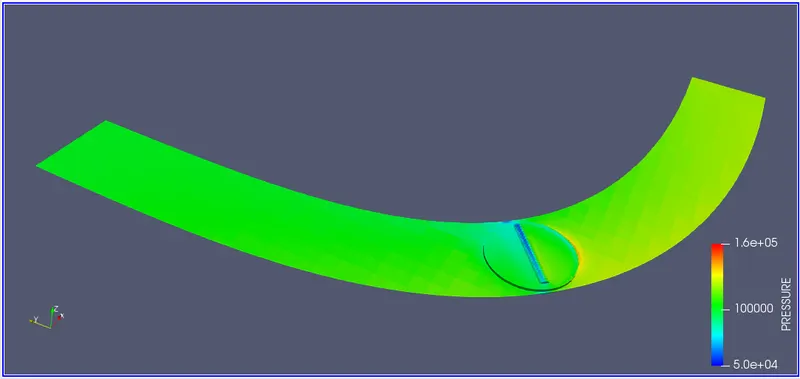
From the above two pressure plots we can conclude that as throttle rotated from initial position ,it will offer more resistance to flow therefore Pressure drop would be more.
6.Velocity contour plot @ 2 ms (throttle rotated by `25 ^0`) from initial position.
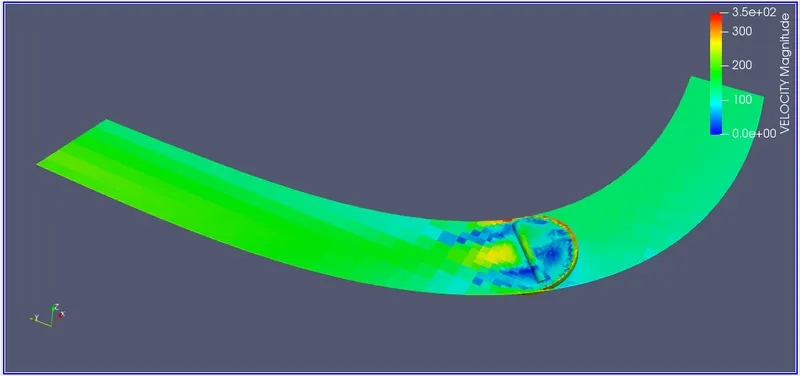
Above plot showed that as pressure is more near inlet as throttle is obstructing the flow,velocity near inlet is less.
#Velocity plot @ 8 ms (throttle returned to initial position):
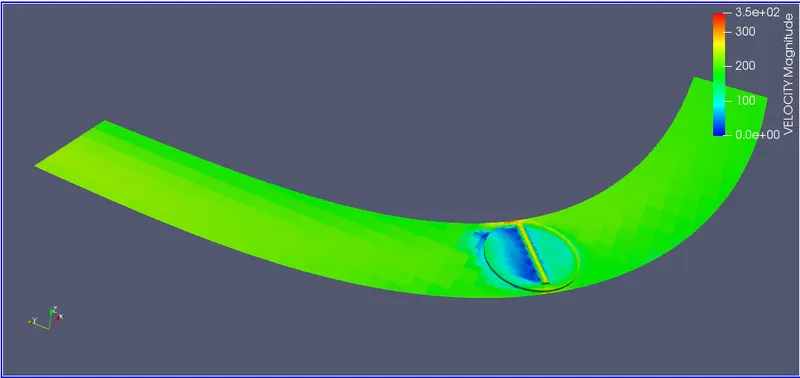
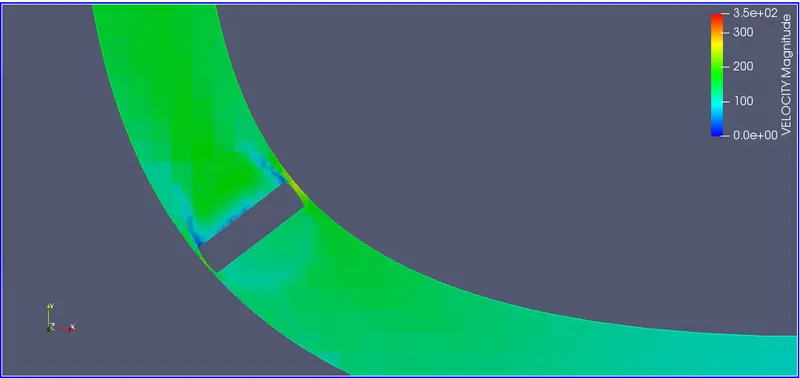
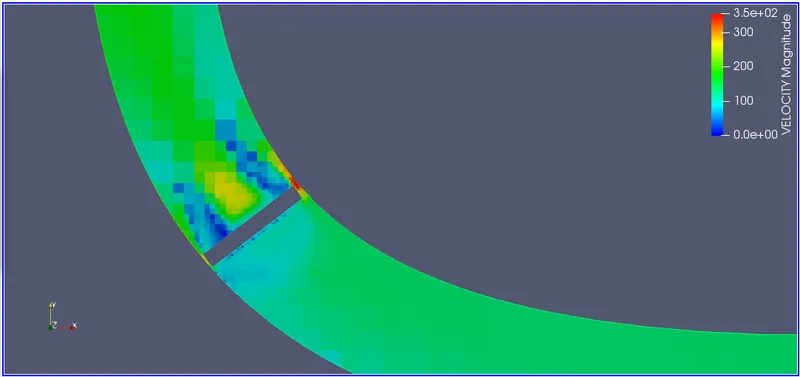
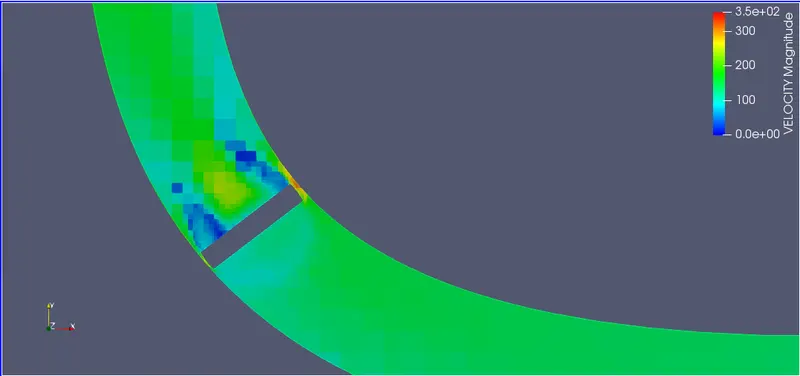
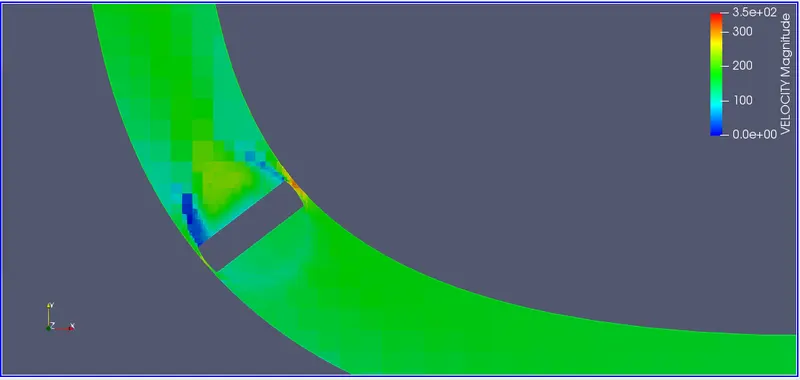
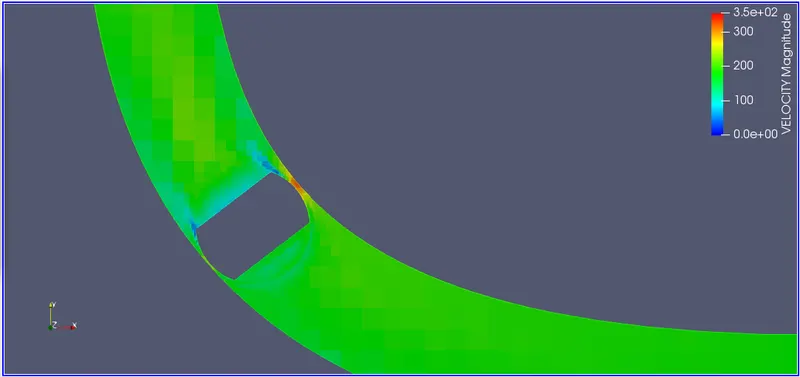
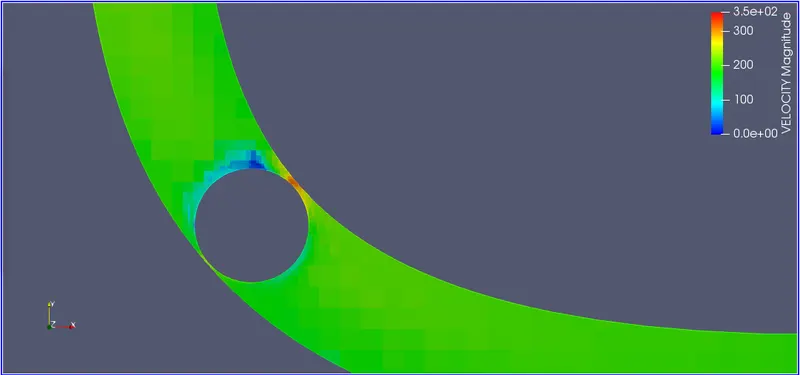
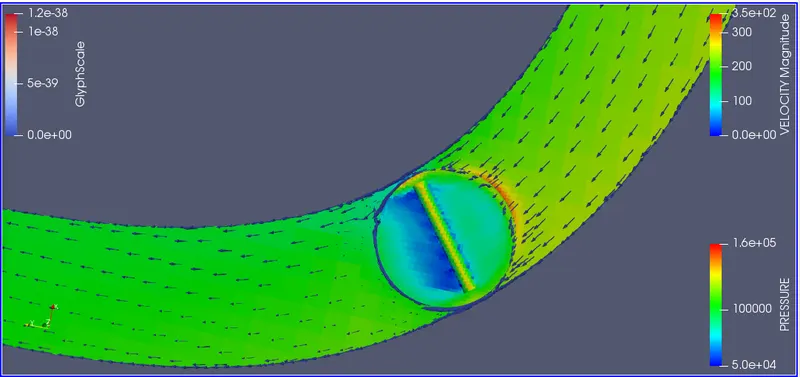
#Below contour shows change in velocity and Mesh with rotation of throttle.
#Velocity contour plot with vector:
#Links to video:
#Outcomes:
1.From the above Pressure and Velocity plots we can see that,when the throttle plate is in rotated position i.e. `25^0` from initial position,Pressure drop is high and velocity near inlet is less.
2.As throttle plate is at `25^0`,mass flow rate is reduced.Then as throttle plate come back to initial position ,Mass flow rate increased and Pressure drop reduced.