Week 4: Project - Steady state simulation of flow over a throttle body
Aim: Steady-state simulation for flow through an elbow joint containing a throttle valve.
Introduction and Theory: A throttle is a mechanism by which fluid flow is managed by constriction or obstruction. In a traditional IC engine, the throttle valve is part of the air-intake system, which controls the amount of air sent to the combustion chamber. The throttle valve is connected to a shaft which is connected to the accelerator. So as the driver presses the accelerator pedal the air intake increases, and the engine RPM increases thereby increasing vehicle speed. When the driver releases the accelerator pedal, the air gets essentially choked off, and the engine RPM decreases, thereby slowing the vehicle down.
Importing Geometry:
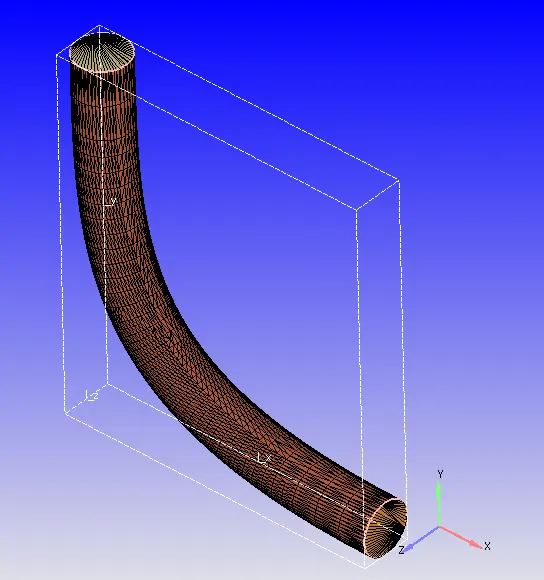
The following geometry was imported into Converge:
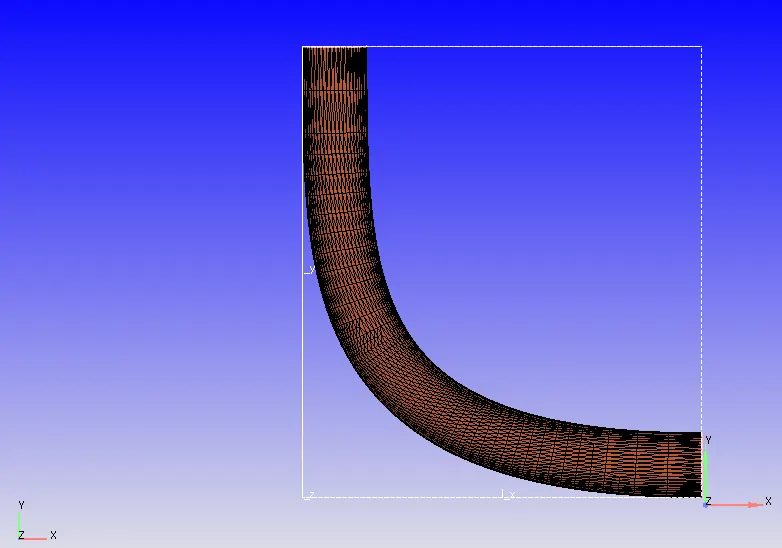
Run a diagnosis check, to make sure the geometry doesn't have any errors.
The elbow initially had a thickness, so the thickness was removed because we are simulating to find out the fluid flow characteristics, not heat transfer.
After importing make sure to change the dimensions to mm.
The open inlet and outlet were repaired using the patch tool.
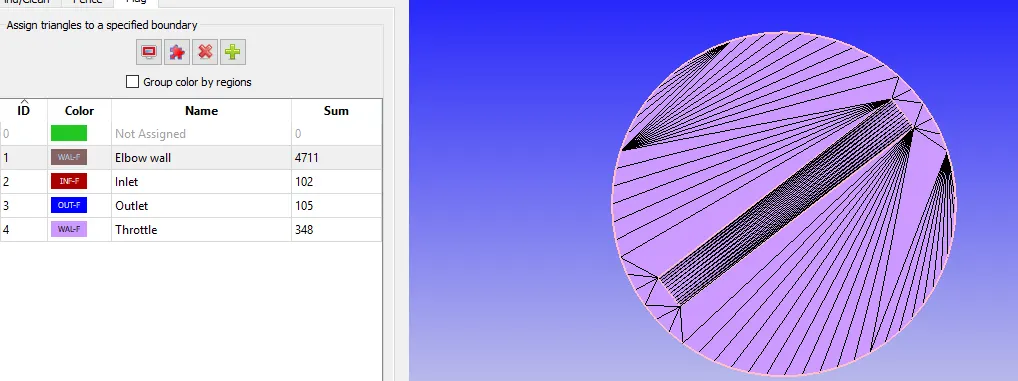
Boundary Flagging:

Case Setup:
1. Application Type: Time-based.
2. Materials
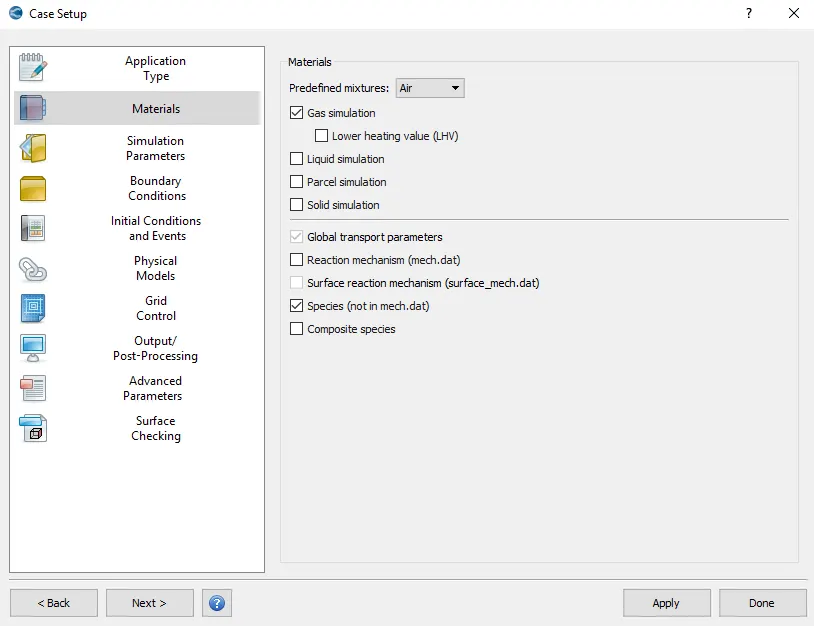
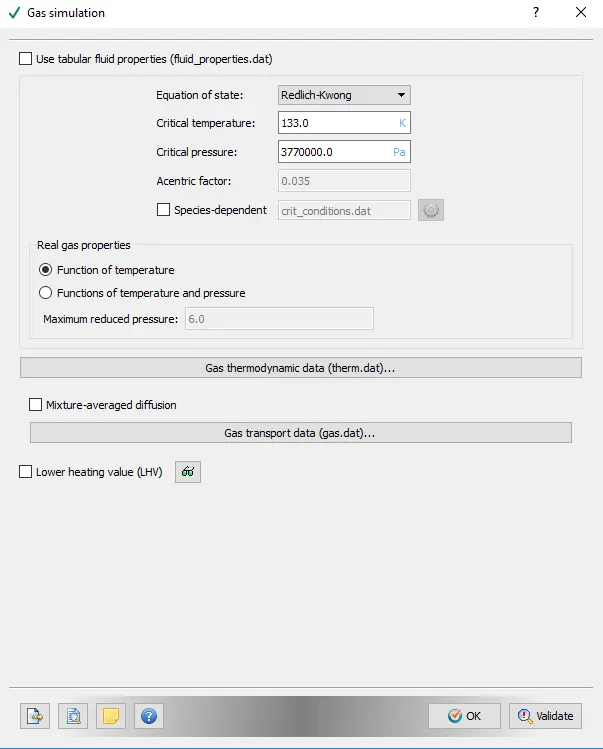
2.1. Gas simulation
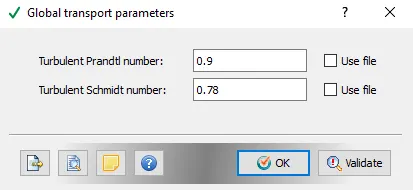
2.2. Global Transport parameters
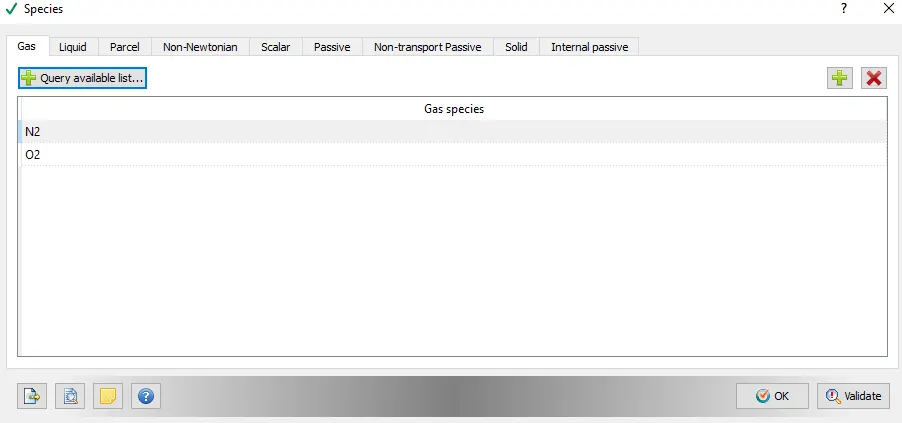
2.3. Species
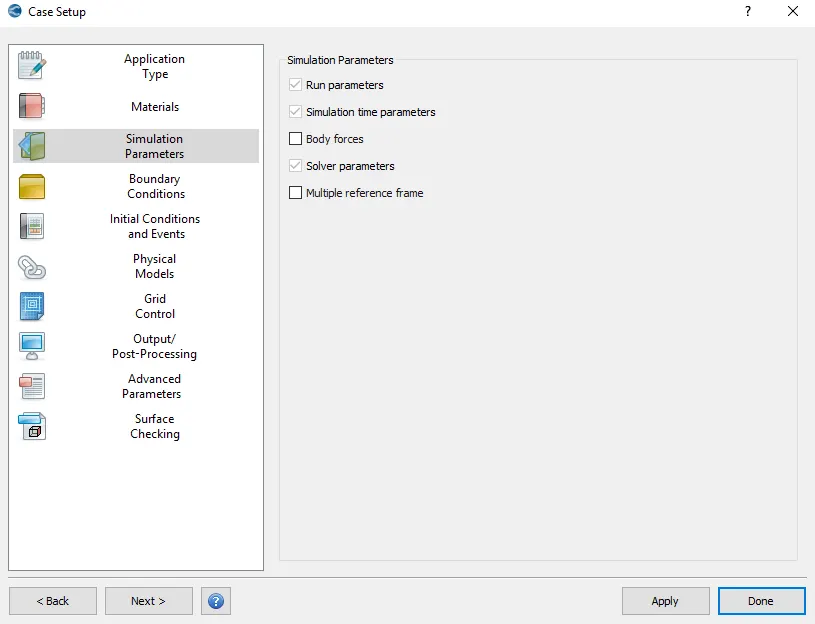
3. Simulation Parameters
3.1. Run parameters
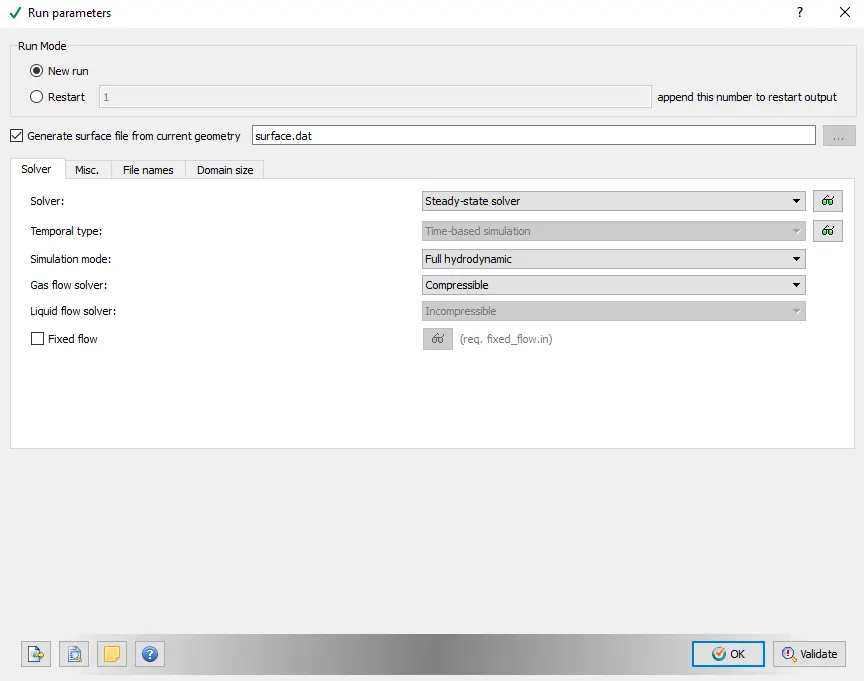
Shared memory was switched off.
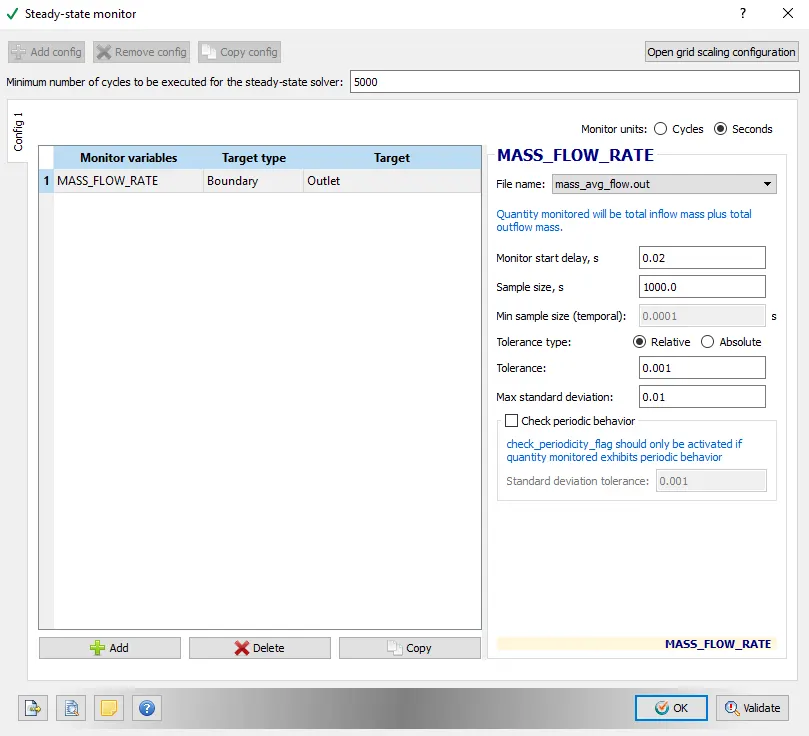
3.1.1. Steady-state monitor
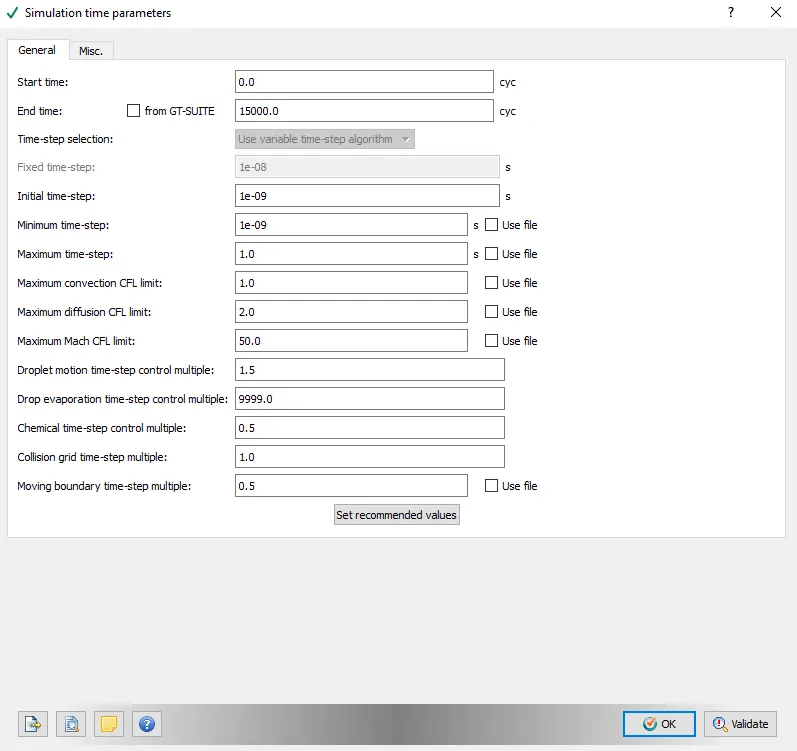
3.2. Simulation time parameters
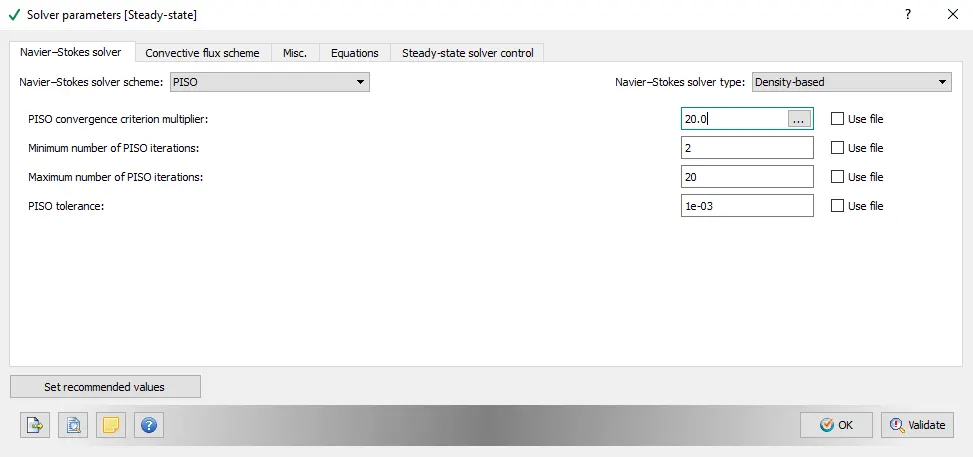
3.3. Solver parameters
4. Boundary Conditions
4.1.Elbow wall
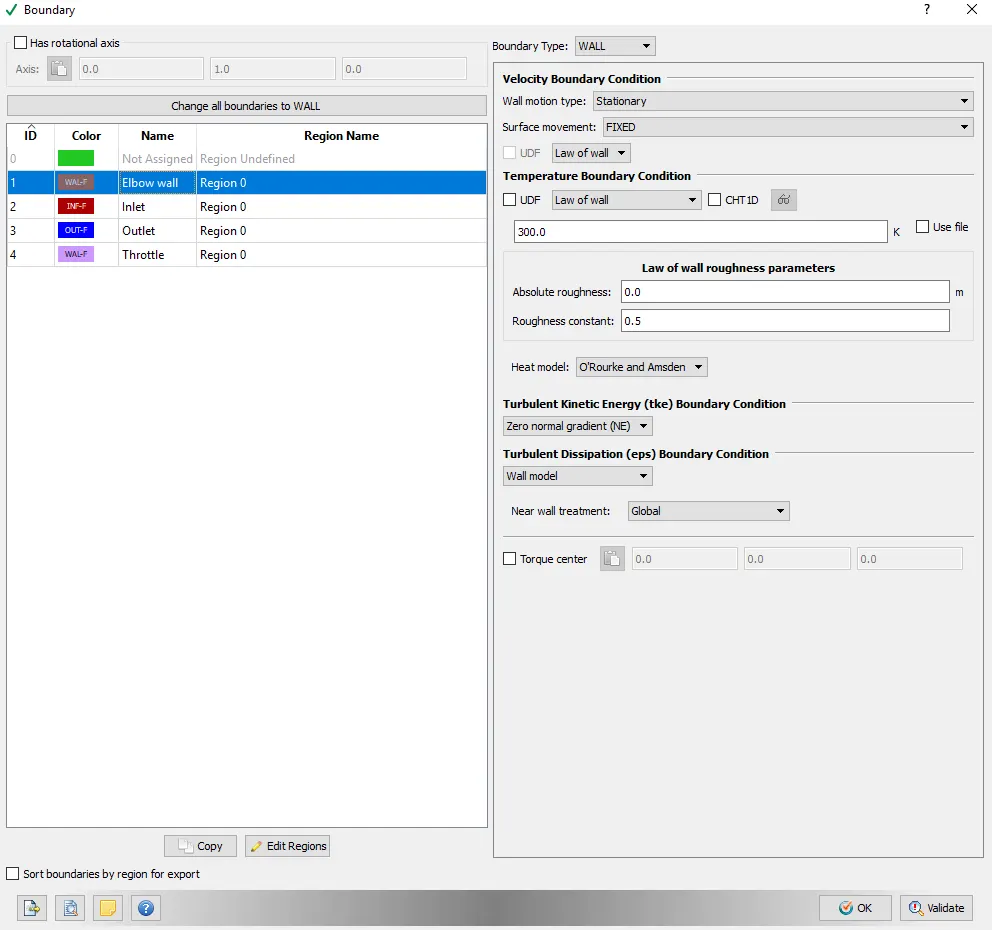
4.2. Inlet
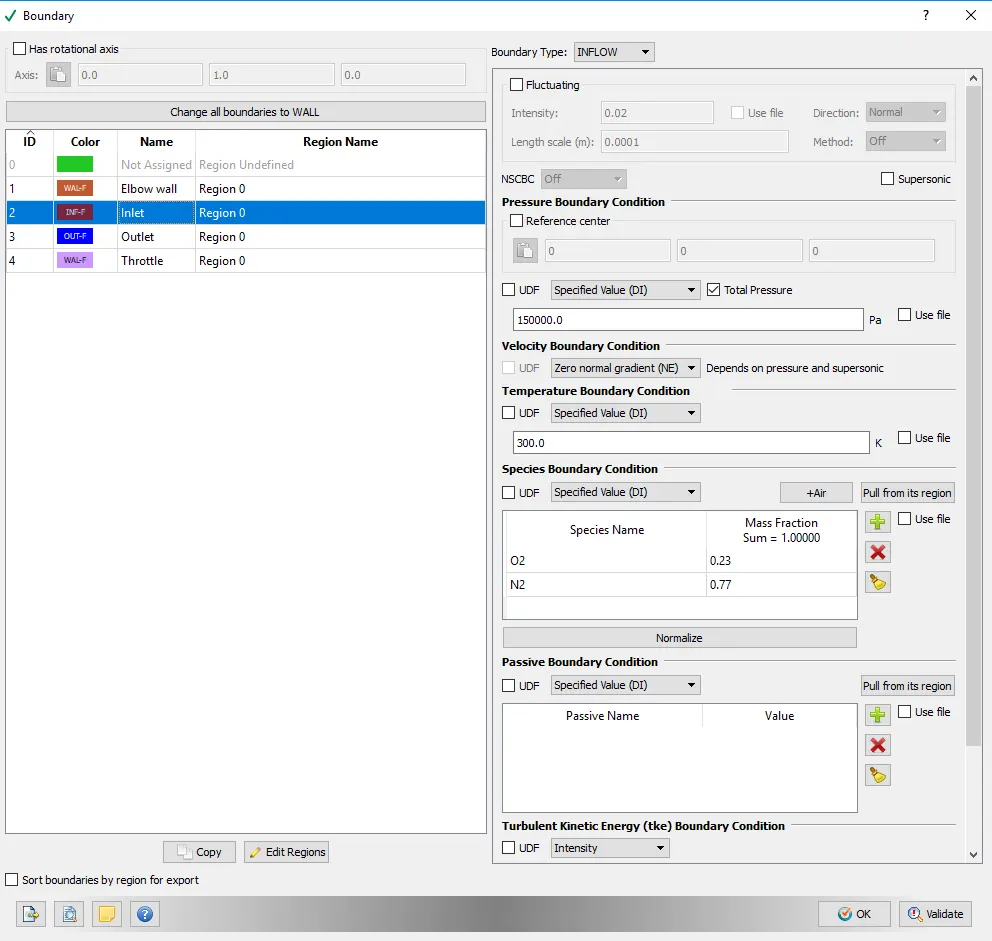
Inlet pressure of 150 KPa.
4.3 Outlet
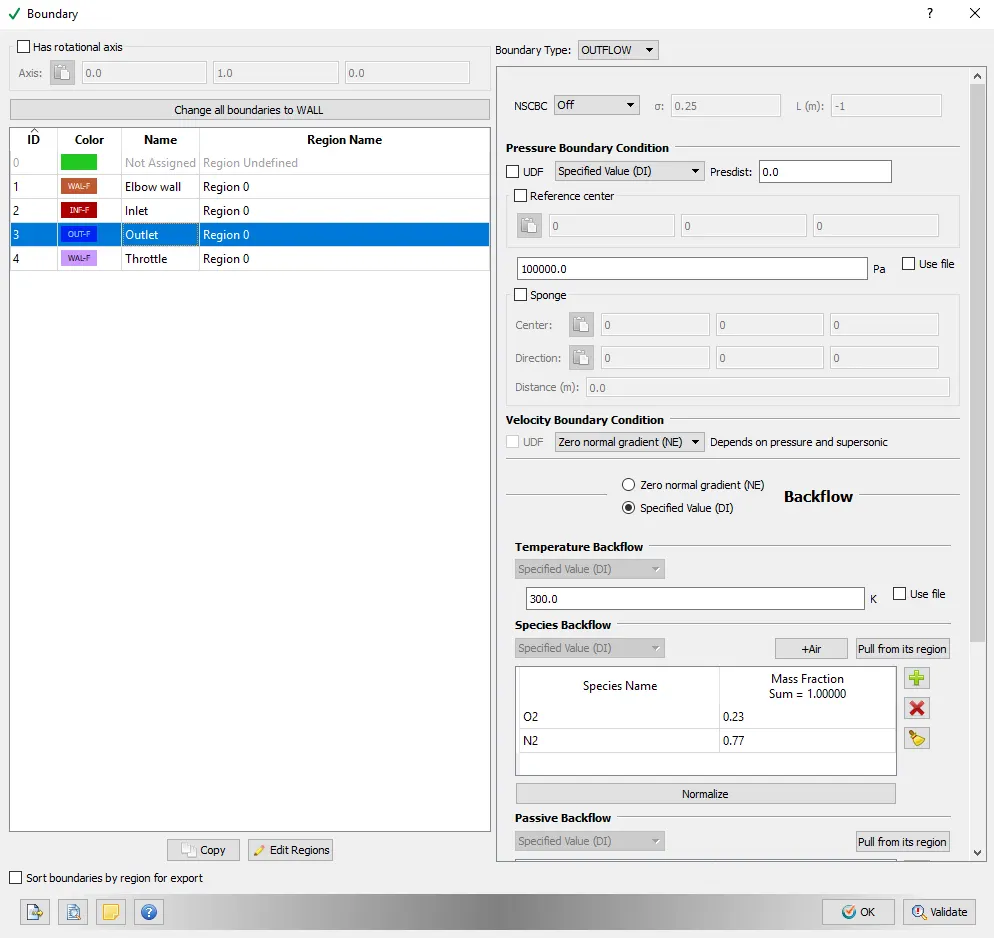
Outlet pressure of 100KPa.
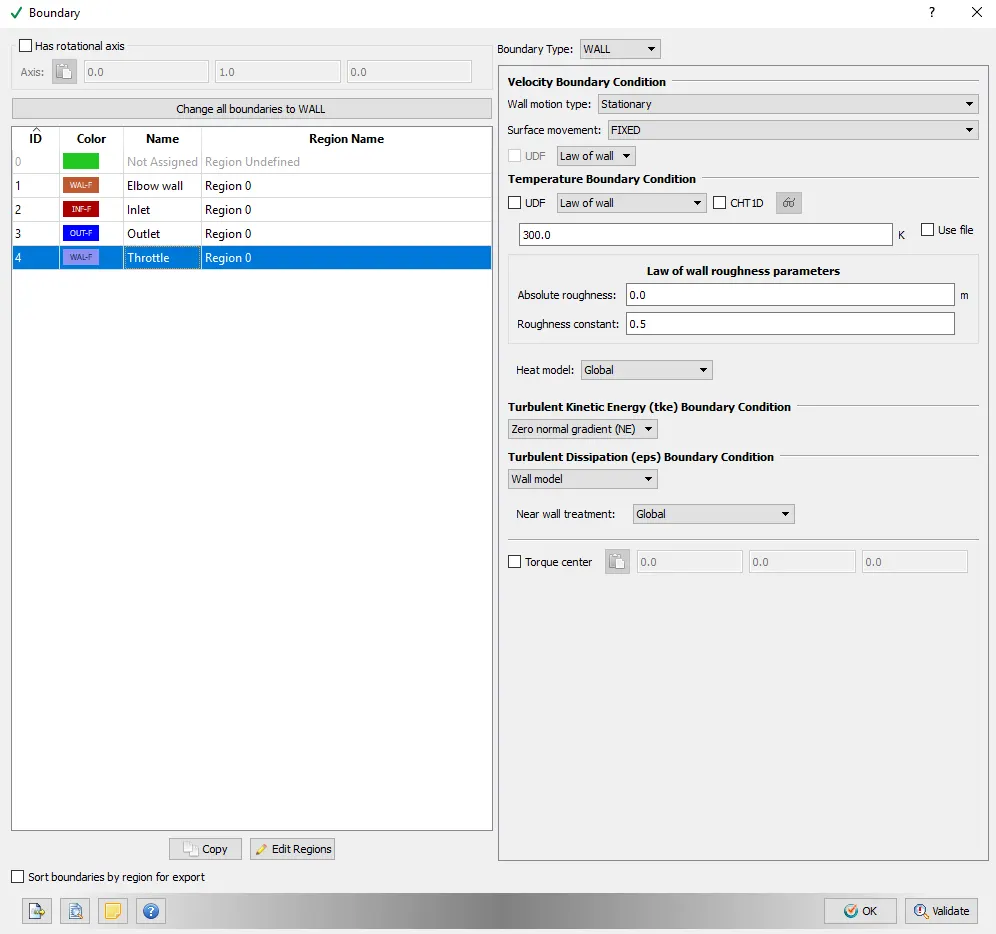
4.4. Throttle
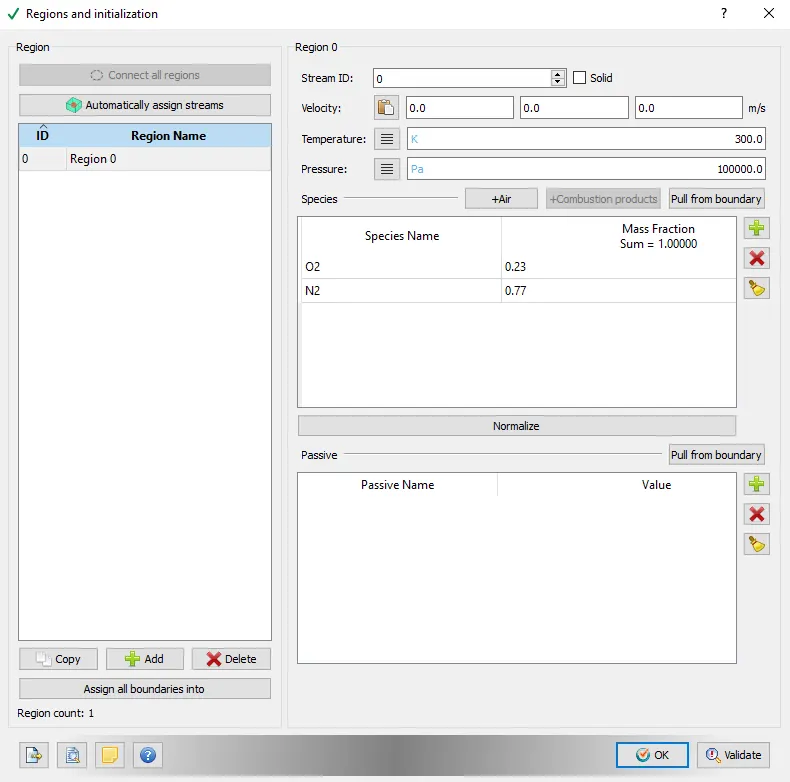
5. Region Initialization
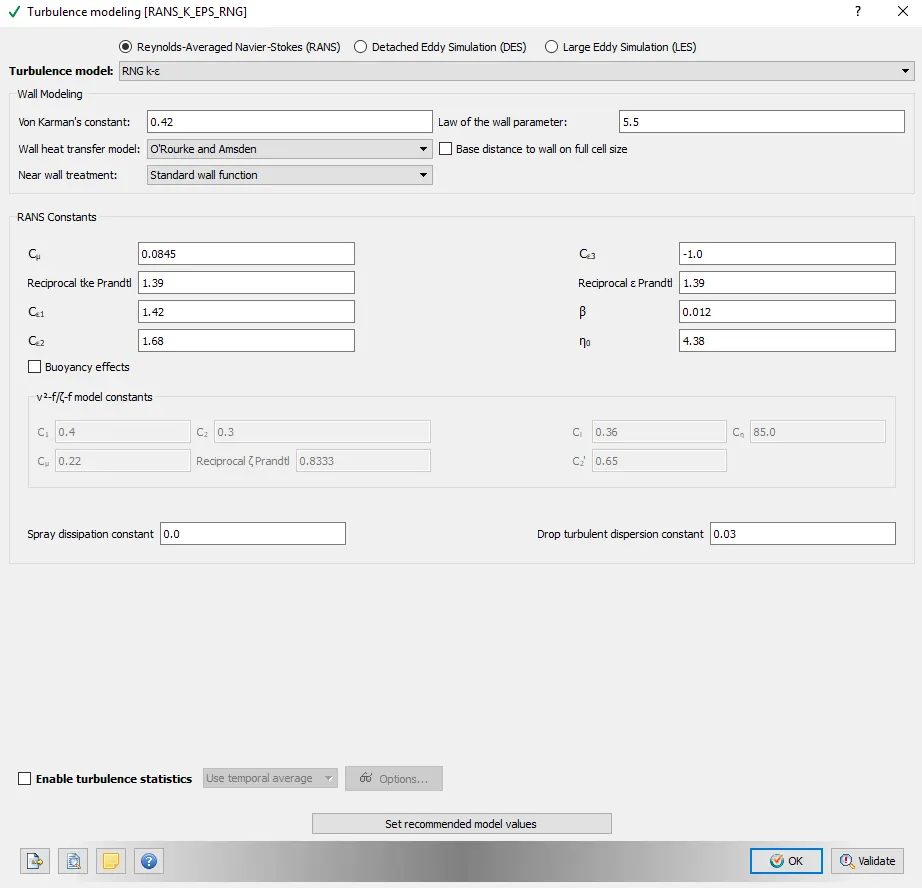
6. Turbulence modeling:
7. Grid Control
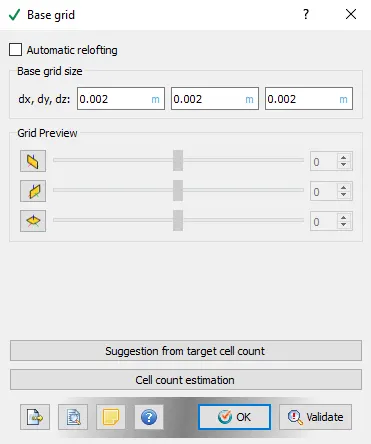
7.1. Base Grid
7.2. Fixed embedding
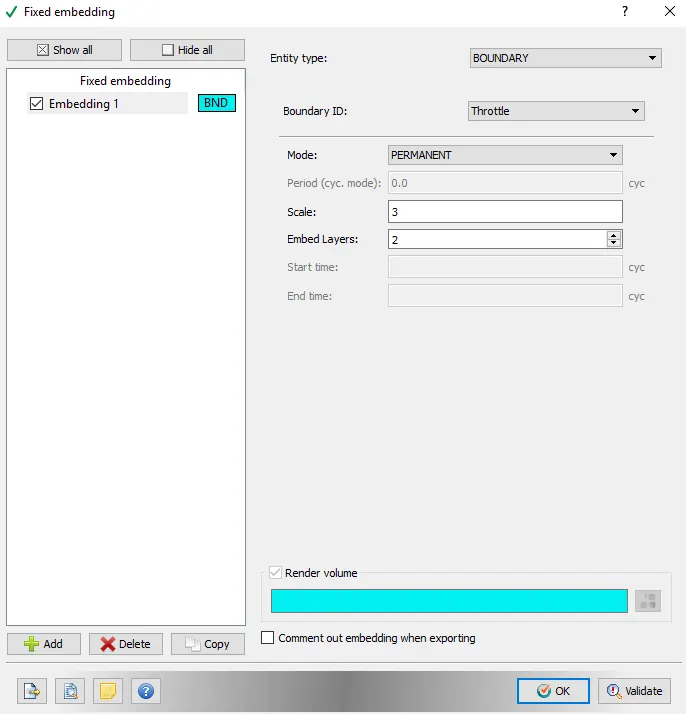
Scale = `dx/2^n` , where n is the scale.
Embed layers decide how far from the body will the refined mesh propagate.
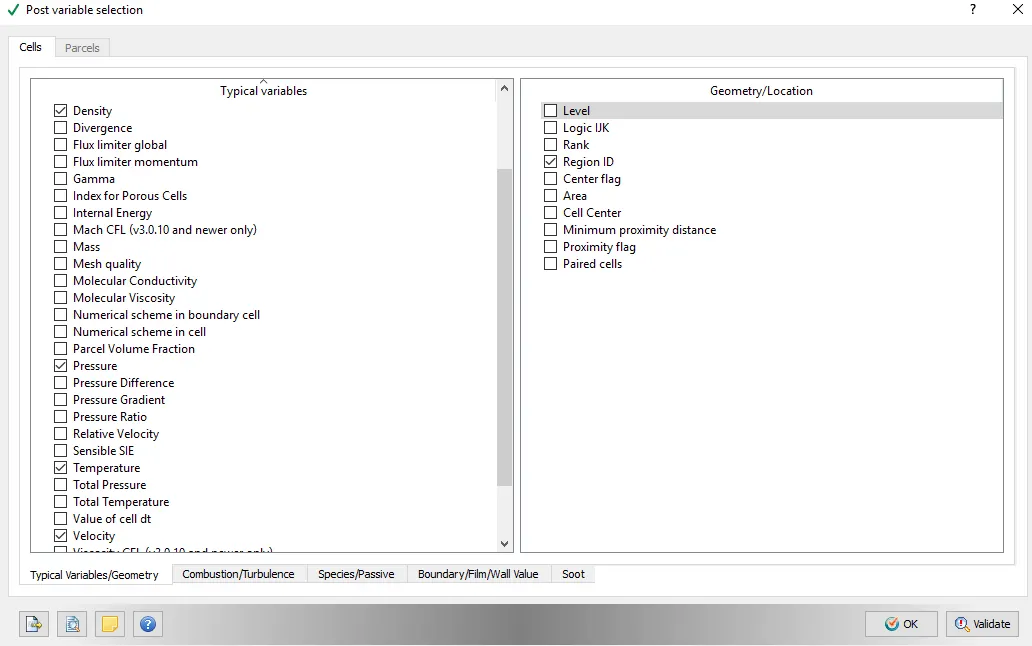
8. Output variables
9. Output files
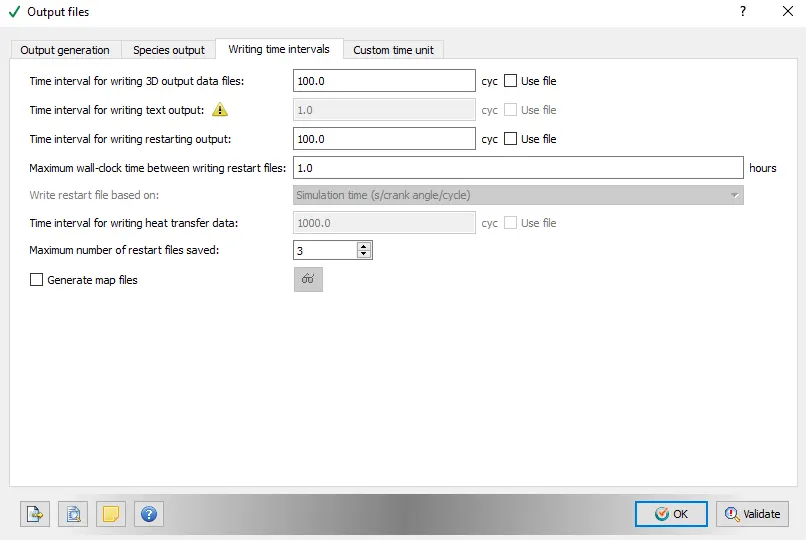
The input files were exported to a file and using Cygwin command line, we used converge-intelmpi solver to run a parallel simulation with 4 processors.
Using the post-processing tools, the output files obtained were converted into Ensight file type which can be then opened by ParaView.
Mesh:
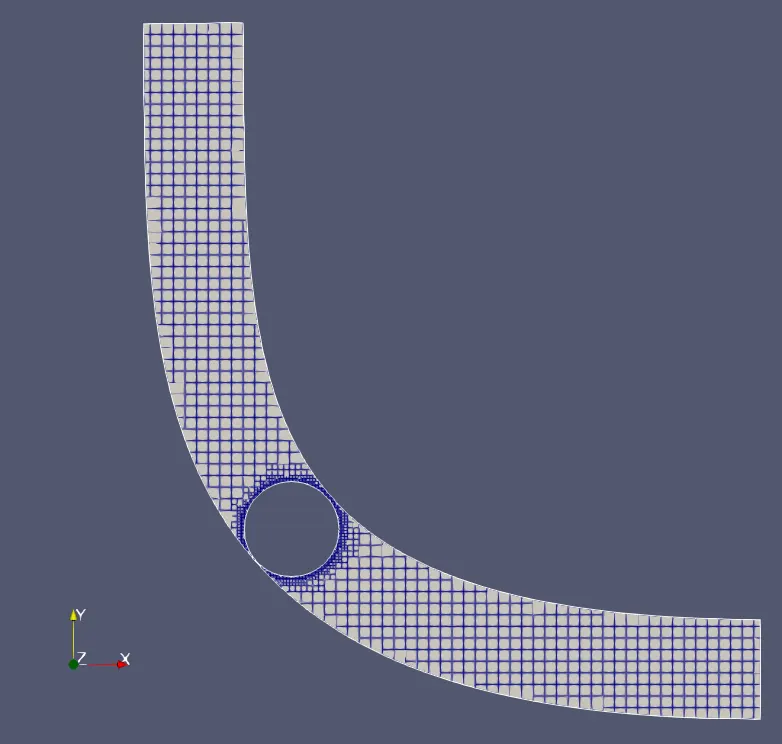
Using fixed embedding at the throttle body, we get a refined mesh in the boundary of the throttle body, allowing us to finely capture the physics around it, which is of importance.
Results:
Contours:
1. Velocity Contour
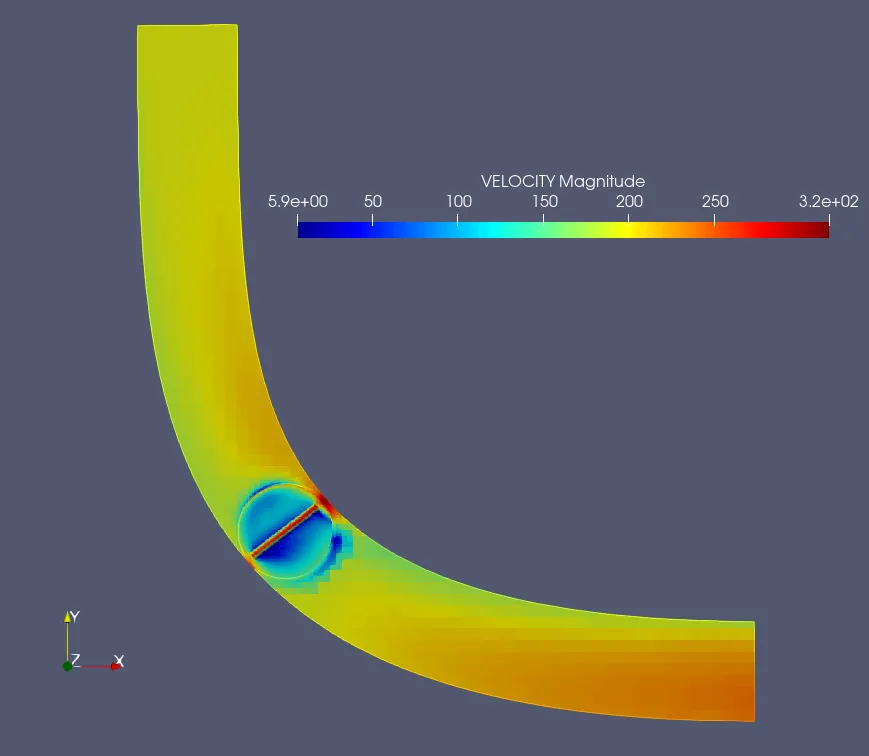
From the velocity contour, we can see that velocity is highest at the top and bottom of the valve, because of the reduction in the area the velocity will increase according to Bernoulli's principle. Also, flow around the valve will be high except for the protrusion part on the valve, which obstructs the flow. The flow front and behind of the valve will be low due to obstruction by the valve and flow separation respectively.
2. Pressure Contour
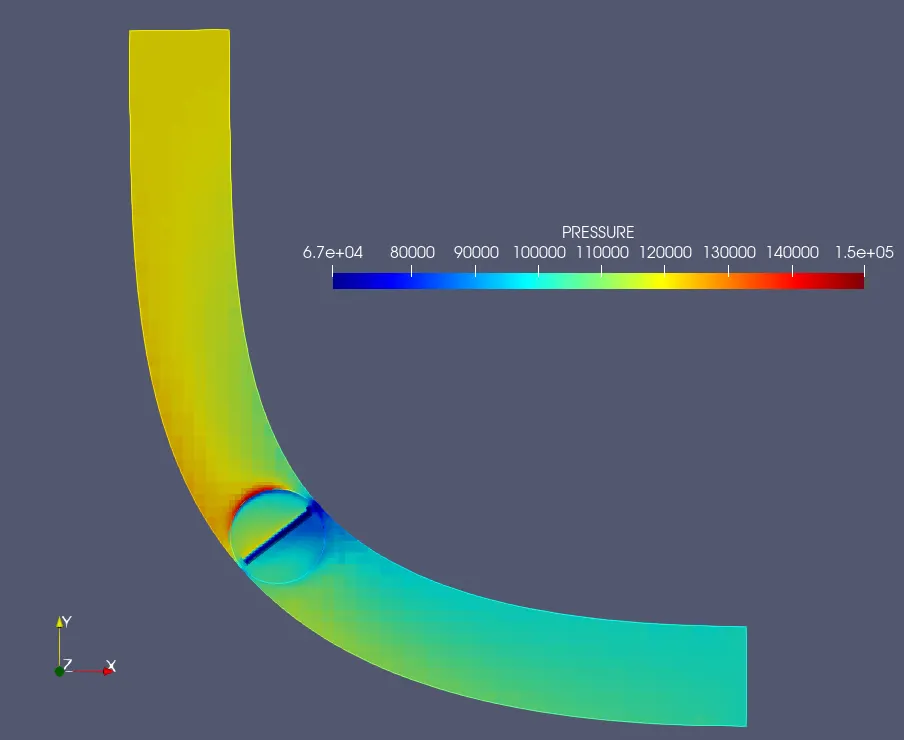
By observing the pressure contour, we can observe that the pressure is highest in the low-velocity regions(such as the front of the valve) and lowest at the high-velocity regions(top and bottom of valve), which is in keeping with Bernoulli's principle.
Plots:
1. Velocity plot
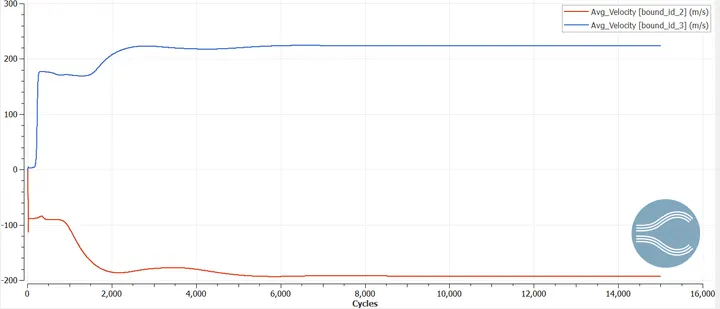
The average velocity at the outlet is 223.956 m/s and at the inlet is -192.918 m/s.
2. Pressure plot
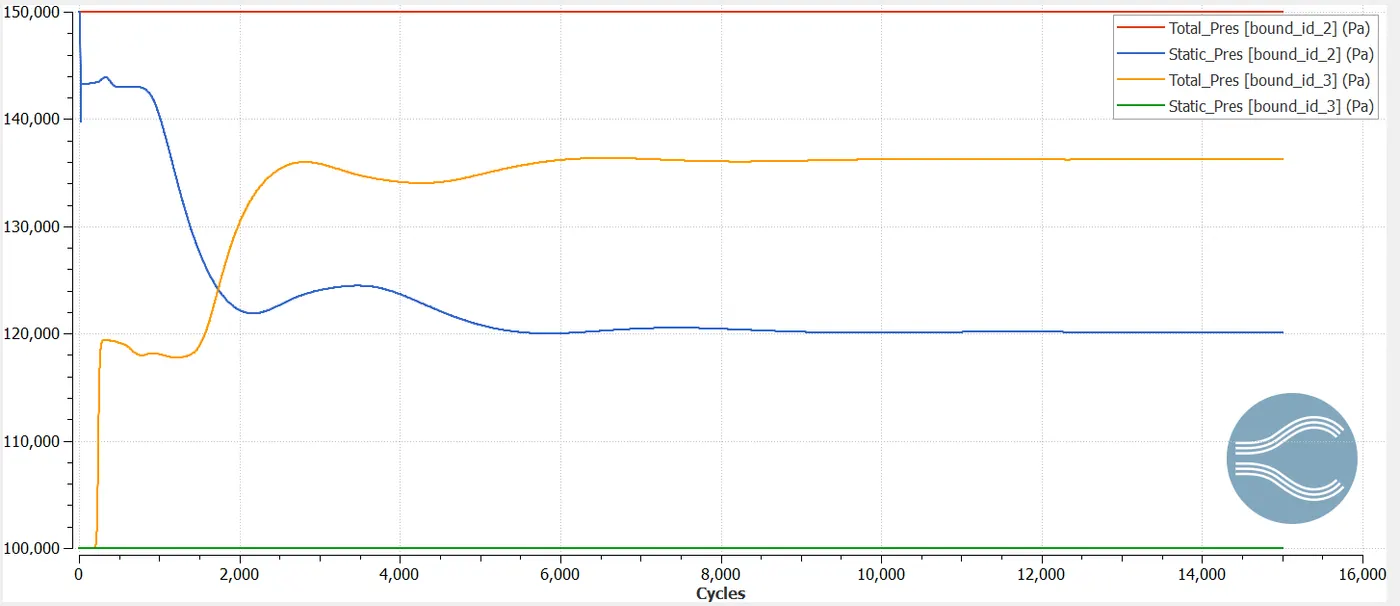
The total pressure at the outlet is 136,242 Pa and static pressure at the inlet is 120,130 Pa. The boundary condition values remain the same throughout.
3. Mass flow rate plot
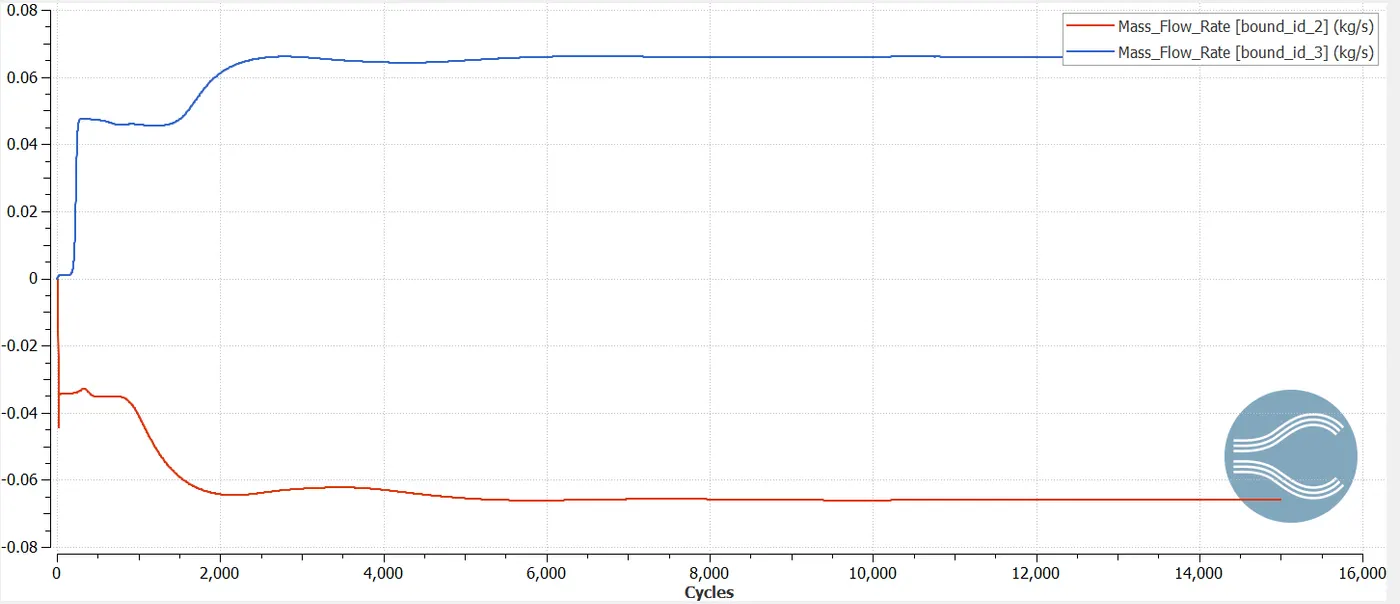
The mass flow rate at the inlet is -0.0660477 kg/s and at the outlet is 0.0660502 kg/s.
4. Cell count
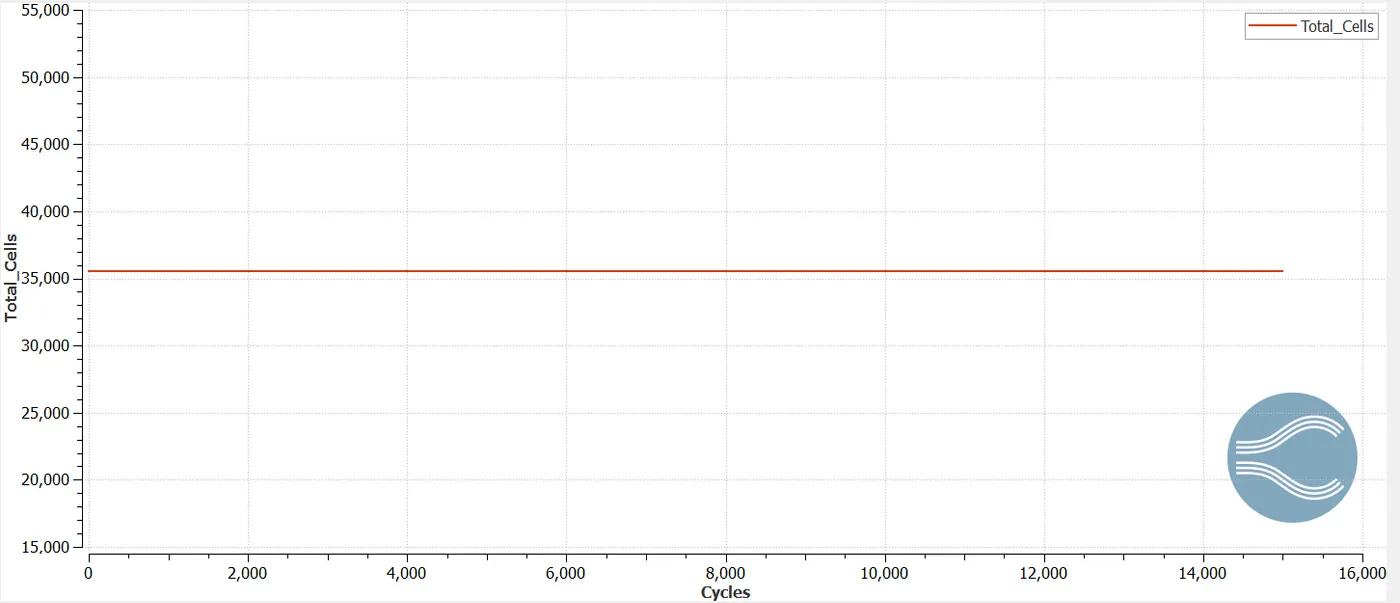
The cell count is 35,518 cells.
Animation:
1. Velocity animation
From velocity animation, we can observe that initially, the entire domain was blue which is the initial condition, but as the iterations are solved, the velocity contour develops. At obstructions or protrusions, the velocity is low, but everywhere else the velocity keeps on increasing as we move downstream, including the top and bottom of the throttle valve.
2. Pressure animation
From pressure animation, we can observe that pressure is highest at stagnation points or points of obstruction such as the front of the throttle valve. In high-velocity regions, naturally, the pressure will be low due to Bernoulli's principle, such as the top and bottom of the valve and downstream of the elbow joint.
Conclusion:
1. Steady-state flow through elbow joint was simulated.
2. The pressure and velocity values close to the throttle valve was captured accurately.
3. From the mass flow rate plot, we can confirm that the mass is conserved, which is in keeping with the law of conservation of mass.