Week 4 - Genetic Algorithm
GENETIC ALGORITHM
AIM:
- To determine the global maxima of stalagmite function using genetic algorithm.
GENETIC ALGORITHM:
- The algorithm naturally selects the fittest individuals for the reproduction of new set of off-springs for next generation.
- In this algorithm, the parents having the better fitness their off-springs also have the better at surviving.
- Five phases are considered in the genetic algorithm:
- Initial population.
- Fitness function.
- selection.
- Cross-over.
- mutation.
INITIAL POPULATION:
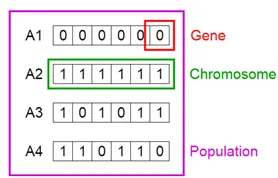
- The process begins with a set of individuals which is called a Population.
- Each individual is a solution to the problem you want to solve.
- An individual is characterized by a set of parameters (variables) known as Genes.
- Genes are joined into a string to form a Chromosome (solution).
- In a genetic algorithm, the set of genes of an individual is represented using a string, in terms of an alphabet.
- Usually, binary values are used (string of 1s and 0s). We say that we encode the genes in a chromosome.
FITNESS FUNCTION:
- The fitness functiondetermines how fit an individual is (the ability of an individual to compete with other individuals). It gives a fitness score to each individual.
- The probability that an individual will be selected for reproduction is based on its fitness score.
SELECTION:
- The idea of selection phase is to select the fittest individuals and let them pass their genes to the next generation.
- Two pairs of individuals (parents) are selected based on their fitness scores. Individuals with high fitness have more chance to be selected for reproduction.
CROSSOVER:
- Crossover is the most significant phase in a genetic algorithm.
- For each pair of parents to be mated, a crossover point is chosen at random from within the genes.
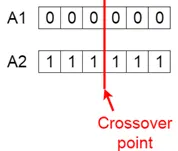
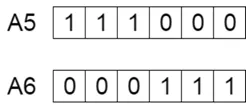
- Off-springs are created by exchanging the genes of the parents among themselves until the cross over point is reached.
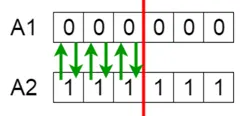
- The new off springs are added to the population.
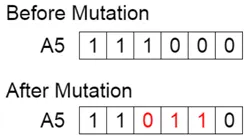
MUTATION:
- In certain new offspring formed, some of their genes can be subjected to a mutation with a low random probability.
- This implies that some of the bits in the bit string can be flipped.
SYNTAX OF GENETIC ALGORITHM:
- X = ga (fun, nvars)
finds a local unconstrained minimum, x, to the objective function(fun). nvars is the dimension (number of design variables) of fun.
- X = ga (fun, nvars, A, b)
finds a local minimum x to fun, subject to the linear inequalities A*x ≤ b. evaluates the matrix product A*x as if x is transposed (A*x').
- x = ga (fun, nvars, A, b, Aeq, beq)
finds a local minimum x to fun, subject to the linear equalities Aeq*x = beq and A*x ≤ b. (Set A= [] and b= [] if no linear inequalities exist.) ga evaluates the matrix product Aeq*x as if x is transposed (Aeq*x').
- x = ga (fun, nvars, A, b, Aeq, beq, lb, ub)
defines a set of lower and upper bounds on the design variables, x, so that a solution is found in the range lb ≤ x ≤ ub. (Set Aeq= [] and beq= [] if no linear equalities exist).
- x = ga (fun, nvars, A, b, Aeq, beq, lb, ub, nonlcon)
subjects the minimization to the constraints defined in nonlcon. The function nonlcon accepts x and returns vectors C and Ceq, representing the nonlinear inequalities and equalities respectively. ga minimizes the fun such that C(x) ≤ 0 and Ceq(x) = 0. (Set lb= [] and ub= [] if no bounds exist.)
- x = ga (fun, nvars, A, b, [], [], lb, ub, nonlcon, IntCon)
- x = ga (fun, nvars, A, b, [], [], lb, ub, nonlcon, IntCon, options)
requires that the variables listed in IntCon take integer values.
- x = ga (fun, nvars, A, b, Aeq, beq, lb, ub, nonlcon, options)
minimizes with the default optimization parameters replaced by values in options. (Set nonlcon= [] if no nonlinear constraints exist.) Create options using optimoptions.
COMMANDS USED FOR PROGRAMING:
- clear all is used to clear the workspace of the MATLAB.
- Close all is used to close any pre-existed plots.
- clc is used to clear the command window.
- Linspace is used to create an array of elements with equal range between the elements.
- Meshgrid is used to create a 2D or 3D coordinates using the values that are given to x, y.
- For loop for loop is used to execute the commands inside the loop until loop ends up to a specified range.
- Length is used to return the length of the array which is specified to it.
- Subplot is used create different plots in the same workspace by specifying the position of the plot.
- Surfc is used to create a 3D surface plot which has contour plot underneath it.
- shading interp varies the color in each line segment and face by interpolating the colormap index or true color value across the line or face.
- xlabel & ylabel is used to label the axis of the plot.
- Title is used to specify the title of the plot.
- tic function records the current time.
- toc function uses the recorded value to calculate the elapsed time.
- Plot3 is used to 3D plot the (x, y, z) command in a 3D plane.
- Plot is used to create a 2D plot for y verses x.
STALAGMITE FUNCTION:
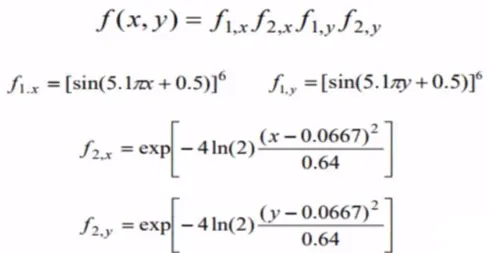
stalagmite function code:
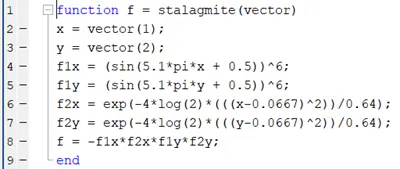
function f = stalagmite(vector)
x = vector(1);
y = vector(2);
f1x = (sin(5.1*pi*x + 0.5))^6;
f1y = (sin(5.1*pi*y + 0.5))^6;
f2x = exp(-4*log(2)*(((x-0.0667)^2))/0.64);
f2y = exp(-4*log(2)*(((y-0.0667)^2))/0.64);
f = -f1x*f2x*f1y*f2y;
end- Creating a function for which the input array as an argument for x and y.
- The output of the variables is stored in function sol.
- The first column of the input array is stored in x.
- The first column of the input variable is stored in y.
- The code for the stalagmite function is created as a function file which can be called at time of usage.
code:
%coding to find the global maxima
clear all
close all
clc

%inputs for the ga in form an array
x = linspace(0,0.6,150);
y = linspace(0,0.6,150);

%2D representation of the array using meshgrid
[xx, yy] = meshgrid(x,y);


%stalagmite function
for i = 1:length(xx)
    for j = 1:length(yy)
        vector(1) = xx(i,j);
        vector(2) = yy(i,j);
        f(i,j) = stalagmite(vector);
    end
end

op_int = 100;

tic;
%for unbounded inputs
for i = 1:op_int
[inputs, fval(i)] = ga(@stalagmite,2);
xout(i) = inputs(1);
yout(i) = inputs(2);
end
study_time1 = toc;

%ploting
figure(1)
subplot(2,1,1)
hold on
surfc(xx,yy,-f)
xlabel('x value')
ylabel('y value')
shading interp
plot3(xout,yout,-fval,'marker','o','markerfacecolor','r','markersize',5)
title('unbonded inputs')
subplot(2,1,2)
plot(-fval)
xlabel('iterations')
ylabel('minimum')

%when bounds are applied
tic
for i = 1:op_int
[inputs, fval(i)] = ga(@stalagmite,2,[],[],[],[],[0;0],[0.6;0.6]);
xout(i) = inputs(1);
yout(i) = inputs(2);
end
study_time2 = toc;

%ploting
figure(2)
subplot(2,1,1)
hold on
surfc(xx,yy,-f)
xlabel('x value')
ylabel('y value')
shading interp
plot3(xout,yout,-fval,'marker','o','markerfacecolor','r','markersize',5)
title('bounded inputs')
subplot(2,1,2)
plot(-fval)
xlabel('iterations')
ylabel('minimum')

%increasing the ga iterations

options = optimoptions('ga');
options = optimoptions(options,'populationsize',130);

tic
for i = 1:op_int
[inputs, fval(i)] = ga(@stalagmite,2,[],[],[],[],[0;0],[0.6;0.6],[],[],options);
xout(i) = inputs(1);
yout(i) = inputs(2);
end
study_time3 = toc;

%ploting
figure(3)
subplot(2,1,1)
hold on
surfc(xx,yy,-f)
xlabel('x value')
ylabel('y value')
shading interp
plot3(xout,yout,-fval,'marker','o','markerfacecolor','r','markersize',5)
title('bounded inputs with increase in iterations')
subplot(2,1,2)
plot(-fval)
xlabel('iterations')
ylabel('minimum')
EXPLANATION OF CODE:
HEADER:
- The header consists of clear all, close all, clc.
- The clear all is used to remove the pre-existing data in the work space.

- The close all command is used to close any pre-existing graphs are charts.
- The clc command is used to clear the command window to see the output of the program.
INPUTS:
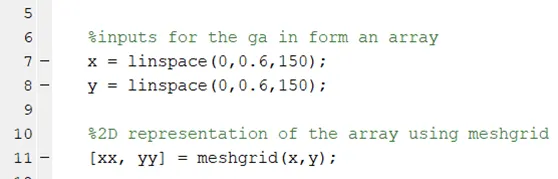
- The linspace command is used to create an array for variable x and y with equal ranges between the elements.
- The meshgrid command is used to 2D and 3D coordinates for the following variables.
FUNCTION:
- In this for loop is created to give the inputs for x and y variables to the stalagmite function which gives a output for the function.
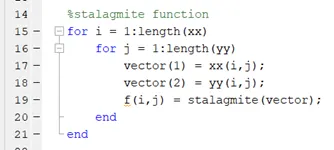
- This creates the data for the genetic algorithm to create global maxima for stalagmite function.
PLOTTING:
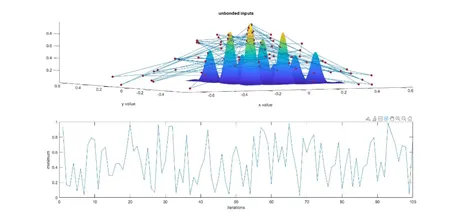
- The plot3 command is used to create a 3D contour for the data which represents as a surface.
- The plot command gives the global maxima for the iterations.
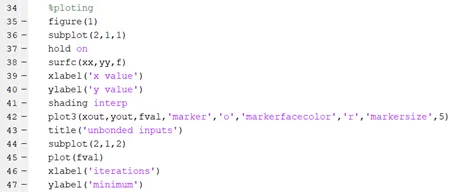
- The surfc command is used to create the surface over a contour.
- The shading command is used to give a smooth surface for the following data using color mapping.
FOR THE SECOND TYPE GIVING THE BOUNDED REGIONS:
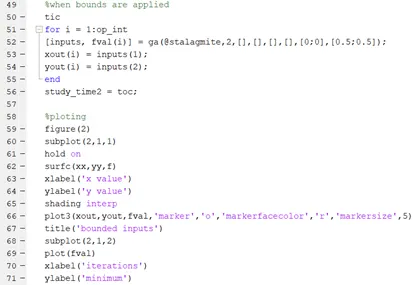
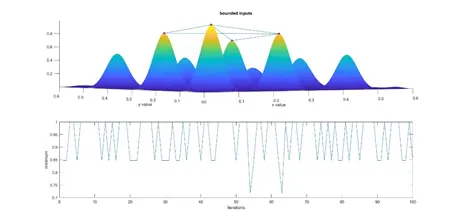
- In this method, we are going to give the upper bound and the lower bound for the stalagmite function.
- This creates the data to be minimized to find the global maxima of the following data that has been taken by the function.
- From the above type which is unbounded region to the bounded region, the data gets smoother and the local minima are reduced.
THIRD TYPE BOUNDED AREA WITH INCREASE IN ITERATIONS:
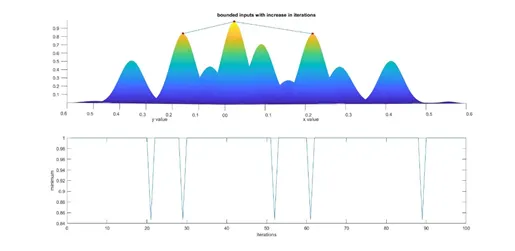
- Just by increasing the number of iterations the local minima will reduce and the global maxima for the function will increase.
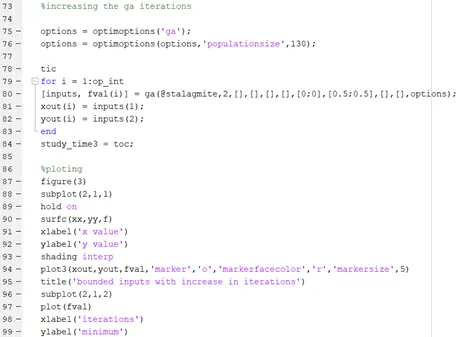
- The options command is used to return the alter the parameters.
- By giving the number of iterations more the local minima gets reduced and the global maxima will be optained.
OUTPUT:
FOR UNBOUNDED INPUTS:
FOR BOUNDED INPUTS:
FOR BOUNDED INPUTS WITH INCREASE IN POPULATION:
REFERENCES:
- https://in.mathworks.com/discovery/genetic-algorithm.html
- https://in.mathworks.com/help/gads/ga.html
- https://towardsdatascience.com/introduction-to-genetic-algorithms-including-example-code-e396e98d8bf3#:~:text=A%20genetic%20algorithm%20is%20a,offspring%20of%20the%20next%20generation.