Crash Box SimulationUsing LS-Dyna
Aim:- Crash Box Impact Test.
Objective:-
- Study the different Cards and stresses and strain generated during impact.
- creating an input deck from scratch.
- The cross-sectional force generated in the middle of the cashbox
Methodology-
1- Import the model.
2- Delete the unusable parts.
3- Set the appropriate case by defining Boundary, Material, Section, etc
4- Define Output request for which you want to see results like, Database- D3plot, GLSTAT, etc.
5- Run the simulation in Ls-Run and plot the results.
Procedure
1) Imported the model. The model contains a Dummy Crashbox. The element by which it's defined is Shell elements.
2) To performed crash behavior one rigid plane is needed against which the crash box impacted.
3)Defined the plane using the Entity Creation option.
Entity Creation -- Rigidwall---Planer---(1n+NL)
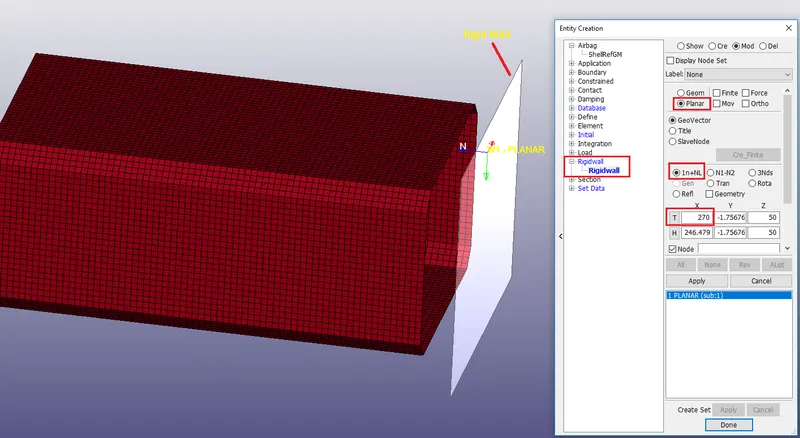
here the distance in the X co-ordinates direction is kept 270 mm which more than the default one because we need some distance from where the crash box impacts the wall.
4) Assigned the section card to the crash box as it contains shell elements
Model ----Keywords manager---ALL-----SECTION----
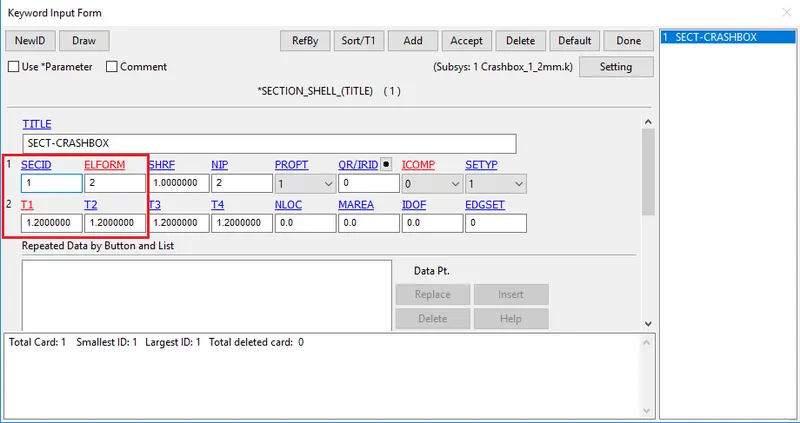
As we are dealing with Shell Elements here we have to mention the thickness of the elements in the CARD as you can see. Element formulation is kept as default.
5) After assigning the section, the material to the component we need to assign
parts----Model ---Keywords manager---PART-----
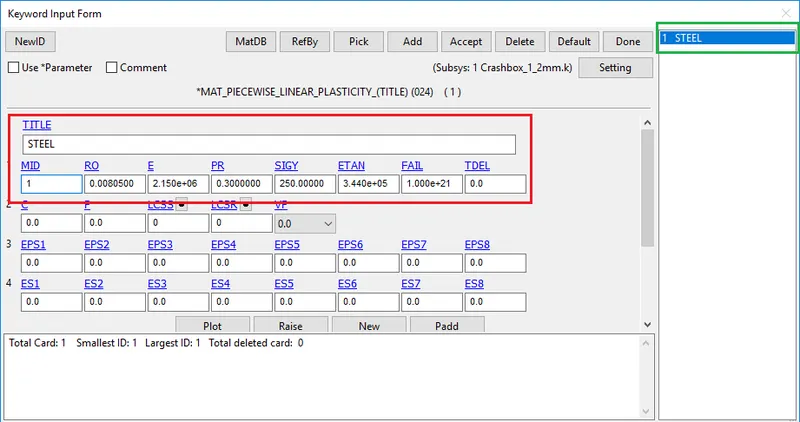
Here we used Steel as a Material. One thing to noticed here is there is no special card define for the Rigid wall as the Rigid wall is the infinite plane with the highest rigidity of all. it will behave as perfectly rigid during the entire simulation.
6) After assigning the section and material to the component we need to assign it into
parts----Model ---Keywords manager---PART-----
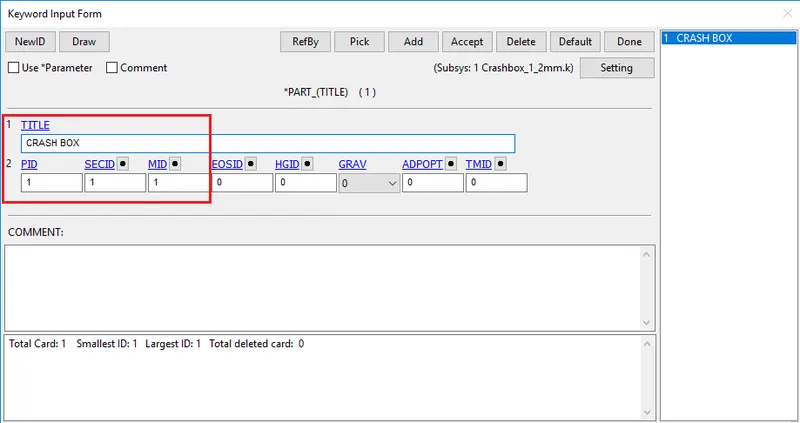
7) Boundry Condition
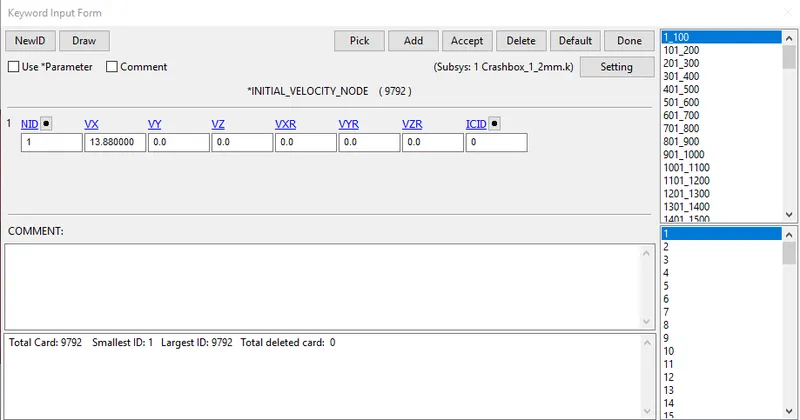
The Initial Velocity of 13.88 mm/ms is given to the Crashbox as Boundary condition along the X-direction.
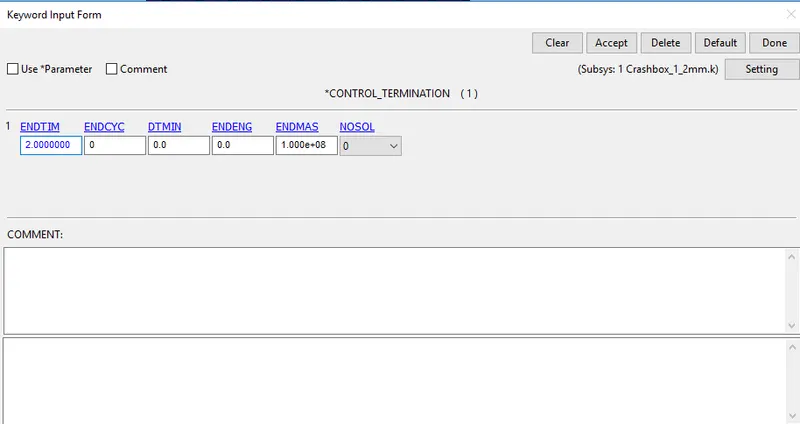
8)Termination Time is given of 2ms
9) Output Request
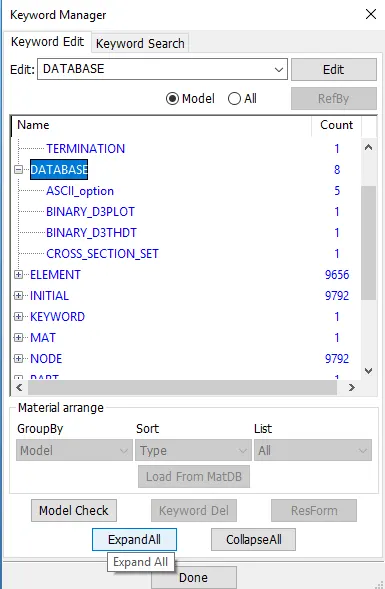
a) In the output we need d3plot, glstat, sleout, rcforc files. These files we can request using the "DATABASE" Keyword.
b) Cross-sectional force generated in the middle of the cashbox.
To count the cross-section force first we have to define the elements and node-set around which we want force calculation. That we can do using the Entity Creation option.
As we asked to collect the force in middle, I had selected the middle line of elements and nodes as you can see in the below image,
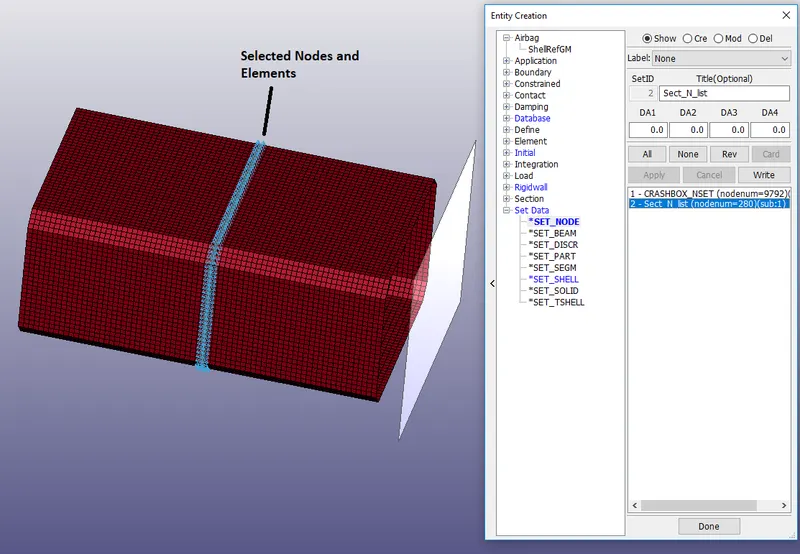
Then Assigned these sets to the Cross-section Card
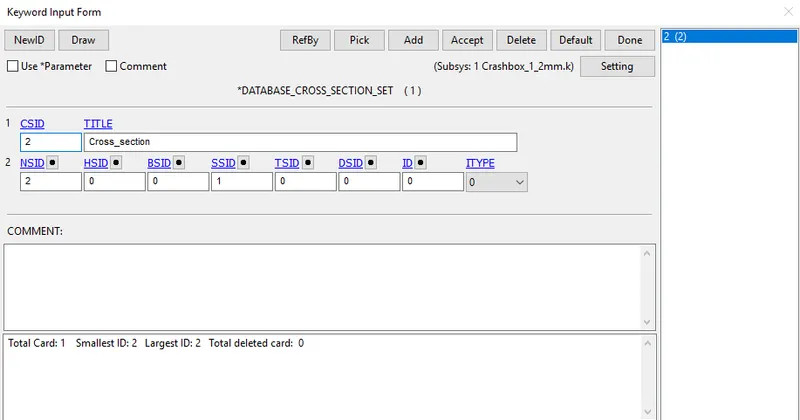
NSID= Node set ID
SSID = Shell element Set ID
c) Acceleration plot of a node in the middle of the cashbox. get the lot from the defined output cards.
d) all energies (total, internal, kinetic, hourglass, sliding)
All other energies will we get from the GLSTAT card but for Hourglass energy we have to define a separate energy card from the "CONTROL"
e) Compare the accelerations and stress/strain plots of 1.2/1.5mm crash boxes
Pre-Processing
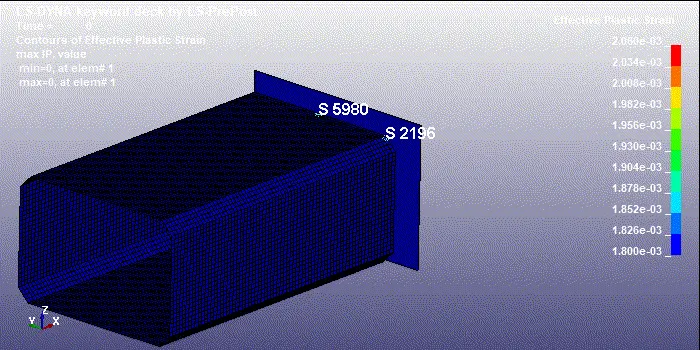
CASE1:- Crashbox thickness = 1.2mm
CASE1:- Crashbox thickness = 1.5mm
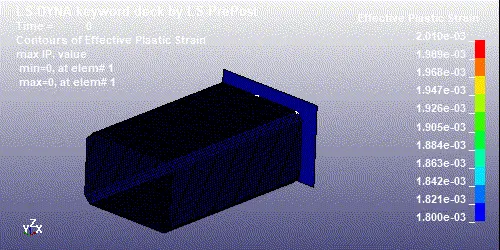
Plotting for Plastic Strain for CASE 1 And case 2
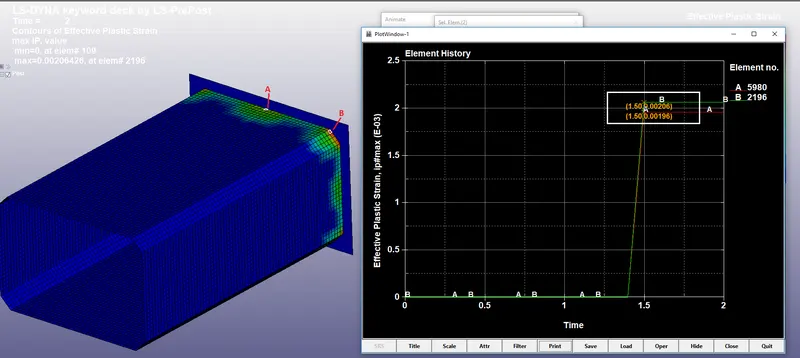
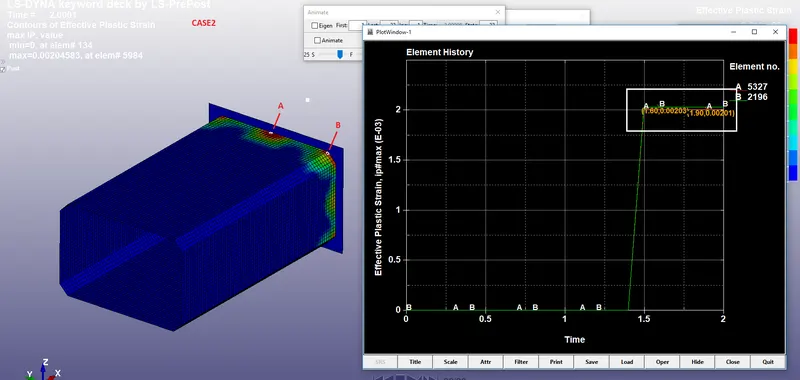
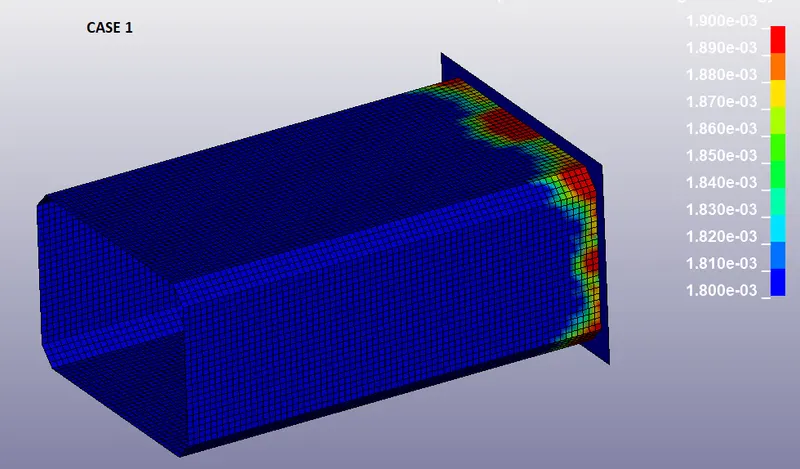
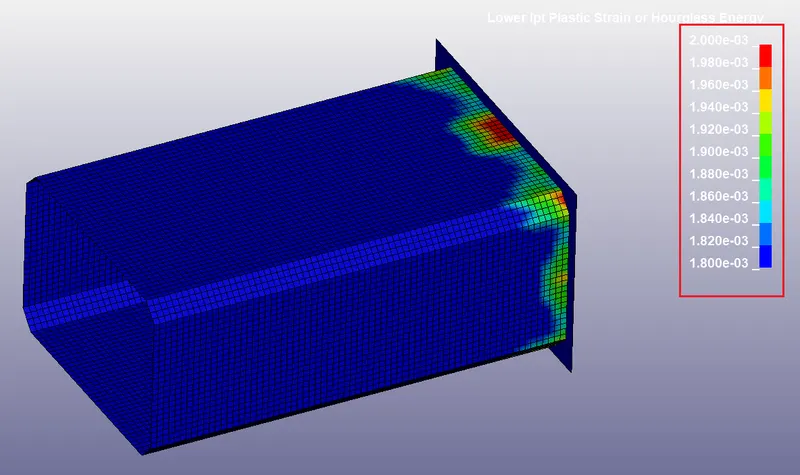
From the Animation and Graphical results we can say that there is no much difference in strain value we are finding in both cases. One common thing is Maximum Strain has generated at the corner of the Crashbox. Also, the value of the strain in case1 (SMT = 1.2mm) the difference between the strain value at the middle and at the corner have a noticeable difference while for case 2 that difference is minimal, Which indicates that increase in thickness provided more stiffness.
The cross-sectional force generated in the middle of the crash box (along its length)
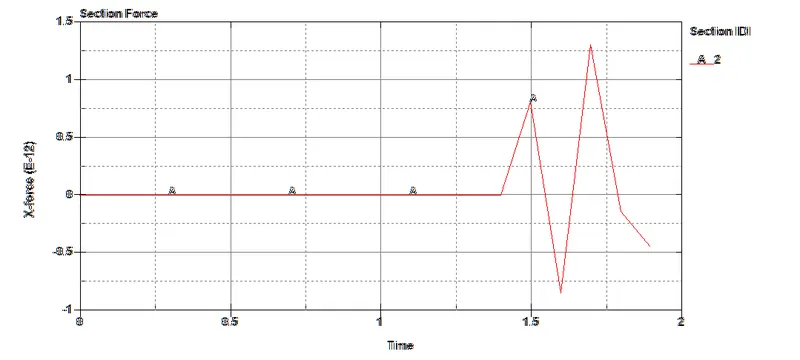
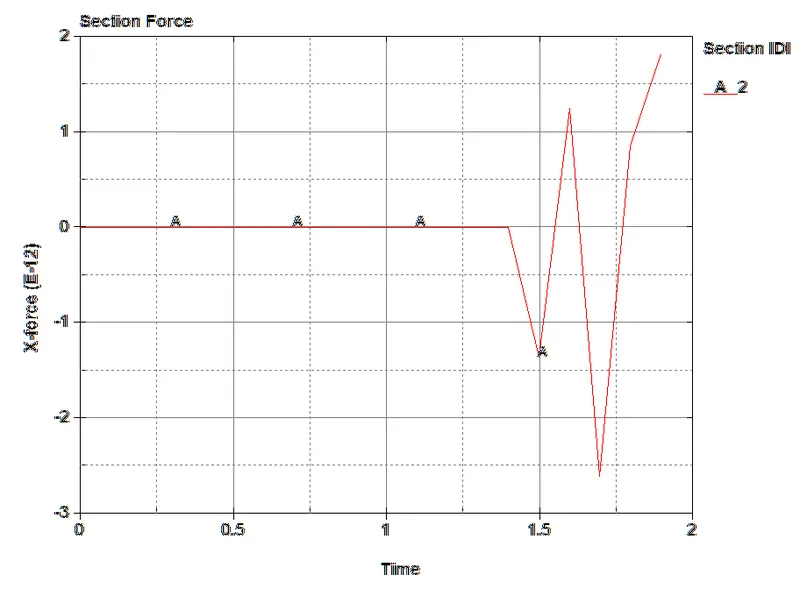
-As per the Cross-section plot the vibration traveled through the component are continuos and the reciprocating way which is leading to the negative force readings. There is a Damping element present in these cases to get the actual stress that travelled through the component.
- Acceleration plot of a node in the middle of the crash box (along its length)
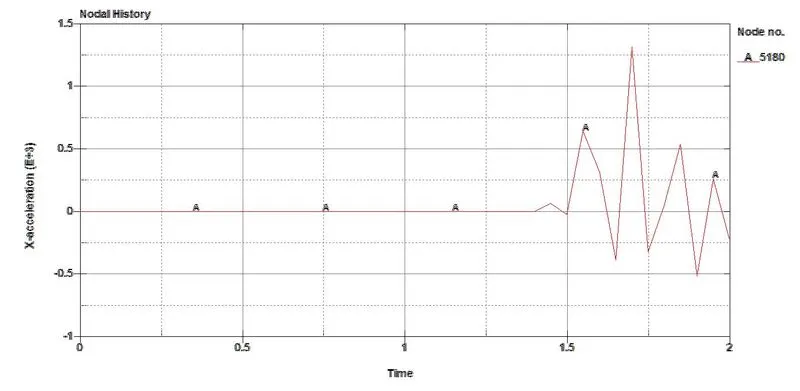
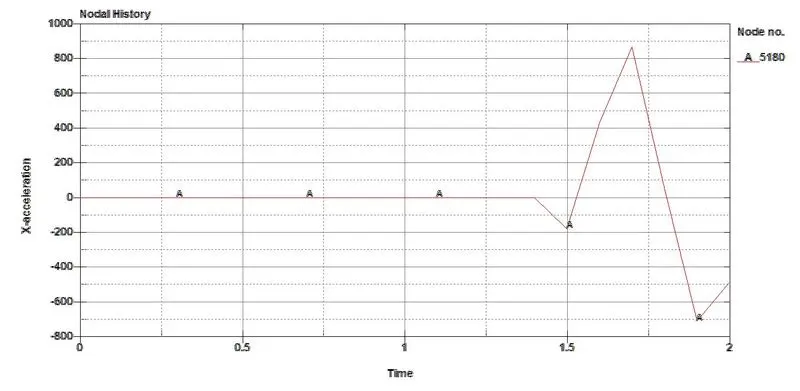
The acceleration plot at Node 5180 is as shown in the above images. The Acceleration is Higher in the case of a 1.2mm thick component. This is because mass and Acceleration are inversely proportional. With the increase in thickness, its mass increase that leads to the reduced acceleration.
Acceleration in CASE1:- 1320 mm/ms2
Acceleration in CASE2:- 870 mm/ms2
Maximum directional stress and strain along the length of the crash box
Energy Plot
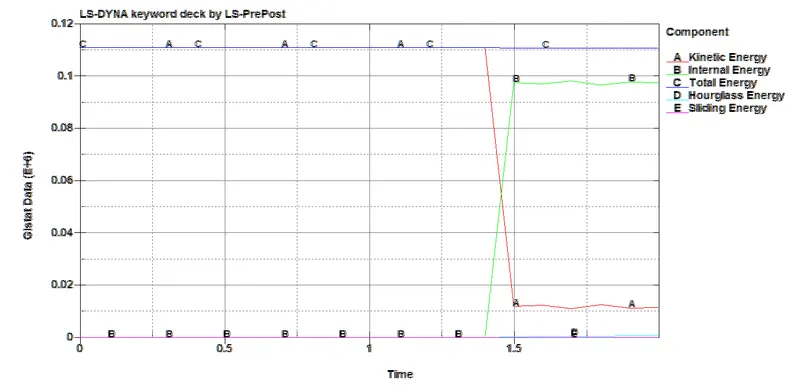
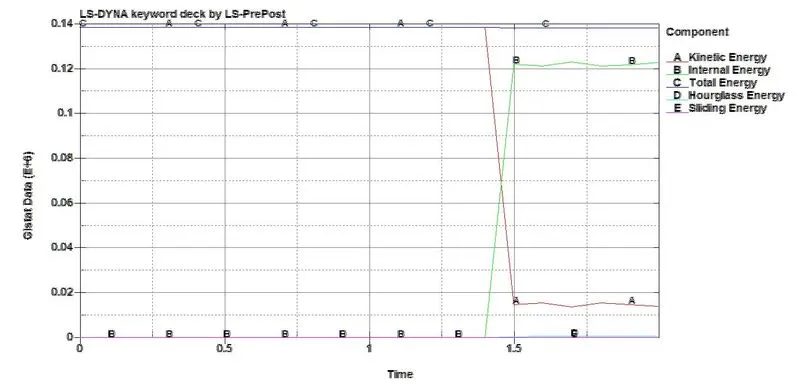
As per the study of the Energy plot, we can say that both the Simulations are in Quillibrium and hence stable. The only difference is the total energy noted by the CASE 2 scenario is more as compared to case 1. As in case 1 the thickness defined was 1.2mm while for Case2 the defined thickness is 1.5mm means there is an increase in the mass of the same component, which leads to the High total Energy value.