Week - 4 - Crash Box Simulation
OBJECTIVE: To simulate a crash test for the given FE model of a crash box using LS-Dyna. Request for the given deliverables and compare the results for a 1.2 mm thick and 1.5 mm thick crash box.
Deliverables:-
- The crash box should crash into a rigid wall created using *RIGIDWALL_ keyword.
- Material for the crash box is steel. The simulation needs to be started using elastic material to verify its correctness and later a nonlinear material card data will be provided. The thickness of the crash box is 1.2mm.
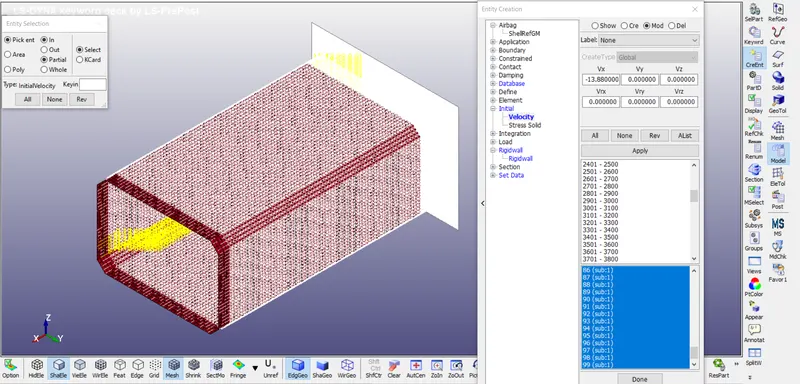
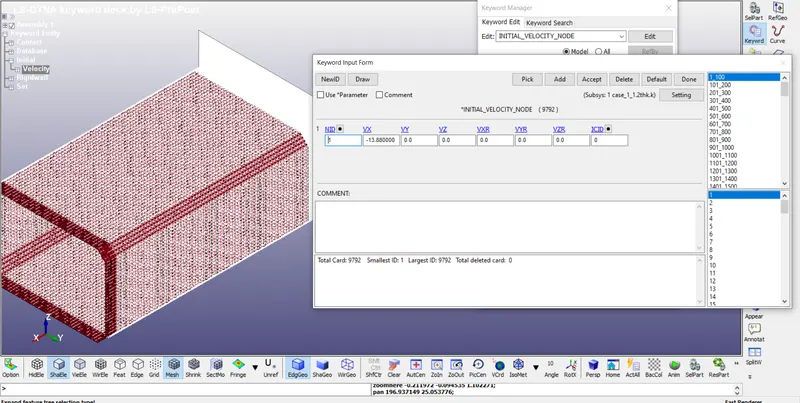
- Initial velocity for the crash box should be around 50 kmph
- The units system to be used is gm-mm-ms
DECK SET-UP :-
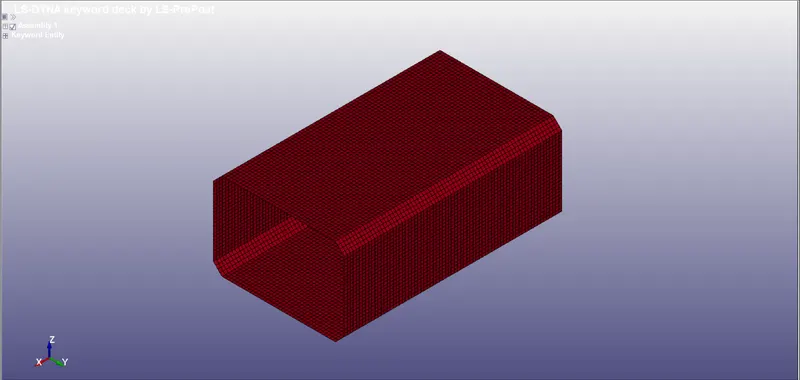
- Import MOdel in LS-DYNA GUI :-
- Keyword set-up :-
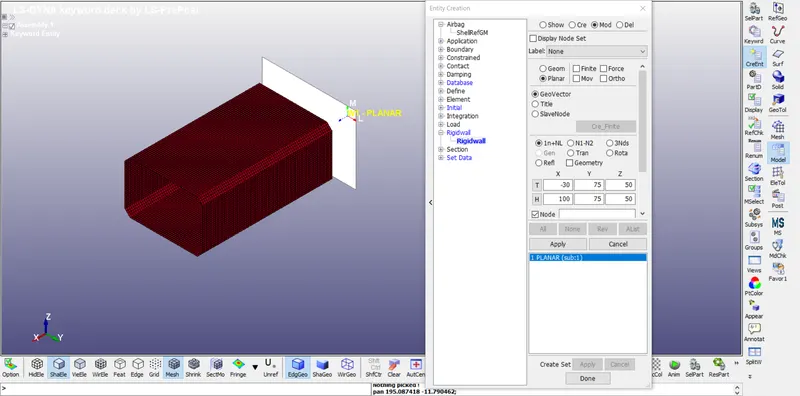
1) Create Rigid Wall
Entity_Creation - Rigid_wall - Create
- Set Material Key Word for Box :-
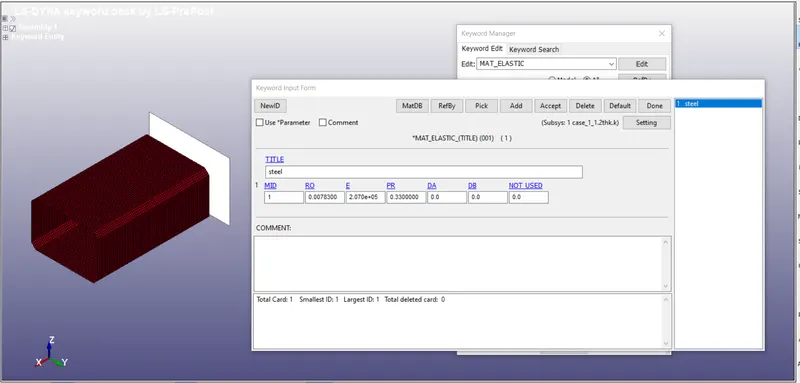
To define elastic material for Crash box :-
Keyword Manager - All - MAT - 001-Elastic
- Set Section Key Word for Box :-
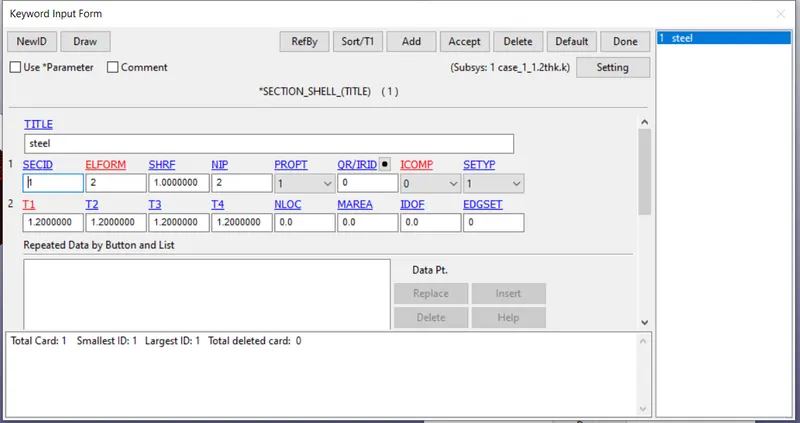
To define Section for Crash box :-
Keyword Manager - All - SECTION - SHELL
- Set Part Key Word for Box :-
As MAT and SECTION is set now we can define part keyword for crash box
Keyword Manager - Model - Part
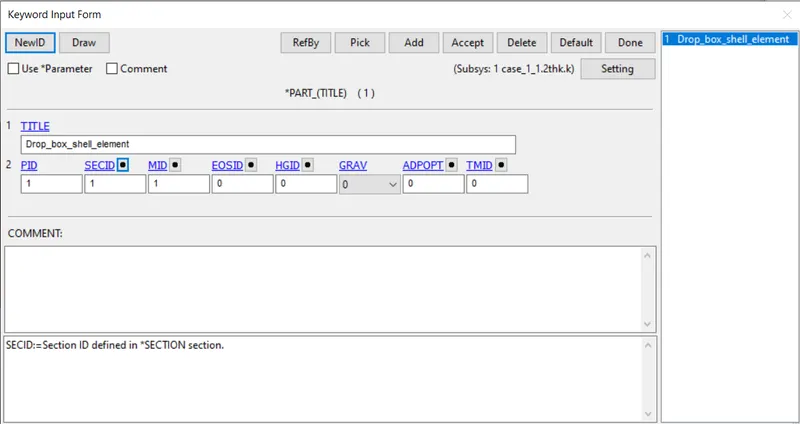
After part set-up is complete next step is to define Boundary Conditions for model:-
- Set Initial_velocity Key Word for Box :-
Entity_Creation - INITIAL - Veocity - Cre
- Set Contact Key Word for Box :-
Type of Contact used :- Autmoatic surface to surface
To define Crash box as a Slave first we have to define set_part for crash box
Entity_Creation - SET_DATA - SET_PART - Cre
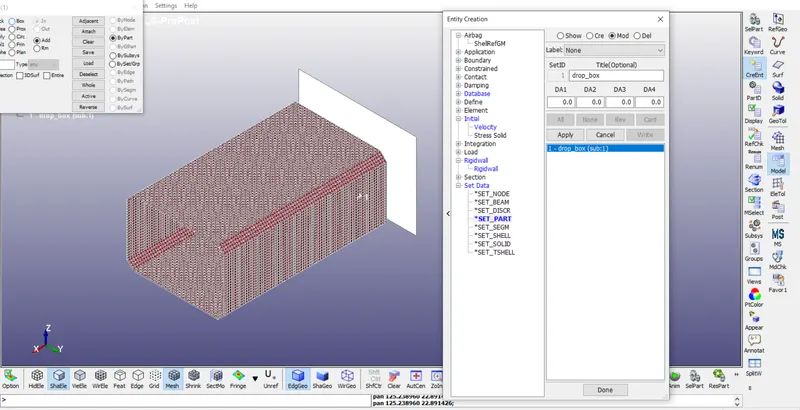
To Set contacts
Keyword Manager - All - Contact - Autmoatic surface to surface
Master :- Rigid Wall
Slave :- Crash Box
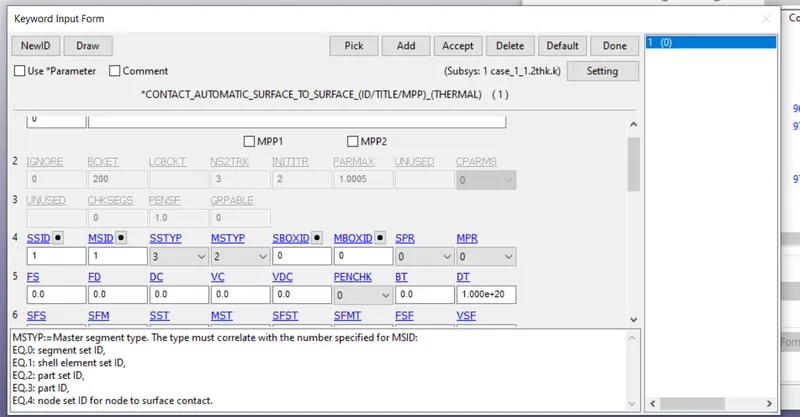
After Boundary Conditions set-up is completed next step is to define outputs for model:-
- Set Control Key Word for Box :-
Keyword Manager - All - Control -Termination
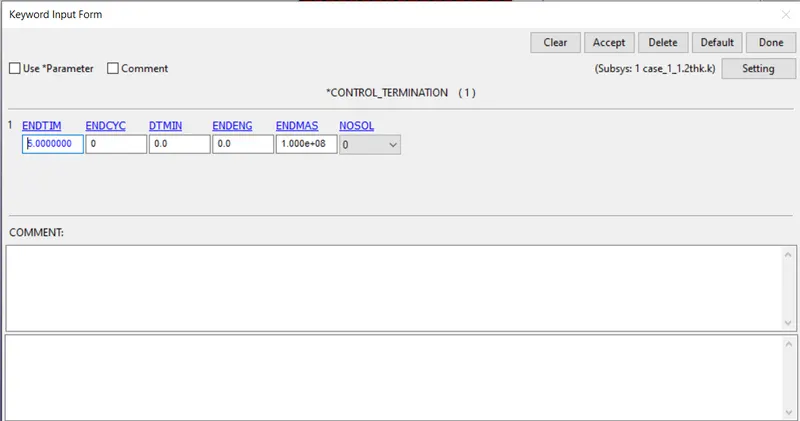
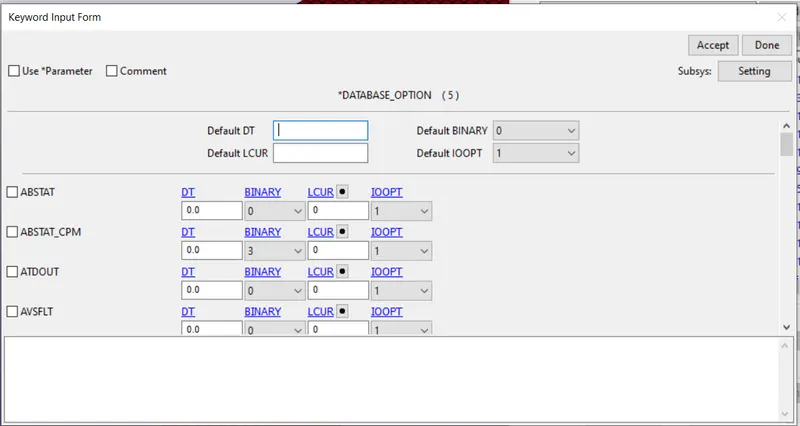
- Set DATABASE Key Word for Box :-
- Binary d3 Plot
- ASCII_Options
- Cross section Plane
using *DATABASE_GLSTAT, *DATABASE_MATSUM, *DATABASE_RCFORC, *DATABASE_RWFORC, *DATABASE_SLEOUT, and *DATABASE_BINARY_D3PLOT. Set 0.01 as the time interval between successive recorded values for all.
Output_Request :-
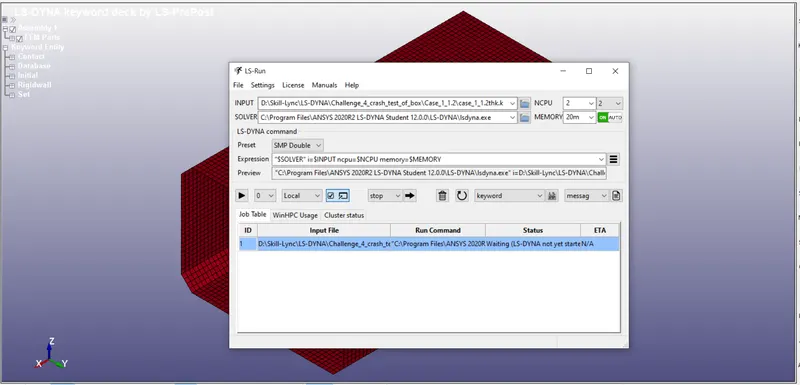
Animation Result :-
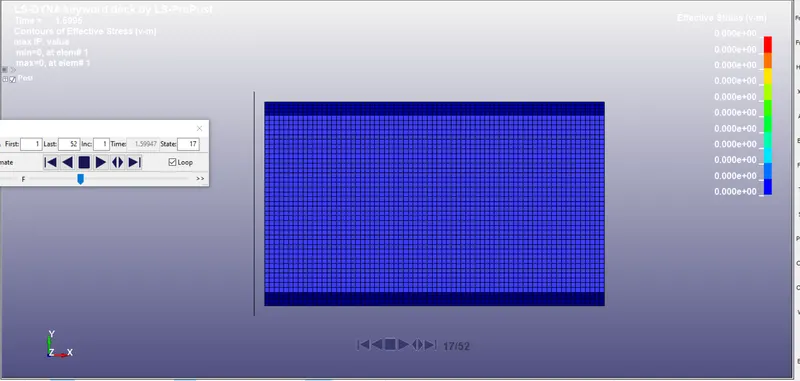
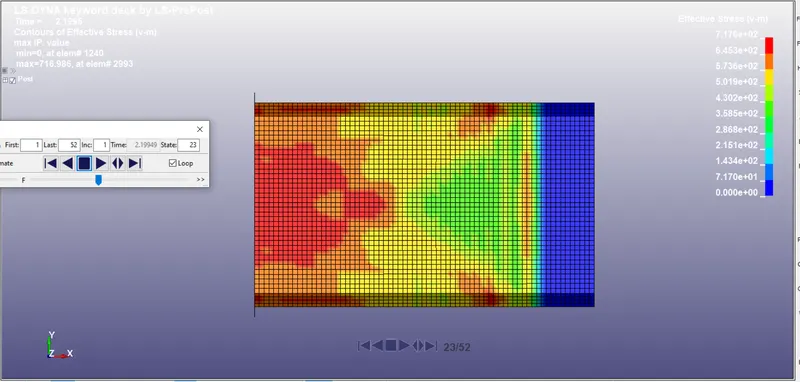
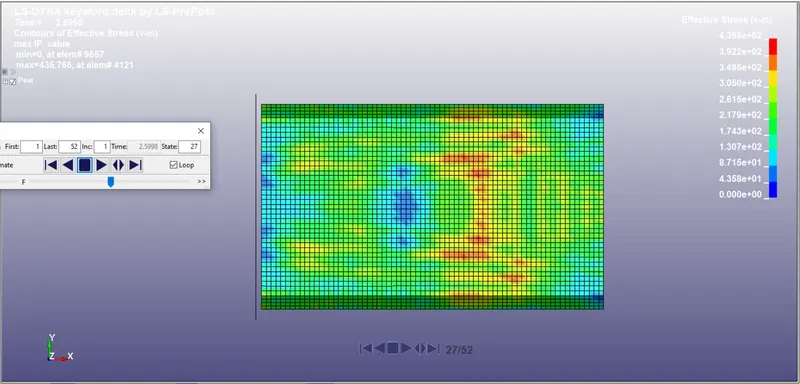
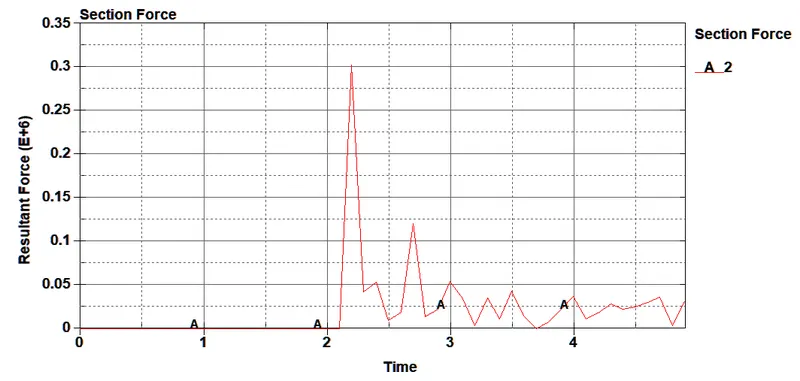
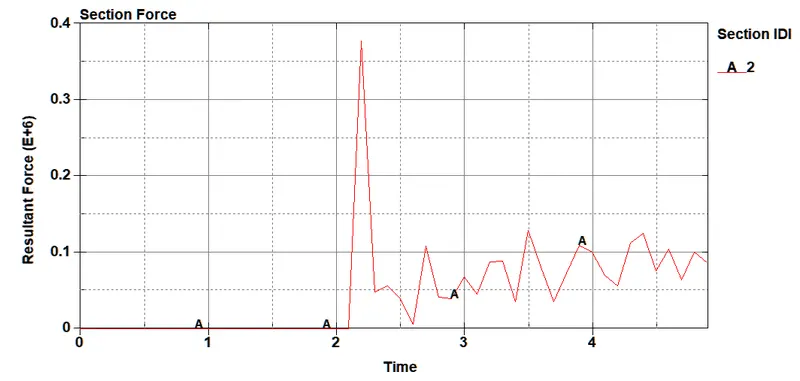
- Cross-sectional force generated in the middle of the crashbox (along its length)
Case-1 :- 1.2 thk
Case-2
Thk :-1.5 thk
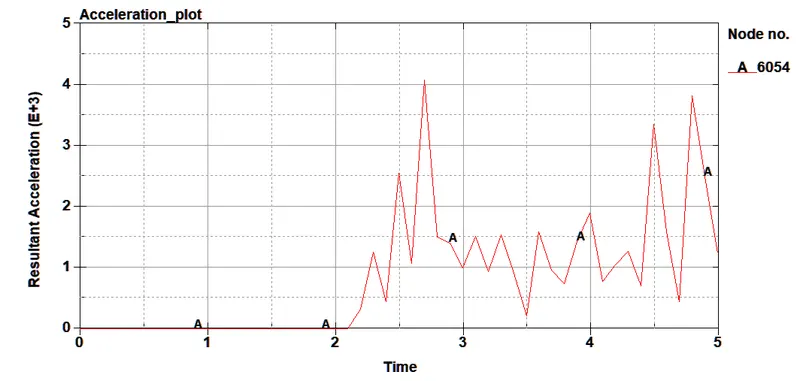
Acceleration plot of a node in the middle of the crashbox (along its length)
Case-1 :- 1.2 thk
Case-1 :- 1.5 thk
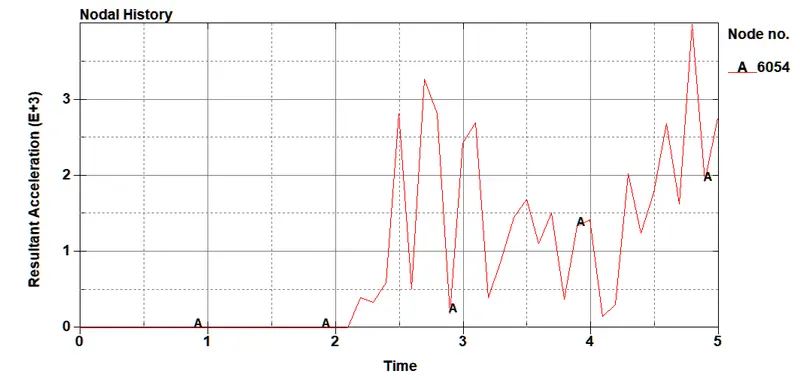
The acceleration plot shows 0 acceleration up to 0.36 ms as the crash box is moving with a uniform velocity until this point. Thereafter, it becomes non-zero as the impact takes place and goes on to a maximum value of 201000 mm-per-(ms)^2 at ~0.48 ms when the crash box starts moving in the opposite direction on rebounding.
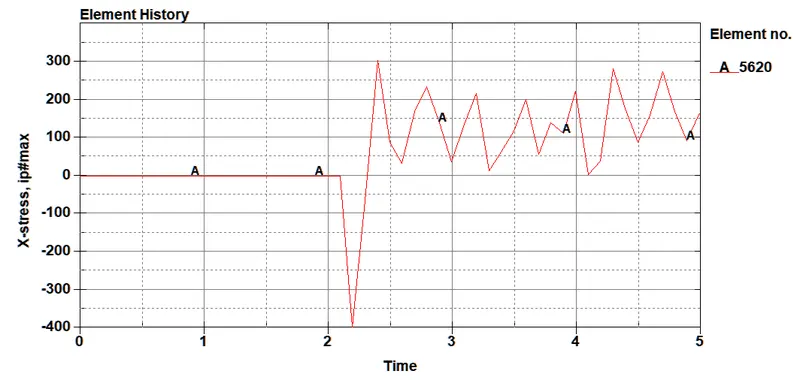
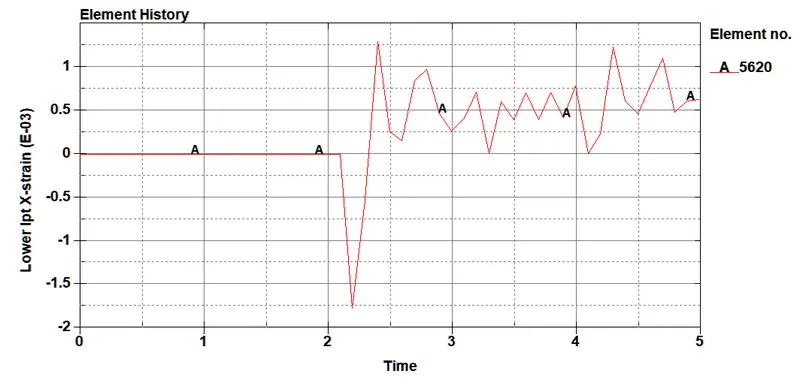
Maximum directional stress and strain along the length of the crashbox (X strain, Y strain etc)
Max Stress in X-Direction :-
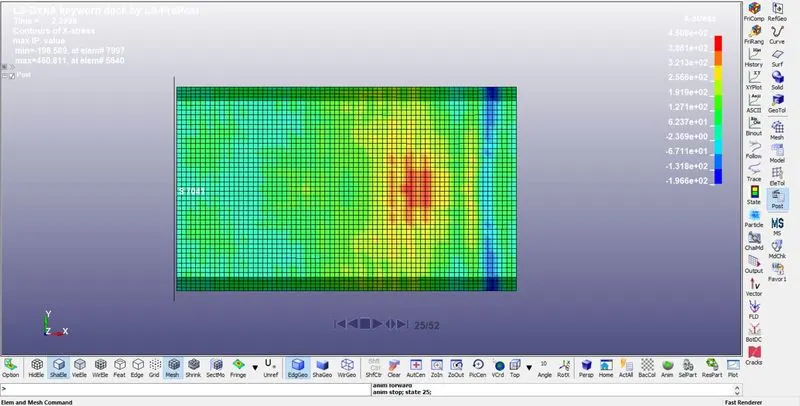
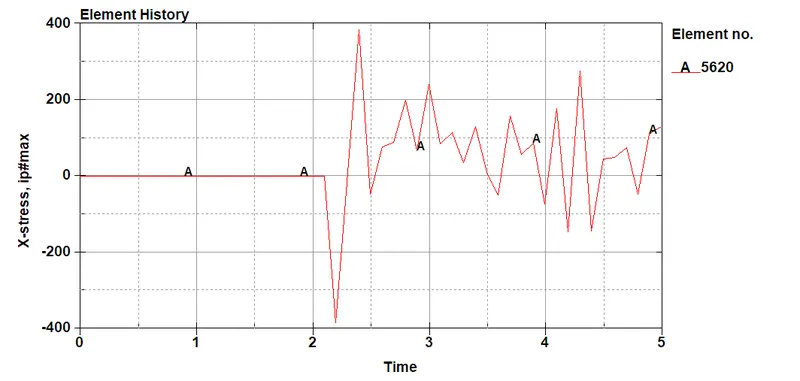
Case :-2 1.5 thk
X-Stress
X-strain
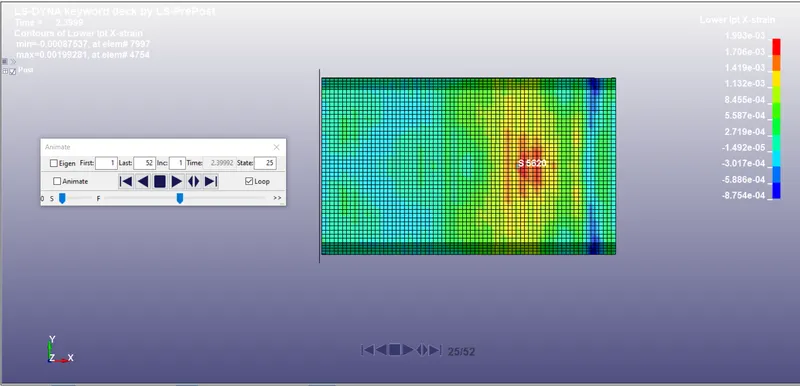
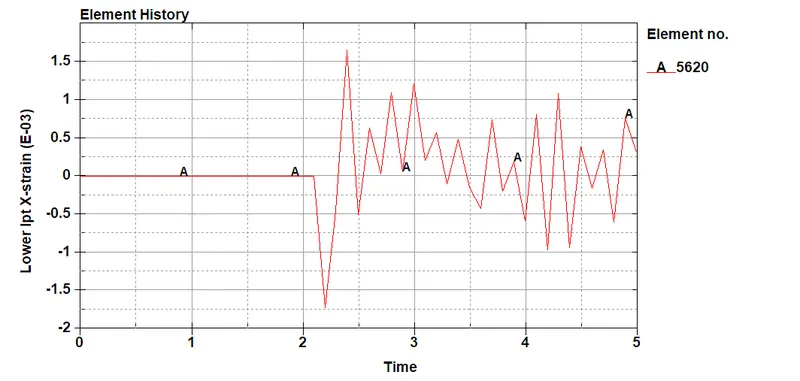
Case :-2 (1.5 thk)
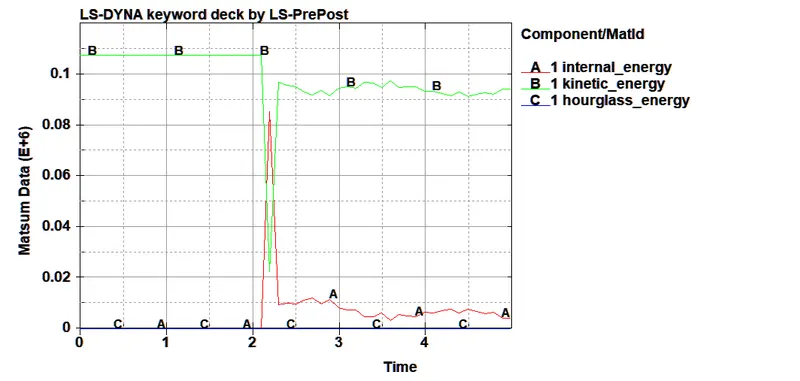
Plot of all energies (total, internal, kinetic, hourglass)
Case-1 :- 1.2 thk
Case :-2 1.5 thk
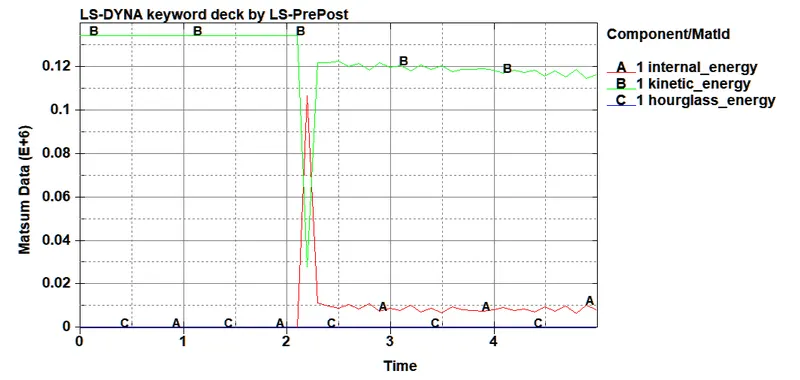
The Global Energy plots show the Kinetic energy, internal energy, Total energy, Sliding energy, and Hourglass energy values for the crash simulation.
The Energies are higher for the 1.5 mm thick crash box. The total energy for the 1.2 mm thick and 1.5 mm thick crash box was recorded as 107000 N-mm and 134000 N-mm respectively.
At 0 ms, the whole of the total energy is Kinetic energy. But as the simulation progresses and the impact between the Crash box and the Rigidwall takes place, at approx 0.36 ms, the Kinetic energy starts getting converted into Internal energy. The Internal energy reaches its peak and the kinetic energy reaches its lowest value at about 0.44 ms when the crash box is on the verge of getting rebounded from the rigid wall. The crash box then moves with a constant rebound velocity which is reflected in the energy plot as internal energy gets converted to kinetic energy and remains constant through the rest of the simulation.
CONCLUSION:
- The solver deck was set-up for the crash simulation and the required results were requested using the appropriate *DATABASE keyword cards.
- The analysis run successfully. Post-processing of the results was done using the D3plots and the other output ASCII result files, to produce the deliverables.