Week-4 Challenge WOT Condition Part-2
- What is the difference between mapped and dynamic model of engine, motor and generator? How can you change model type?
Description :
Mapped Engine :
Model uses a set of steady-state lookup tables to characterize engine performance.
The tables provide overall engine characteristics, including actual torque, fuel flow rate, BSFC, and engine-out exhaust emissions.
Use of Mapped engine :
-
If you have engine data from a dynamometer or a design tool like GT-POWER.
-
For quasi steady-state engine simulations.
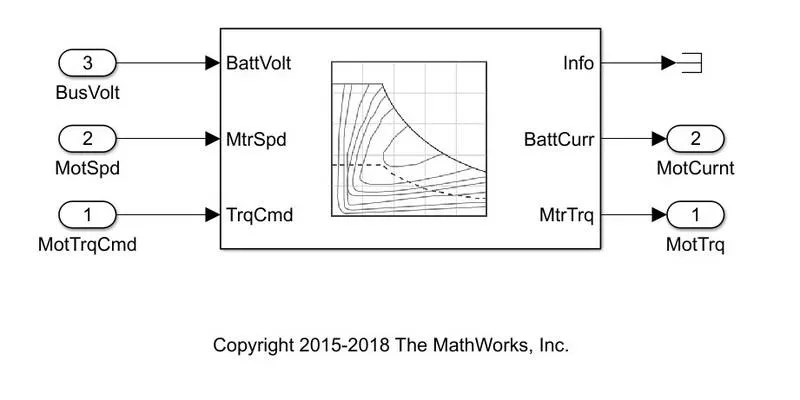
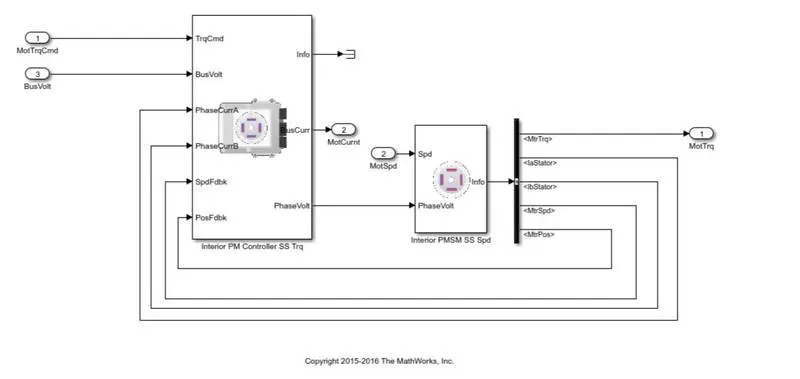
Dynamic Engine : Model decomposes the engine behavior into engine characteristics that are separated into lower-level components. By combining components in this way, the models capture the dynamic effects.
Use of Dynamic engine:
-
If you need a more detailed dynamic model and have component-level data.
-
To analyze the impact of individual engine components on the overall performance.
- Keeping all other parameters same, compare the simulated results of hybrid and pure electric powertrains.
2. How does the model calculate miles per gallon? Which factors are considered to model fuel flow?
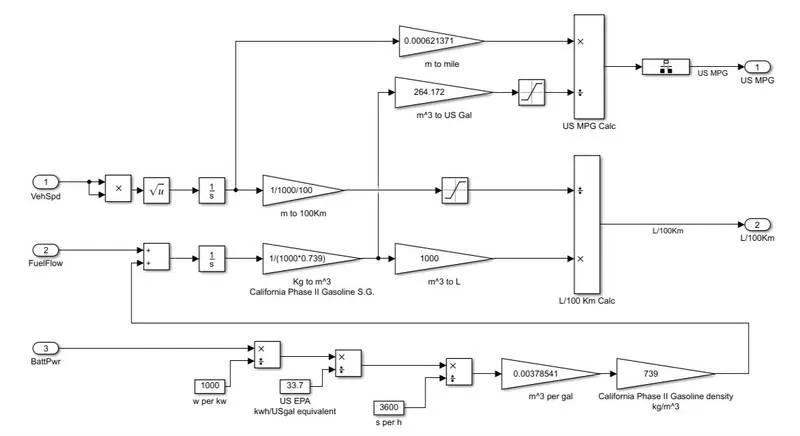
For Calculation of Miles per gallon.
Under 'Visualisation block' click on 'Performance calculation' Wee can see How miles per gallon is calculated.
3 Inputs notably 'vehicle speed' , 'Fuel flow' and 'Battery power' had been considered.
1) Vehicle speed is integrated to to get Distance which is in metres. To convert m to miles it is multiplies by a conversion factor.
2) The power is converted to KW by dividing it by 1000. Then by dividng it with a factor 33.7 we get in kwh/USgal equivalent then hr is converted into seconds. Multiplying by a factor of 0.00378541 gives us m^3 /gal. Multiplying it by 739 yeilds the result in kg/m^3.
3) Fuel flow is added to this and integrated wrt time to give us mass of fuel in kg which is multiplied by a given factor of (1/(1000*0.739)) . i.e mass is divided by a gasoline density to get volume in m^3.
m^3 is convertwd to gallon . Miles is divided by gallon to give us Miles per gallon finally.
3.Run the HEV ReferenceApplication with WOT drive cycle. Change the grade and wind velocity in the environment block. Comment on the results.
We here initially run the model setting the drive cycle to wot.( wide open throttle).
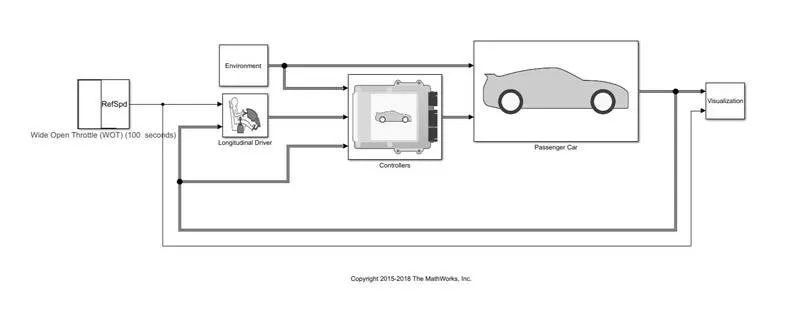
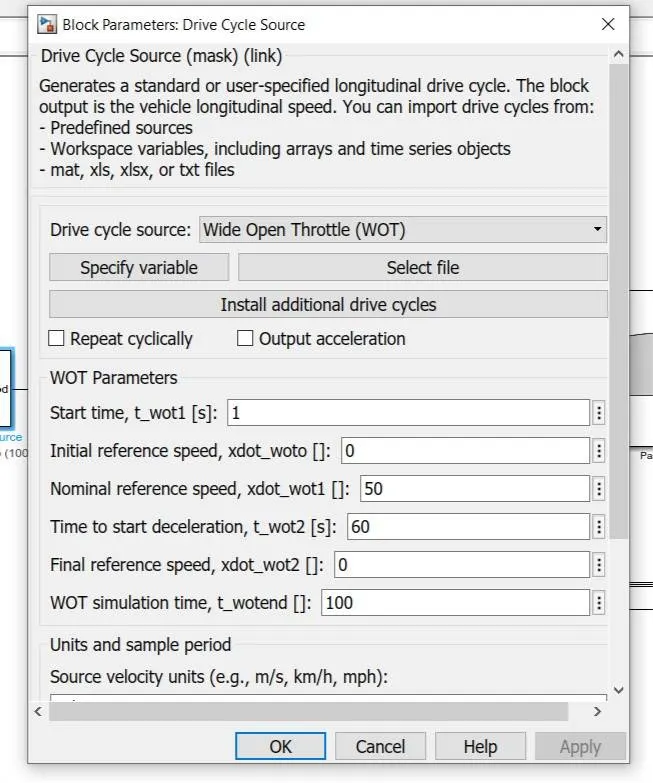
Run the simulation for 100 s.
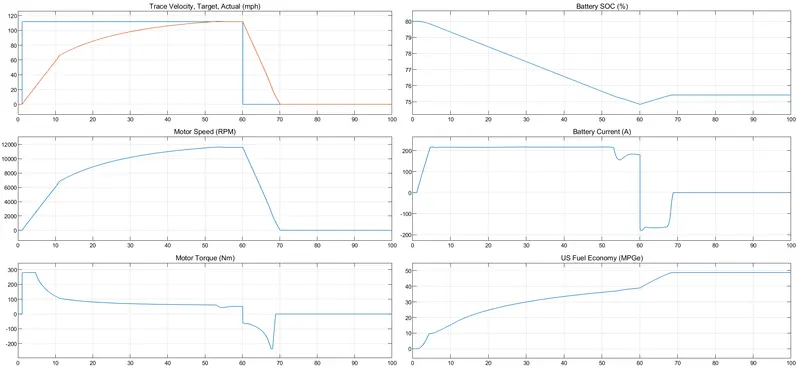
We get the following simulation results from visualisation block. here the model is run with no gradeability and wind velocity.
Now we set some values for gradeability and wind velocity.
There are 6 total plots
1) Trace velocity 2) Motor speed 3) Motor torque 4) Battery SOC (%) 5) Battery current (A) 6) US Fuel economy
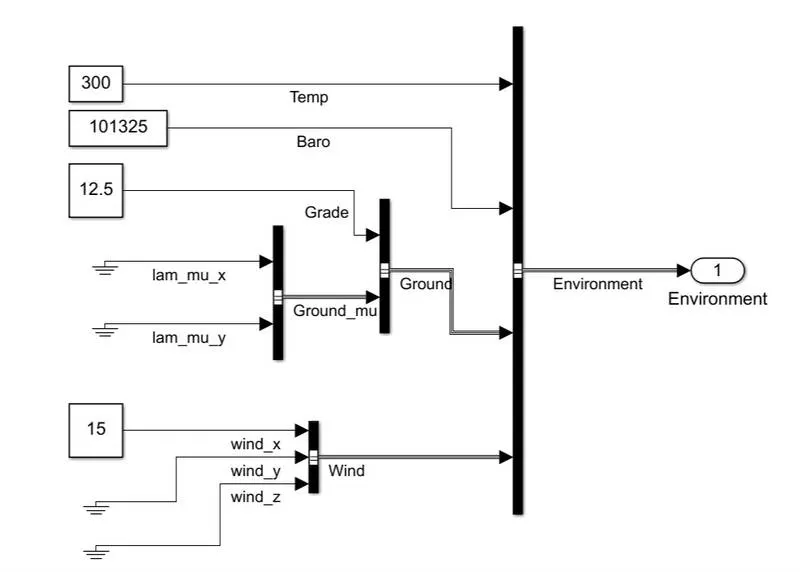
The grade has been set to 12.5 deg and wind velocity is 15 mph.
The simulation is again run for 100 s.
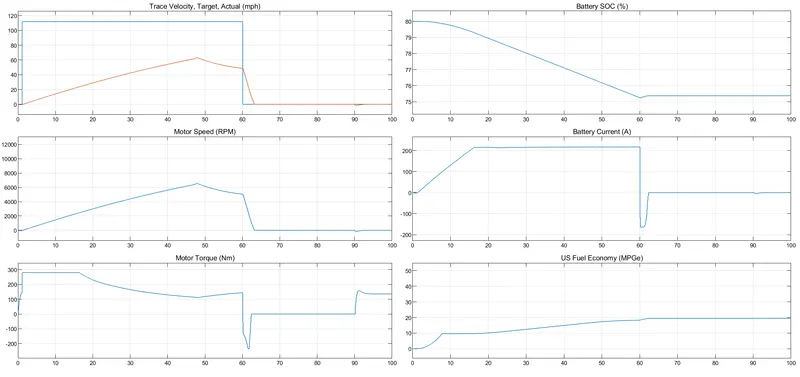
Following are the difference we can observe after environment changes.
1) The max speed reuces from 111.9 mph to 63.08 mph.
2) The motor rpm also decreases from 11590 rpm to 6538 rpm.
3) The fuel economy also goes down from 38.93 MPGe to 18.12 MPGe
4. Keeping all other parameters same, compare the simulated results of hybrid and pure electric powertrains.
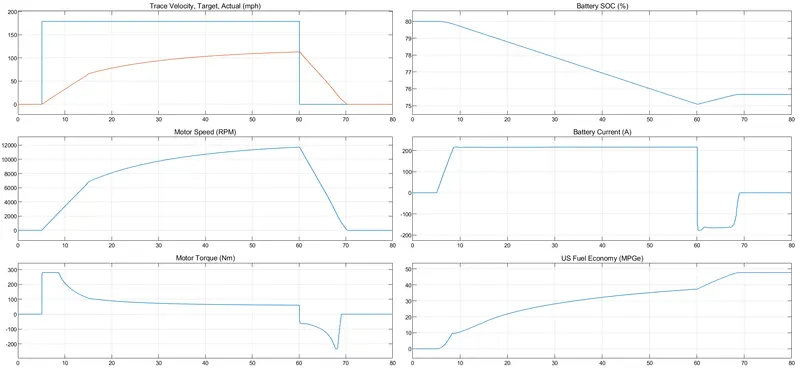
Let us first simulate for Pure electric power train.
For this we will simulate 'Pure electric reference' power train.
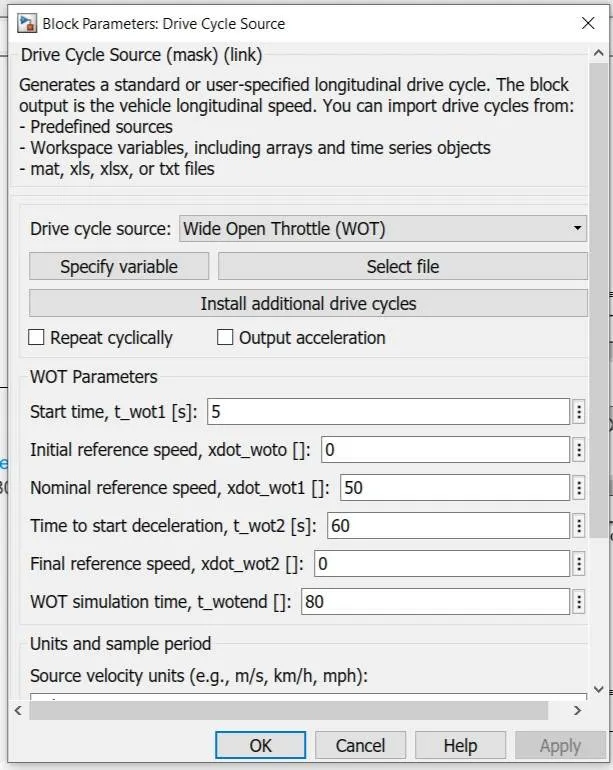
The wot drive cycle parameters are given above .
The simulation result is attached below
Now open HEV multimode reference power train.
The drive cycle and it's parameter will be same.
Run the simulation.
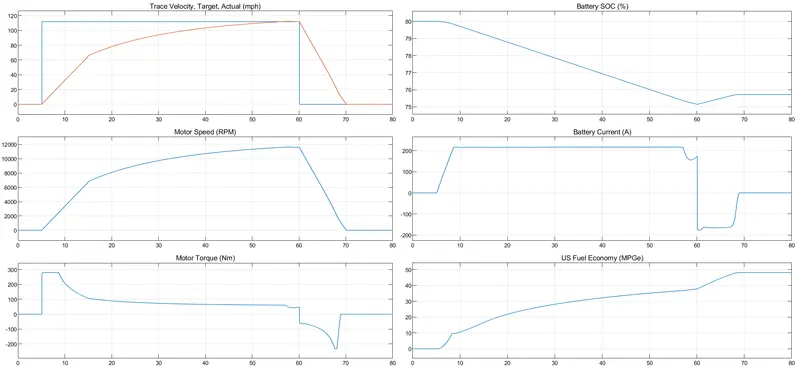
Comparing both the power trains with other condtions same we can conclude following points.
1) The max. speed acheived by Hybrid vehicle ( 128 mph) is more than that of pure electric vehicle (112.8 mph).
2) The motor rpm acheived by HEV (15267 rpm) is more than Pure electric vehicle (11690 rpm)
3) State of charge for Pure elctric vehicle is more ( 80 % - 75.10 %) then HEV (80 % - 60.4%).
4) The fuel efficiency of pure elctric vehicle id more than HEV. (Since conventional engines running on fuel has lesser efficiency)