Week-4 Challenge WOT Condition Part-2
1) What is the difference between mapped and dynamic model of engine, motor and generator? How can you change model type?
1. Engine Models:
Mathematical models: These models are used to represent the behavior of engines in a mathematical form. They can be either empirical (based on experimental data) or theoretical (based on physical principles). Mathematical models can be further categorized into static (mapped) and dynamic models.
Static (Mapped) Models: These models represent engine behavior at specific operating points or conditions. They provide a set of steady-state performance data, such as power output, fuel consumption, and emissions, for different engine speeds and loads. These models are suitable for applications where the engine operates within a narrow range of conditions.
Dynamic Models: Dynamic engine models simulate the transient behavior of an engine over time, taking into account the dynamics of various components (e.g., combustion, thermodynamics, mechanical dynamics). They are used in applications where the engine's response to transient events, such as throttle changes or load variations, is important. Dynamic models often involve complex differential equations.
2. Motor Models:
Electric motors can also be represented using static (mapped) and dynamic models.
Static Models: These models provide a set of performance characteristics, such as voltage-current characteristics, efficiency maps, and torque-speed curves, at specific operating points. Static models are useful for steady-state analysis and design.
Dynamic Models: Dynamic motor models simulate the transient response of a motor to changes in input voltage, load, or other operating conditions. These models are essential for applications involving motor control, such as robotics and electric vehicles.
3. Generator Models:
Generator models can be categorized similarly as static (mapped) and dynamic models.
Static Models: These models provide information on the generator's performance, such as voltage regulation, efficiency, and power output, at specific operating conditions.
Dynamic Models: Dynamic generator models are used to study the generator's response to transient events and variations in load or input. They are crucial for power system stability analysis.
We can switch between mapped and dynamic engines by following below procedures:
Oepn the ev model in simulink.
Enter the passenger car block by double clicking it.
Then go to electric plant block.
Inside the motor block right click to find the variant option.
2) How does the model calculate miles per gallon? Which factors are considered to model fuel flow?
Calculating miles per gallon (MPG) is a simple mathematical formula used to measure the fuel efficiency of a vehicle. The formula for calculating MPG is:
MPG = Miles Driven / Gallons of Fuel Used
To calculate MPG, you need two pieces of information:
Miles Driven: This is the total number of miles a vehicle has traveled during a specific period of time. You can obtain this information by recording the vehicle's odometer reading at the beginning and end of your trip or using a GPS device that tracks your mileage.
Gallons of Fuel Used: This is the total amount of fuel consumed by the vehicle during the same period. You can obtain this information by recording the amount of fuel you put into the vehicle's gas tank before and after your trip.
Once you have these two values, simply divide the number of miles driven by the number of gallons of fuel used to get the MPG. For example, if you drove 300 miles and used 10 gallons of fuel, your MPG would be:
MPG = 300 miles / 10 gallons = 30 MPG
A higher MPG value indicates better fuel efficiency, meaning that the vehicle can travel more miles on a gallon of fuel, which is generally desirable for both cost savings and environmental reasons. However, actual MPG can vary based on driving conditions, such as city or highway driving, the vehicle's make and model, and driving habits.
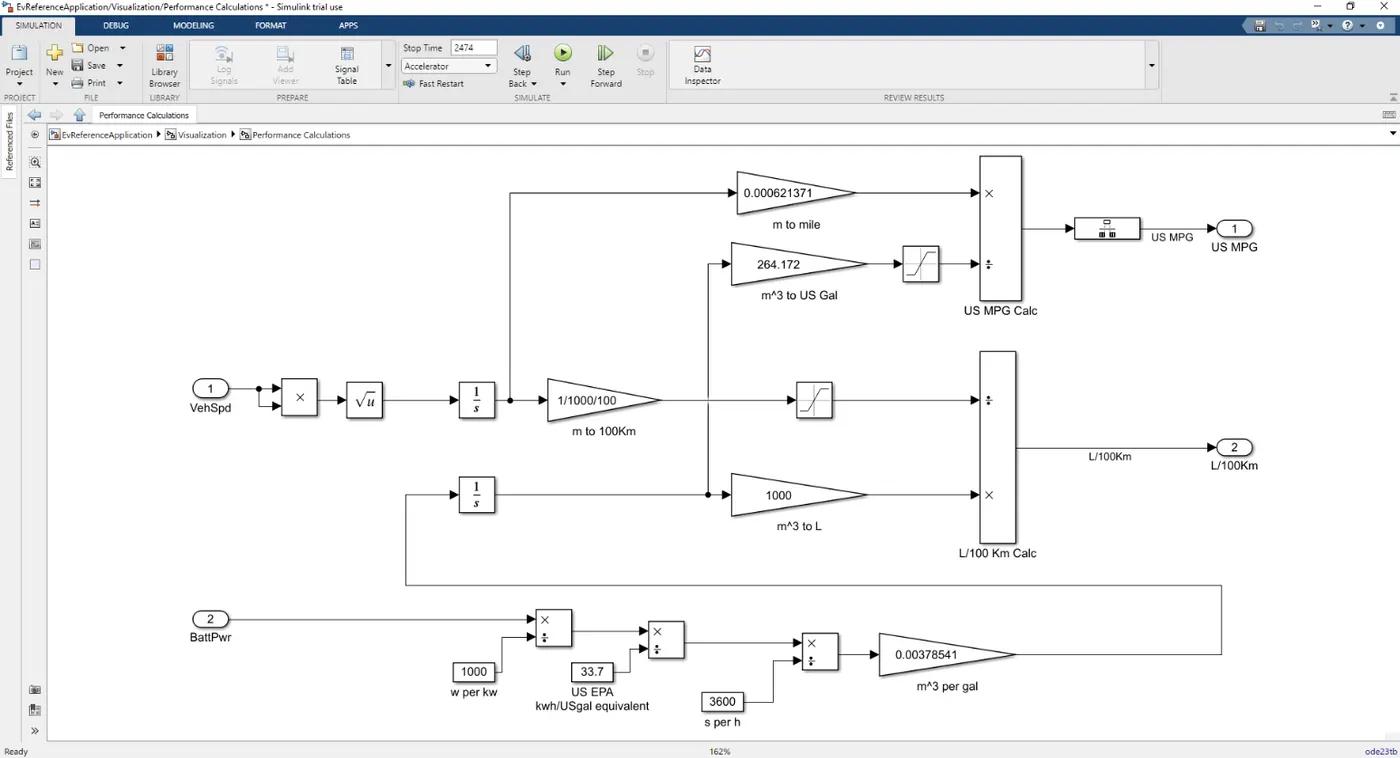
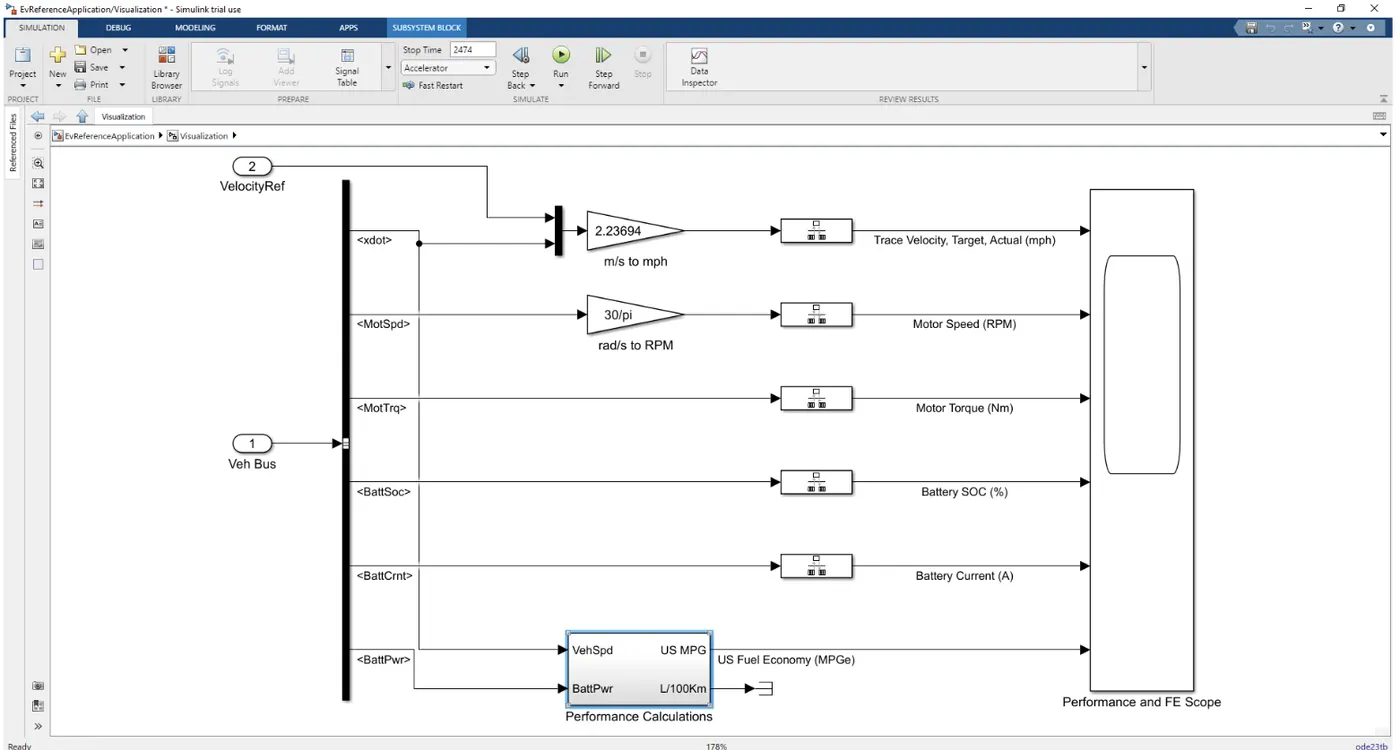
Here,three different inputs are taken into considerations:
1.vehicle speed.
2.fuel flow.
3.battery power.
The vehicle speed inputs is in m/s which is converted into miles by multiplying with 0.000621371.
similarly the kilogram of fuel is converted into cubic meter by multiplying by1/(1000*0.739)
this cubic meter value is then converted into gallons by multiplying it with 264.172.the mile value and gallon value is used to find mpg of the vehicle.
now the battery value is initially converted from watts to kwh by dividing with 1000 and then to gallon equivalent by again dividing it with 33.7(sincw 33.7 kwh=1 gallon)
then divide the value by 3600 to get in per seconds and multiply by 0.00378541nto get the value in cubic meter per gallons.
3) Run the HEV ReferenceApplication with WOT drive cycle. Change the grade and wind velocity in the environment block. Comment on the results.
we have changed drive cycle to wot with a sample time 40 seconds.
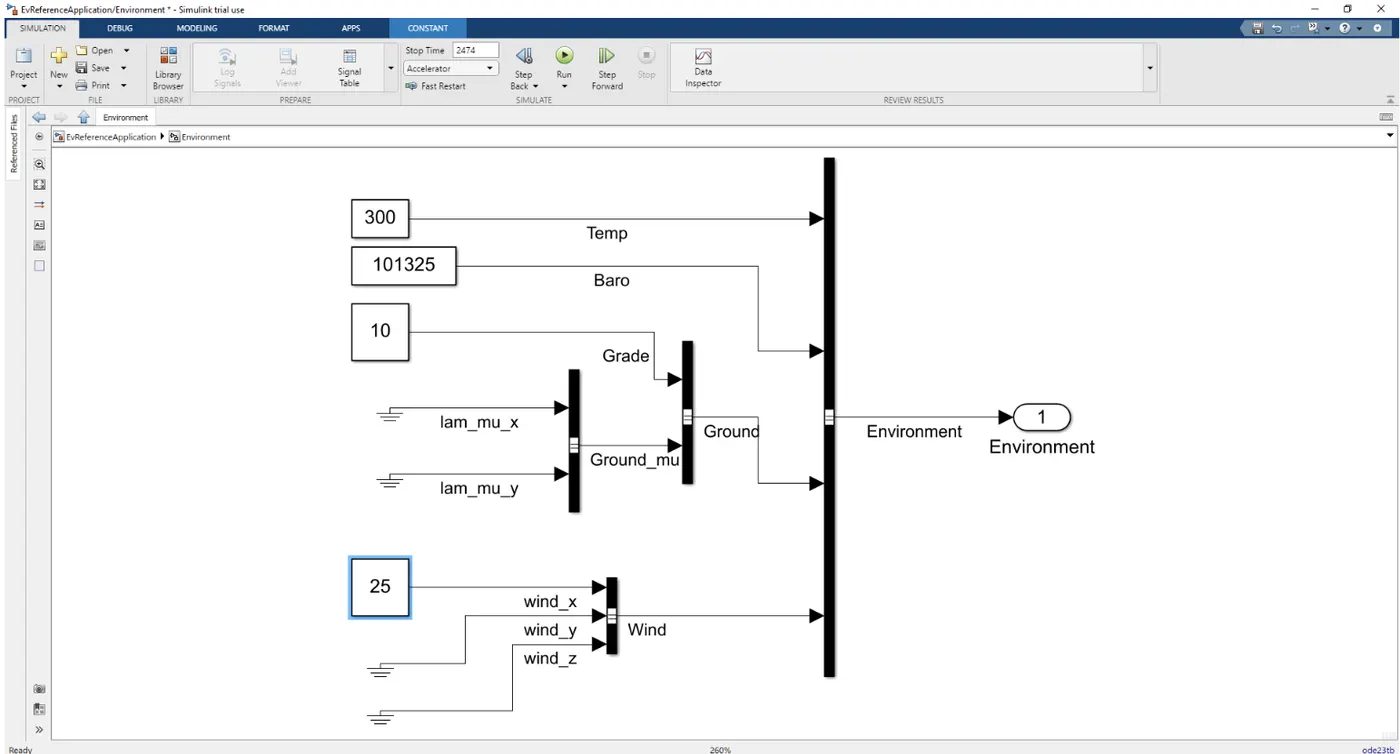
we have also altered environment block and changed wind speed to 25 m/s & grade to 10.
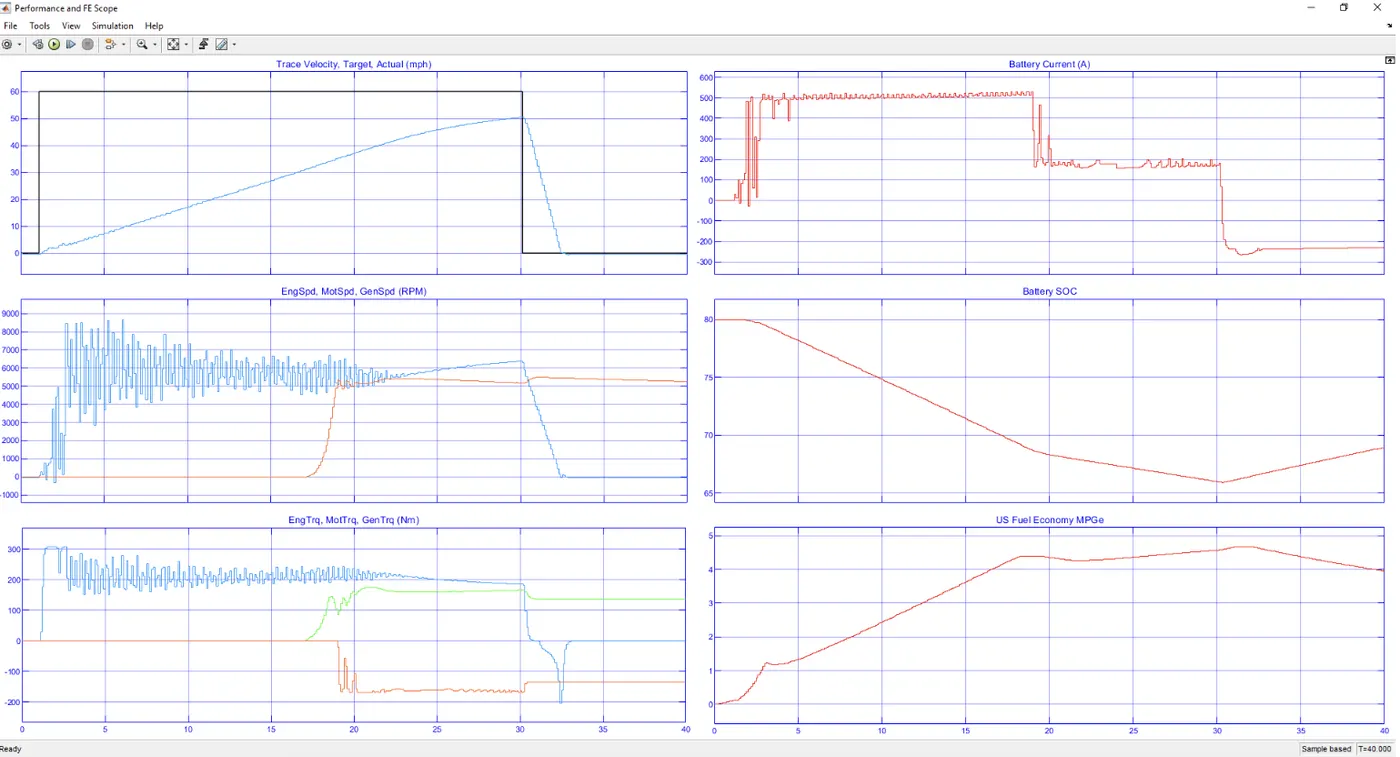
From the above graphs we can see that,
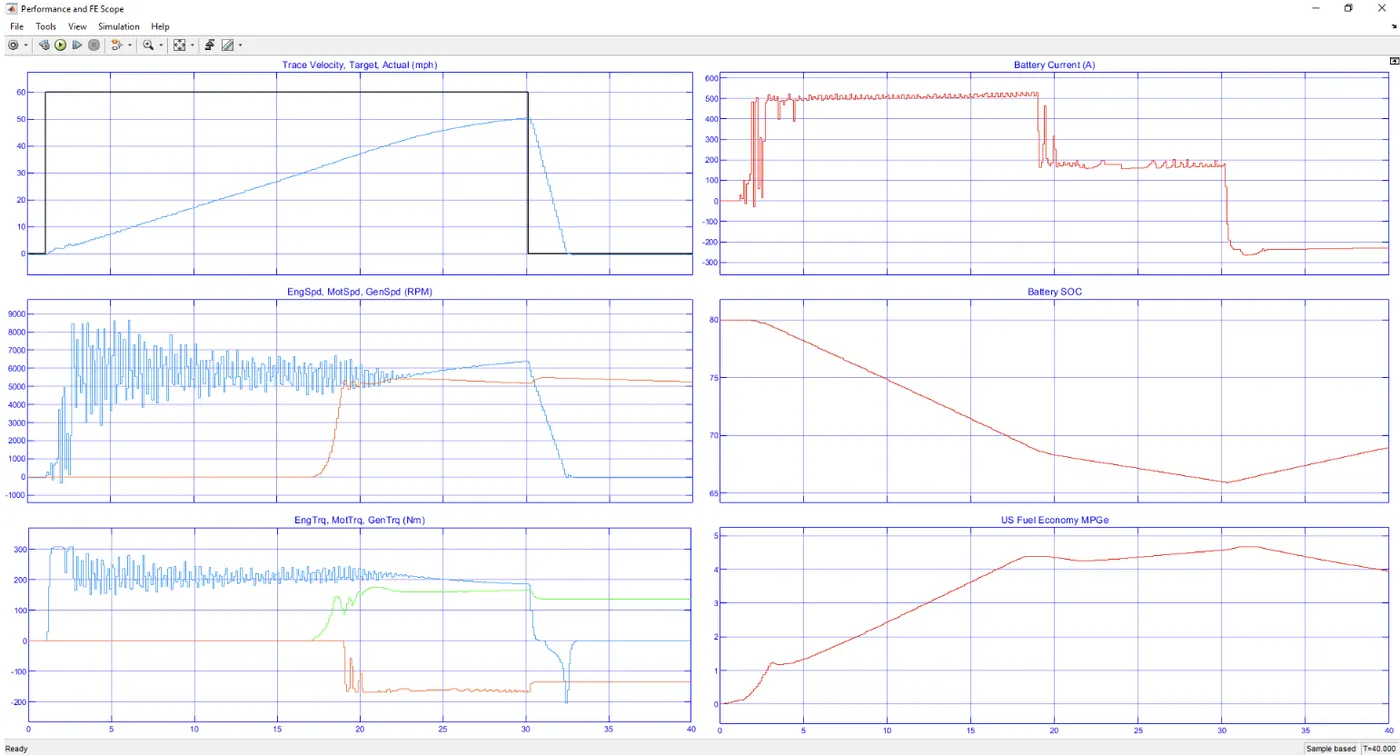
Trace Velocity target and actual graph: The yellow line indicates the desired path and blue line is the actual path. So, it can be seen that battery power is not enough to meet the requirements of the grade and wind velocity.
Battery Current Graph: When the vehicle is accelerating the battery current is also increasing. When the velocity is constant the current requirement also becomes constant. When the deceleration starts the battery current becomes negative indicating regenerative braking.
Battery SOC: The battery SOC keeps on depleting until regenerative braking starts. This increases the SOC.
Engine, Motor and Generator Speed: Initially only motor is used to start the vehicle as motor has high initial torque. Later generator kicks in charging the battery when SOC drops below 70%. Engine graph can't be seen as it may have overlapped with generator.
Engine, Motor and Generator Torque: Motor torque is high initially and then engine kicks in at a later stage. Generator torque is negative as its charging the battery.
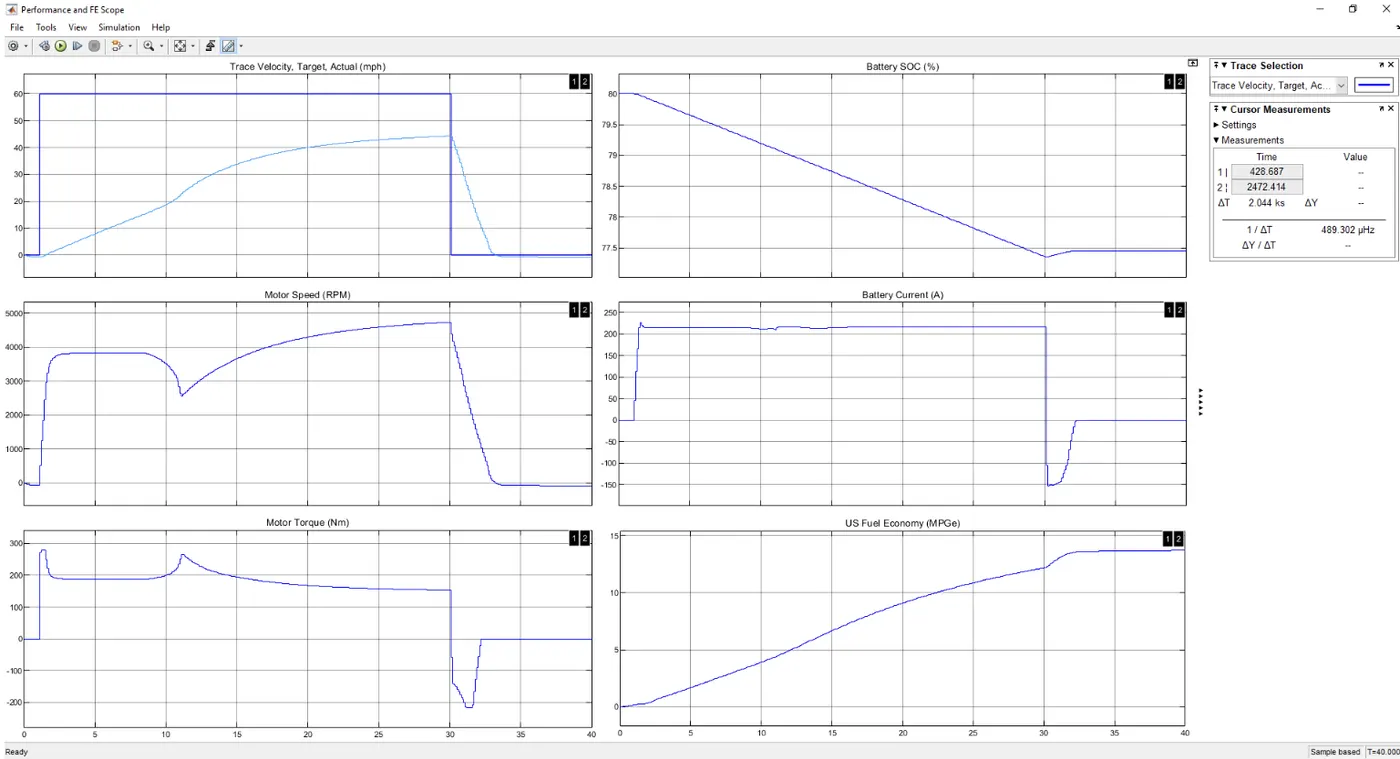
4) Keeping all other parameters same, compare the simulated results of hybrid and pure electric powertrains.
- Result of EHV
- Result of EV
Conclusion:
- The battery current capacity of pure EV is much higher compared to that of HEV since in EV battery is the only driving unit.
- The top speed is achieved by hybrid electric vehicle is more than that of EV.
- Higher fuel economy is achieved in case of pure EV.