Week-4 Challenge WOT Condition Part-2
1) The difference between mapped and dynamic model of engine, motor and generator is as follows:
Mapped model :
To run the simulation with predefined commands and set of look up tables, mapped model is selected. Mapped model simulation takes less time to simulate. Mapped model simulation can also be known as static model simulation since, it does not involve the real-time outputs from the subsystems.
Dynamic model :
To run the simulation with the actual model, dynamic model is selected. Dynamic model involves the real-time outputs from all the subsystems to simulate. Since considering all the subsystems, the accuracy of this model is better than the mapped model simulation. Dynamic model simulation takes more time to simulate than the mapped model simulation.
To change the model type :
At first the type of vehicle is selected then, run the reference application using the command window in Matlab. In the simulink window, open the electric plant block which will be inside the passenger car block.
If the selected type is pure electric vehicle then, right click the MotGenEvMapped block.
Choose, Variant-->Label mode active choice --> MotGenEvMapped/MotGenEvDynamic
If the selected type is hybrid electric vehicle then, the model of motor and generator can be changed seperately
To change the model type of the generator, right click on the generator block then
choose, Variant --> Label mode active choice --> GenDynamic / GenMapped
To change the model type of the motor, right click on the motor block then
choose, Variant --> Label mode active choice --> MotDynamic / MotMapped
2) The factors which are considered to calculate the mile per gallon value for a pure electric vehicle are vehicle speed and battery power as shown in the simulink model below:
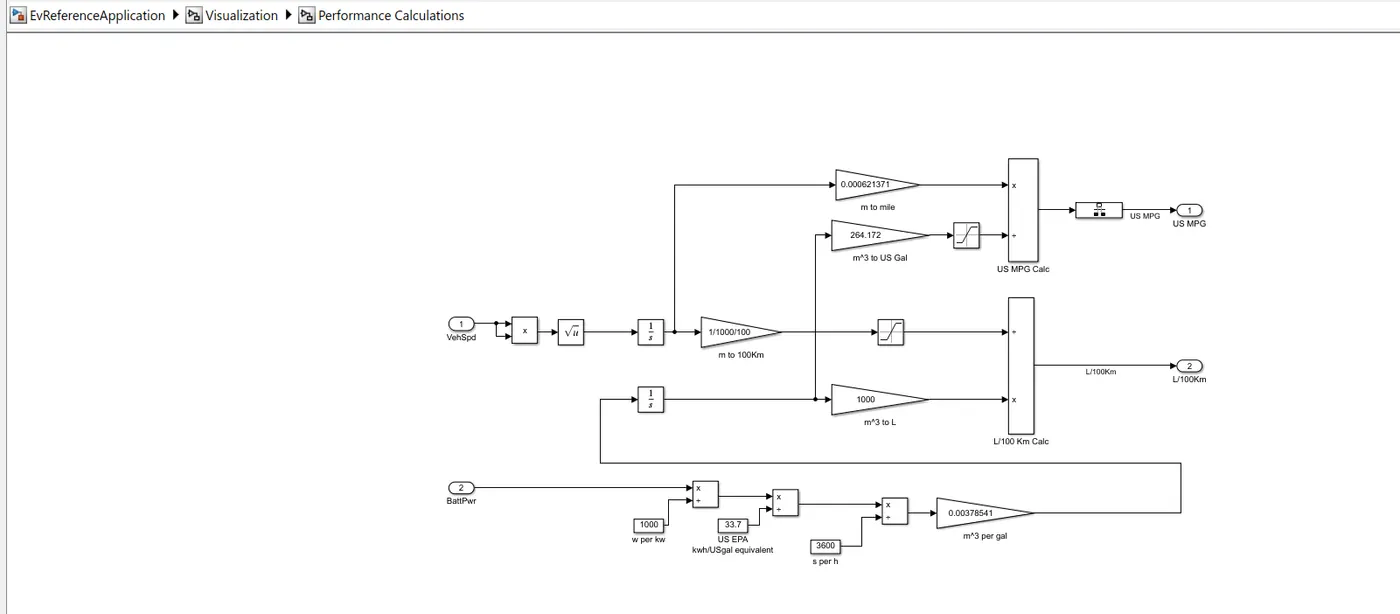
The vehicle speed is integrated to get the value of distance covered in meters. This value is then converted to mile and kilometre. The battery power in watt is converted into m^3 per gal, which is then integrated and converted into US Gallon and Litre. The US Gal value is used to divide the distance covered in mile to get the US MPG (miles per gallon) value of the vehicle. The Litre value is used to divide the distance covered in km to get the L/100 km value of the vehicle.
The factors which are considered in calculating the miles per gallon value for the HEV vehicle are vehicle speed, fuel flow and battery power as shown in the simulink model below:
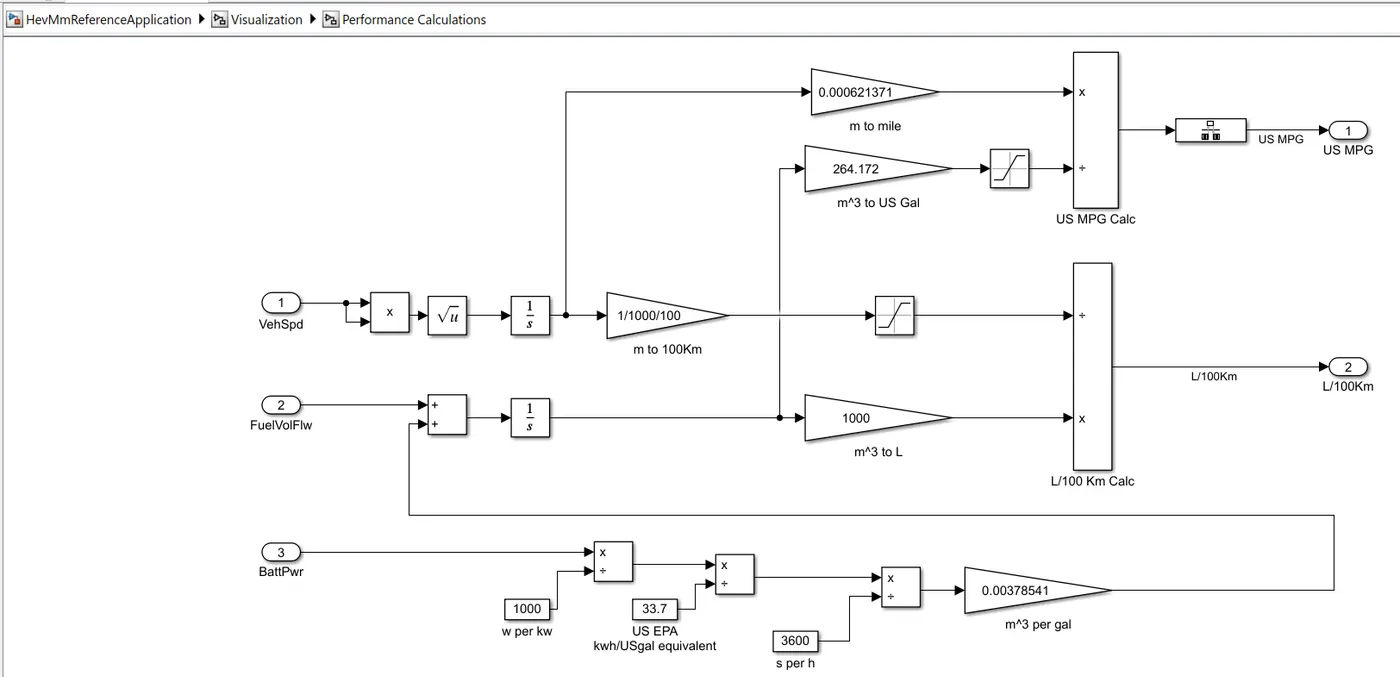
The vehicle speed is integrated to get the value of distance covered in meters. This value is then converted to mile and kilometre. The battery power in watt is converted into m^3 per gal, which is then summed with fuel flow and then integrated. This integrated value is converted into US Gallon and Litre. The US Gal value is used to divide the distance covered in mile to get the US MPG (miles per gallon) value of the vehicle. The Litre value is used to divide the distance covered in km to get the L/100 km value of the vehicle
In this way the miles per gallon is calculated for various models.
3) The HEV ReferenceApplication simulink model is as follows:
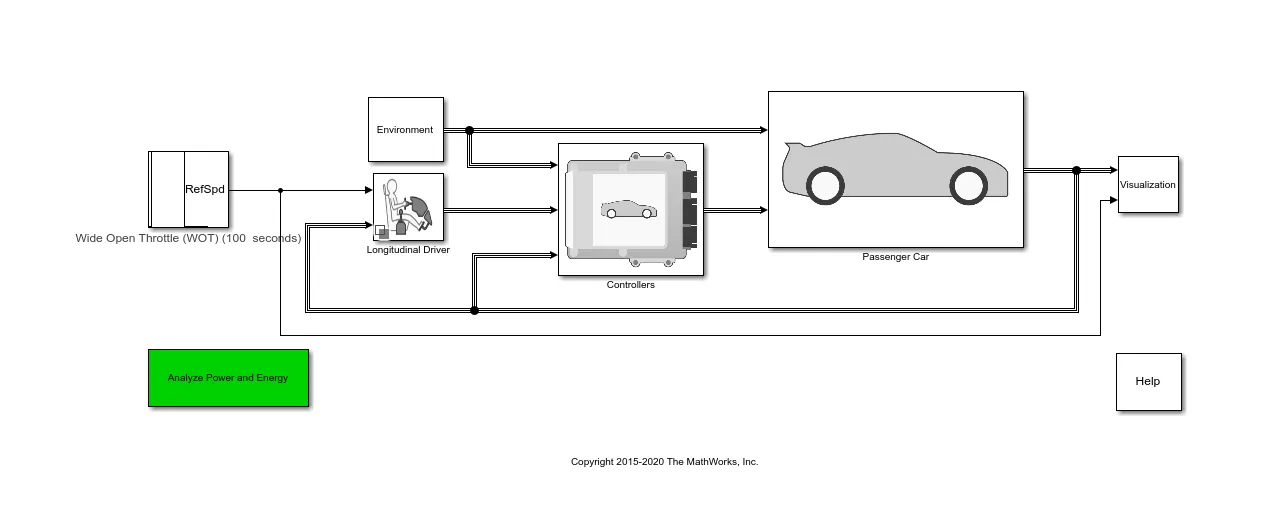
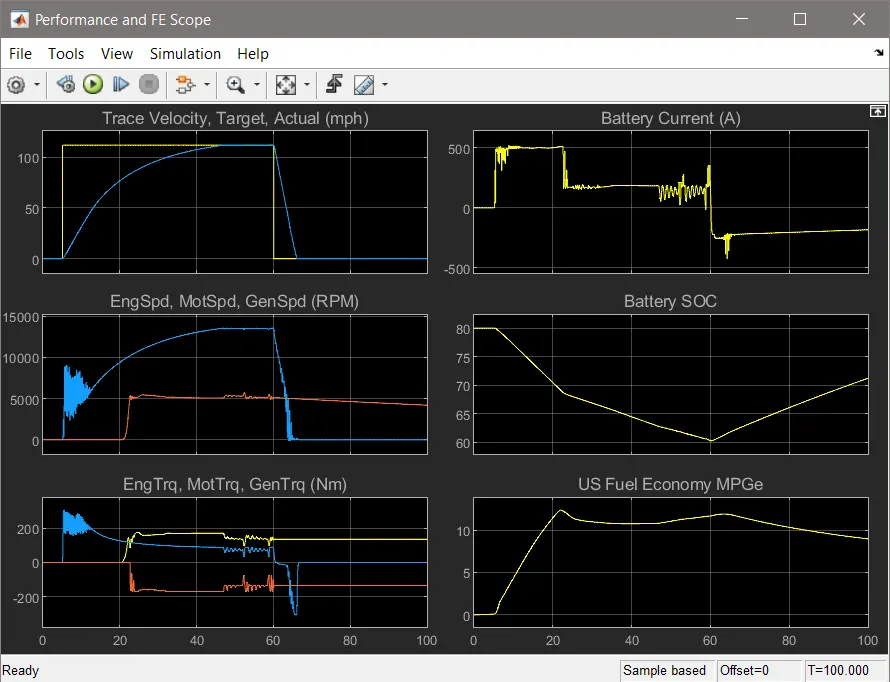
The HEV ReferenceApplication with WOT drive cycle without any change in the grade and wind velocity in the environment block results is as follows :
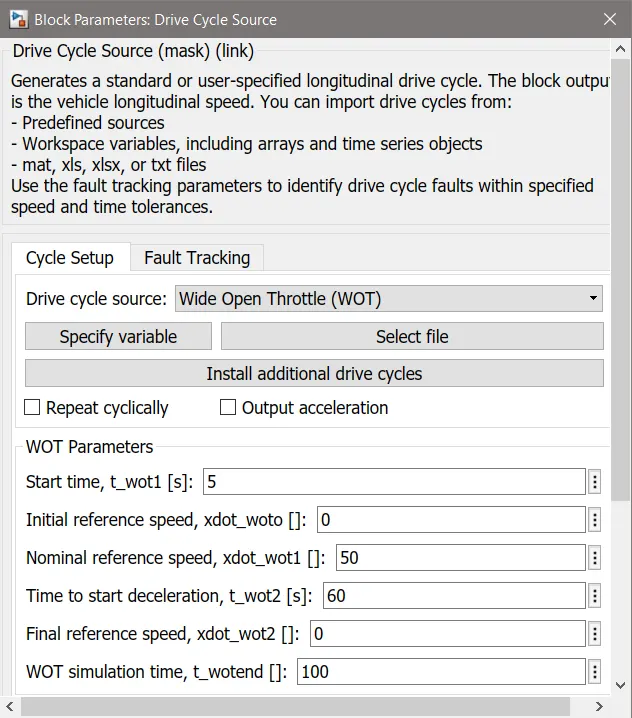
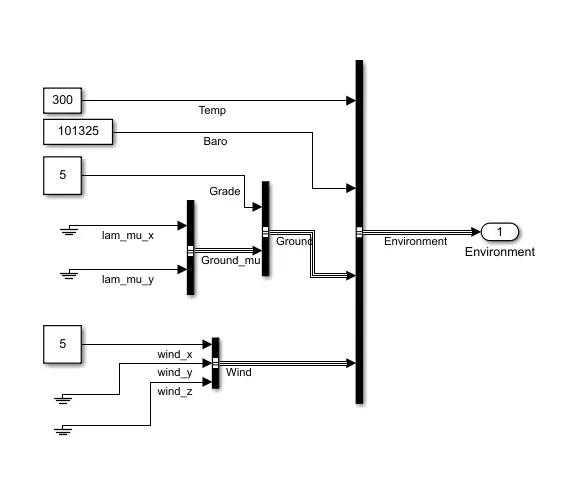
The HEV ReferenceApplication with WOT drive cycle with change in the grade and wind velocity in the environment block results is as follows :
>The Grade value is set to 5 degrees
>The wind velocity is set to 5 m/s in x axis direction
>Other parameters remains unchanged
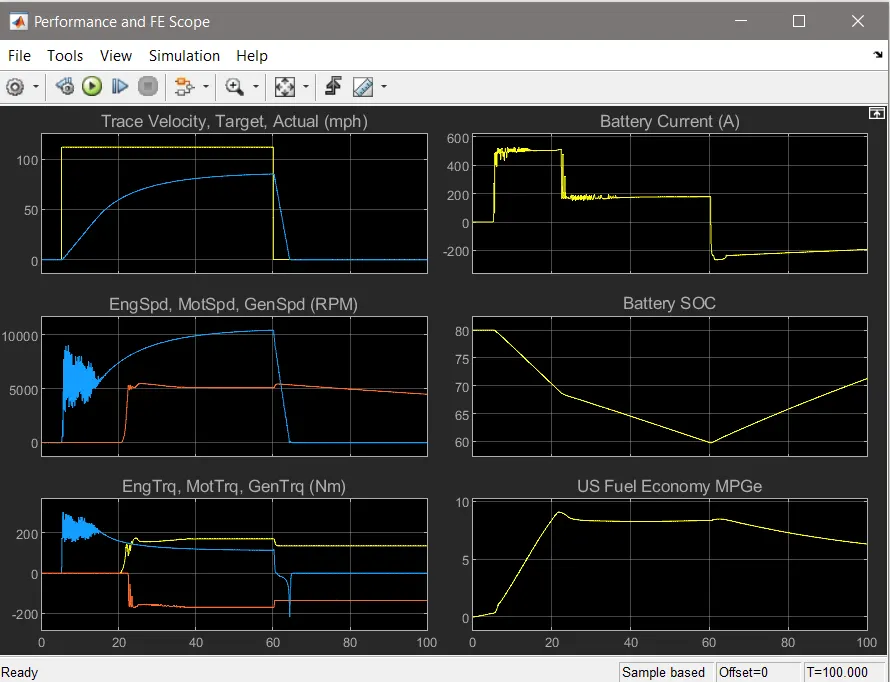
From the various graphs we could conclude the following results as follows:
| HEV Simulation in WOT codition with and without environmental change | ||
| Parameters | Without change | With change |
| Grade in degree | 0 | 5 |
| Wind velocity (m/s) | 0 | 5 |
| Top speed (mph) | 112 | 85.1 |
| Acceleration time (sec) | 42.3 | 55 |
| Deccelaration time (sec) | 7.5 | 5.31 |
| Initial SOC | 80 | 80 |
| SOC at end of acceleration | 60.06 | 60.03 |
| SOC at end of simulation | 72.08 | 71.7 |
| Max fuel economy | 12.04 | 9.17 |
| Min fuel economy | 7.18 | 5.11 |
Therefore, the vehicle with lower degree grade and lower wind velocity,
>Can reach high speed in short amount of time.
>Have high fuel efficiency.
>Have high deceleration time.
>Have better SOC.
4) The EV ReferenceApplication simulink model is as follows:
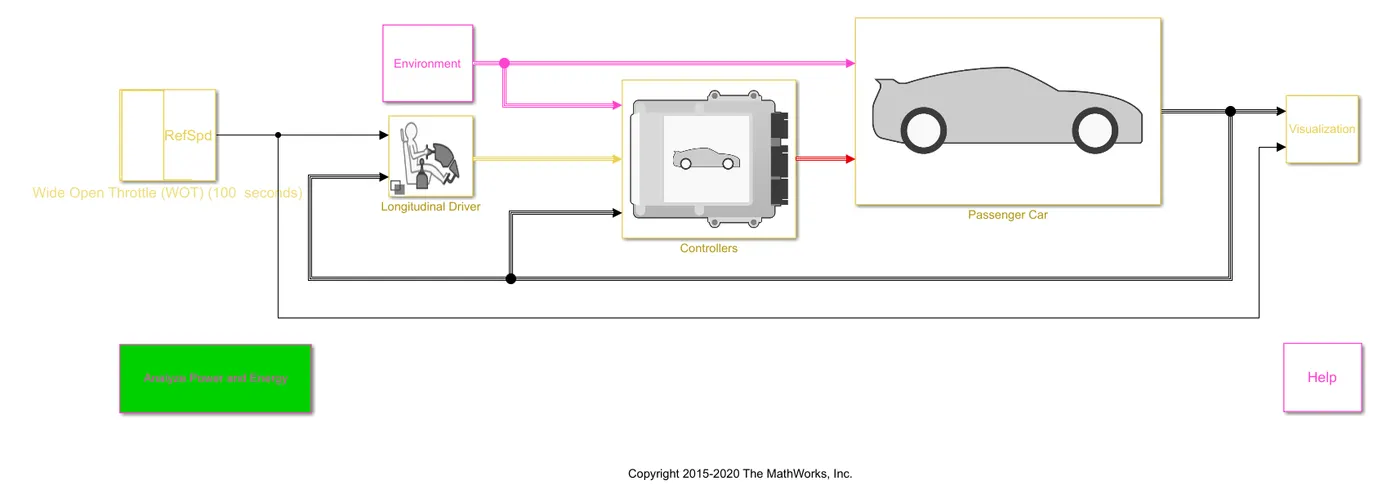
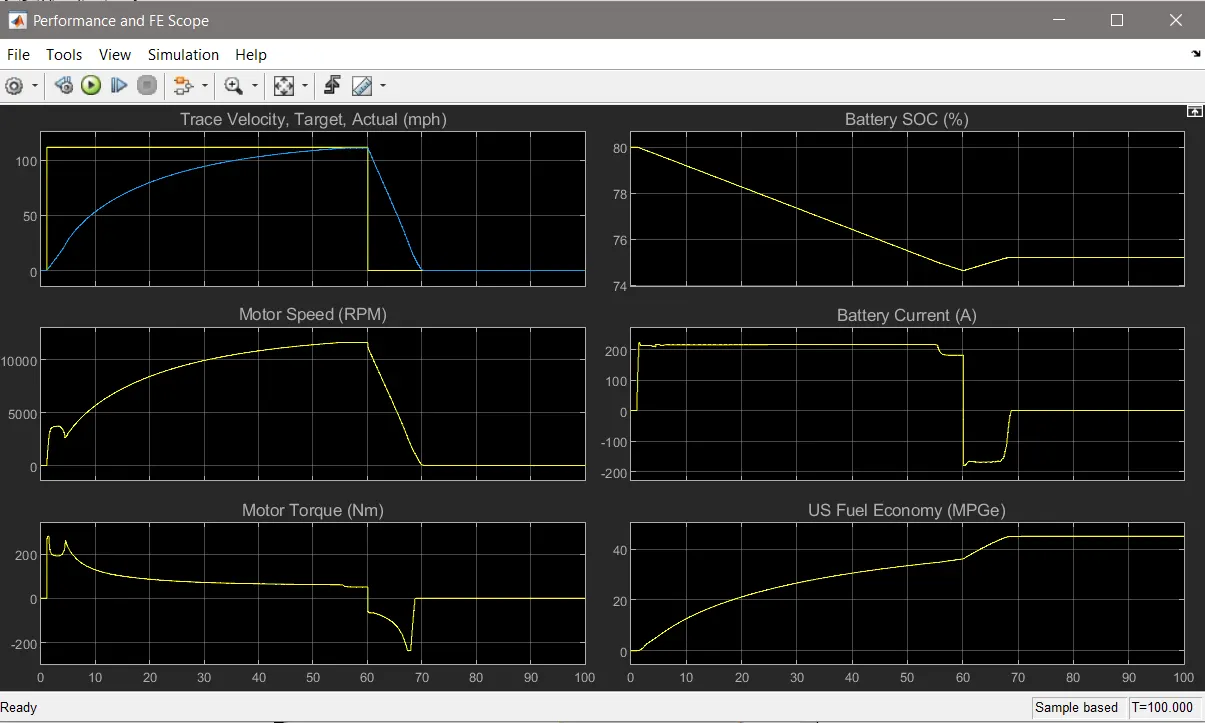
Similar to HEV, the EV ReferenceApplication with WOT drive cycle without any change in the grade and wind velocity in the environment block results is as follows:
Similar to HEV. the EV ReferenceApplication with WOT drive cycle with change in the grade and wind velocity in the environment block results is as follows :
>The Grade value is set to 5 degrees
>The wind velocity is set to 5 m/s in x axis direction
>Other parameters remains unchanged
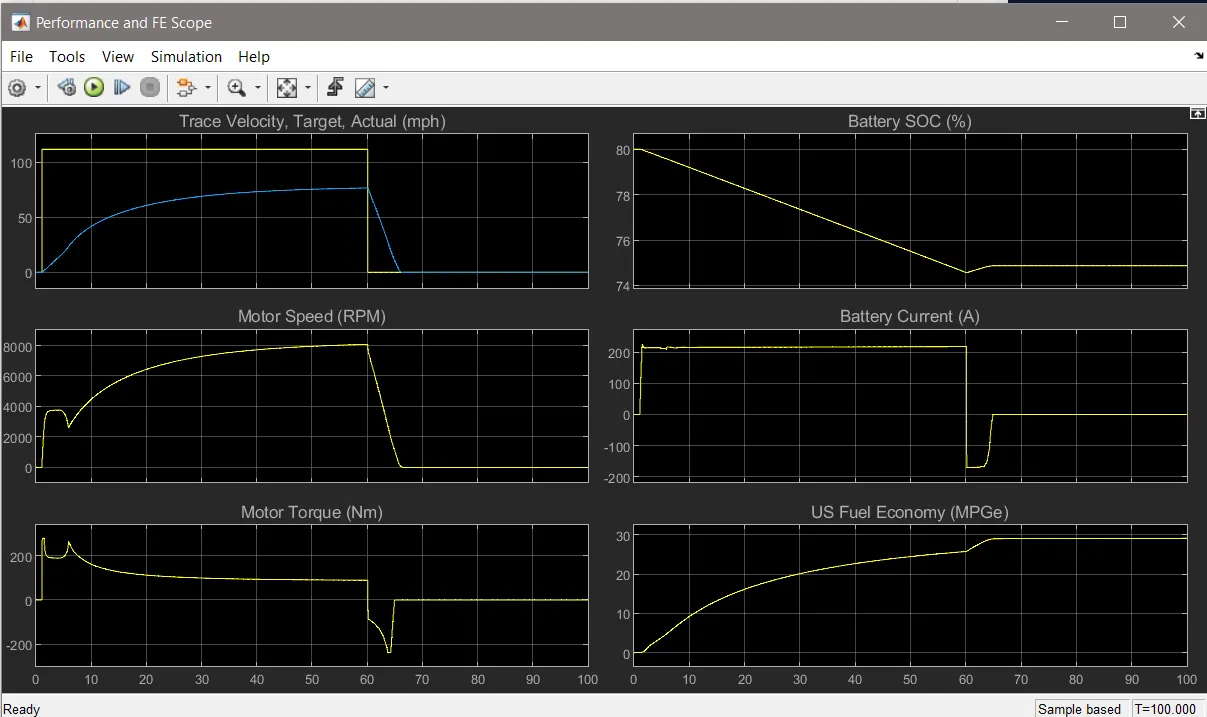
From the various graphs we could conclude the following results as follows:
| EV Simulation in WOT codition with and without environmental change | ||
| Parameters | Without change | With change |
| Grade in degree | 0 | 5 |
| Wind velocity (m/s) | 0 | 5 |
| Top speed (mph) | 111.4 | 76.36 |
| Acceleration time (sec) | 55 | 55 |
| Deccelaration time (sec) | 10 | 6 |
| Max motor speed (rpm) | 11670 | 8046 |
| Initial SOC | 80 | 80 |
| SOC at end of acceleration | 74.94 | 74.94 |
| SOC at end of simulation | 75.5 | 75.23 |
| Max fuel economy | 44.3 | 28.8 |
| Min fuel economy | 34.95 | 25.36 |
>Can reach high speed in short amount of time.
>Have high fuel efficiency.
>Have high deceleration time.
>Due to high deceleration time, the recharging time of battery is also high
>Therefore better SOC
When the HEV and Pure results are compared, it is clearly seen that
>HEV and EV without changed parameters have approximately equal top speeds. Since there is no opposing environmental forces
>HEV has good acceleration time. Since it has both motor and a engine.
>HEV with changed environment parameters has the lowest deceleration time.
>Pure EV with unchanged environment parameters has the longest deceleration time.
>Initial SOC of all the vehicles are same.
>At the end of acceleration EV has better SOC compared to the HEV simulation.
>SOC at the end of all the simulations is approximately equal.
>Pure EV without changed parameters has high fuel economy when compared to other simulations.
>HEV with changed parameters has the lowest fuel economy.