Week-4 Challenge WOT Condition Part-2
1)
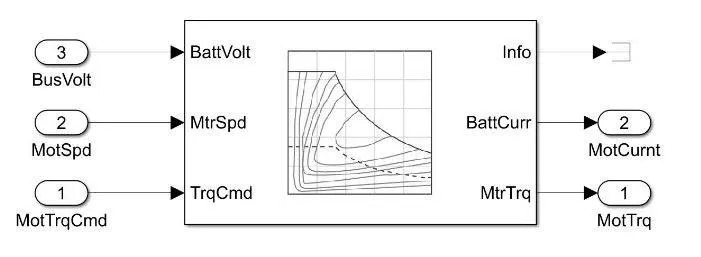
MAPPED ENGINE:
- It is used of steady state lookup tables to characterise the engine performance. The tables provide overall engine characteristics, including actual torque, fuel flow rate and engine out exhaust emissions.
- Most of components are modelled by staedy state maps and charts in backward facing modelling approach, therefore energy consumption and performance of different components during transient periods of drive are not calculated correctly. It is also known as backward facing approach.
- It is suitable for analysis & design activities that do not require engine subsystem dynamic characteristics. For e.g; engine and powertrain transmission analysis for fuel economy, emissions & performance tradeoffs.
Engine mapping is a process carried out in the auto industry with the aim of modelling engine outputs as functions of engine inputs; output variables are often torque and noxious emissions, while input variables include spark, rpm, load (fuel flow rate), airfuel ratio and exhaust gas recycling ratio.
BLOCK DIAGRAM:
DYNAMIC ENGINE:
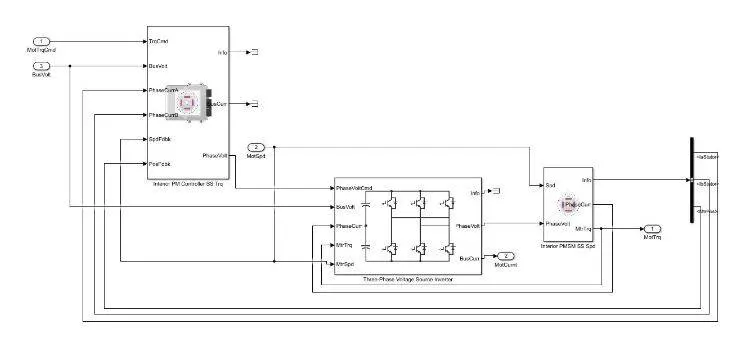
- It decomposes the engine behaviour into engine characteristics thst are seperated into lower level components. By combining the components the model may capture dynamic effects.
- This model are suitable for designing control,estimator & diagnostic alogorithms that depend on dynamic subsystem. For e.g; in closed loop AFR alogorithm development. It is also known as forward facing approach.
- It demands for torque, current & voltage which has been compared with actual variables of the system & with the help of controllers error may occured due to minimization of desirable performance.
BLOCK DIAGRAM:
2)
MPG, or miles per gallon, is the distance, measured in miles, that a car can travel per gallon of fuel. MPG is also the primary measurement of a
car's fuel efficiency: The higher a car's MPG, the more fuel-efficient it is.
The U.S. Environmental Protection Agency, or the EPA, is the government agency responsible for certifying a vehicle's MPG figures, notes How
stuffs works.
A car's MPG can be inconsistent because it is affected by a number of different factors, so it is difficult to get an accurate measurement. For
example, factors like traffic and road conditions can affect MPG in any given context. That's why the EPA runs tests over a standard set of
courses, then averages the results to calculate a vehicle's official MPG.
The EPA gives each vehicle three different MPG ratings, as All Car Leasing notes:The EPA gives each vehicle three different MPG ratings, as All Car Leasing notes:
1.Highway MPG: the average a car will get while driving on an open stretch of road without stopping or starting, typically at a higher speed.City 2.MPG: the score a car will get on average in city conditions, with stopping and starting at lower speeds.
3.And, combined MPG, a combined average of highway and city MPG.
While MPG can help you compare different vehicles, it doesn't tell you anything about real-world fuel prices. However, you can easily calculate
approximately how much you'll spend on fuel at different price levels, depending on how much distance you drive on a regular basis.
How does the model calculate miles per gallon?
-To calculate the fuel flow, vehicle speed & battery power are taken into consideration.
HEV model has separate blocks to calculate the MPG Which are shown below.
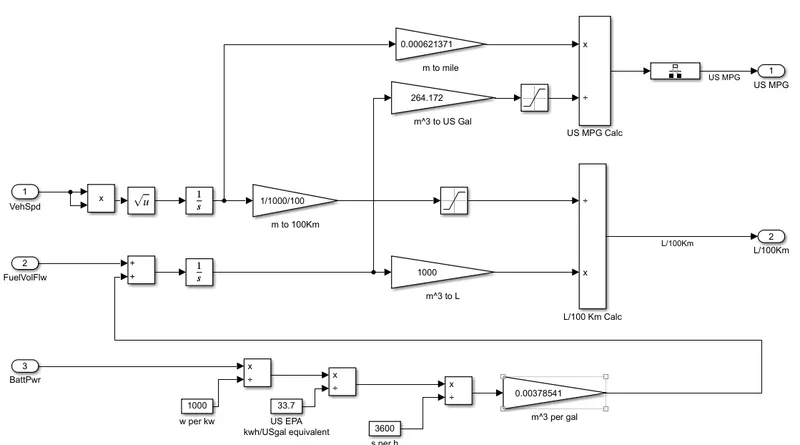
The above snap shows the Simulink model built to shows the fuel economy in Miles per Gallon using the vehicle speed, fuel flow velocity and
the battery power. The HEVs use both fuel and battery power.
- The vehicle speed is integrated with time to determine the distance and converts the distance in miles by multiplying with 0.000621371.
- The battery power is converted to kWh by dividing it with 1000 and the then it is divided with 33.7 (standard value) to convert it into kWh
to kWh/USgal then the value is divided by 3600 so the resulting value will be in m^3 then ot will be converted to m^3/gal by multiplying
it with 0.00378541 and the resulting value from this block will be added with the fuel flow velocity. - The fuel flow velocity is added with the value from ‘m^3 per gal’ then it is integrated and multiplied with 264.172 such that the resulting
will be in US Gallon. - Finally, dividing the distance (in miles) by fuel flow (in US Gal) we get the US MPG.
The following are factors which are considered to model fuel fuel.
-Vehicle speed
-Fule flow
-Battery powerW2
3)
HEV Reference Application model:-
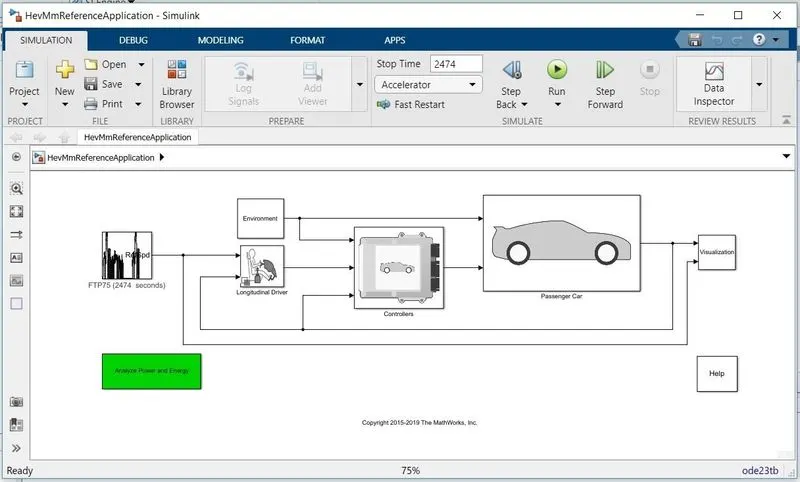
Description:-
1) Open ‘HEV Reference Application’ model in MATLAB.
2) It consist of various subsystems which are simular to ‘EV Reference Application’ but the complexity is more in ‘HEV Reference Application’ model.
Case 1:-
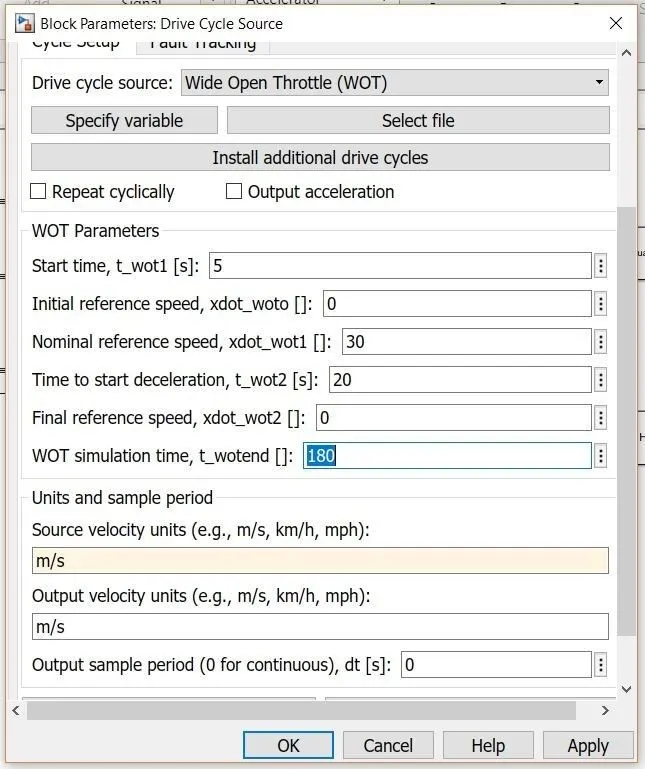
The default drive cycle is FTP75 with 2474 sec. Now change it to WOT drive cycle as below with WOT simulation time as 180 sec and click on 'OK'.
Result:-
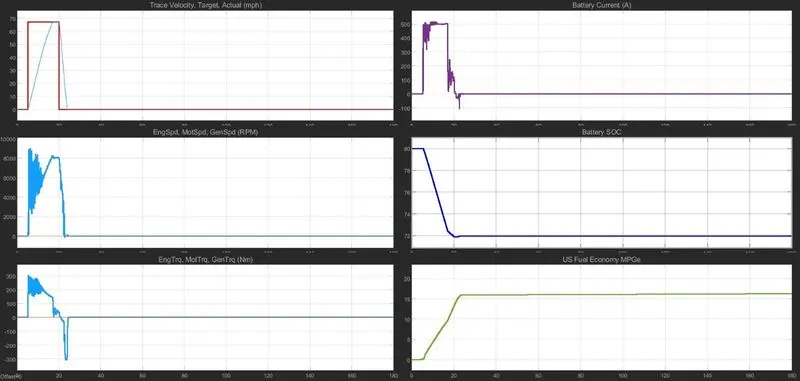
1) The target velocity actual was able to achieve 67.1 mph.The battery current was increased upto 500 Amp and maintained for a duration of 14 sec.
2)Engine speed is able to achieve 8000 RPM and battery State of Charge(SOC) was decrease from 80 to 72.
3) Engine torque increases intially and goes to negitive after 20th second and the peak torque achieve was around 275 Nm. The fuel economy was increased from 0 to 16 and remains constant.
Graph 1:-
Case2:-
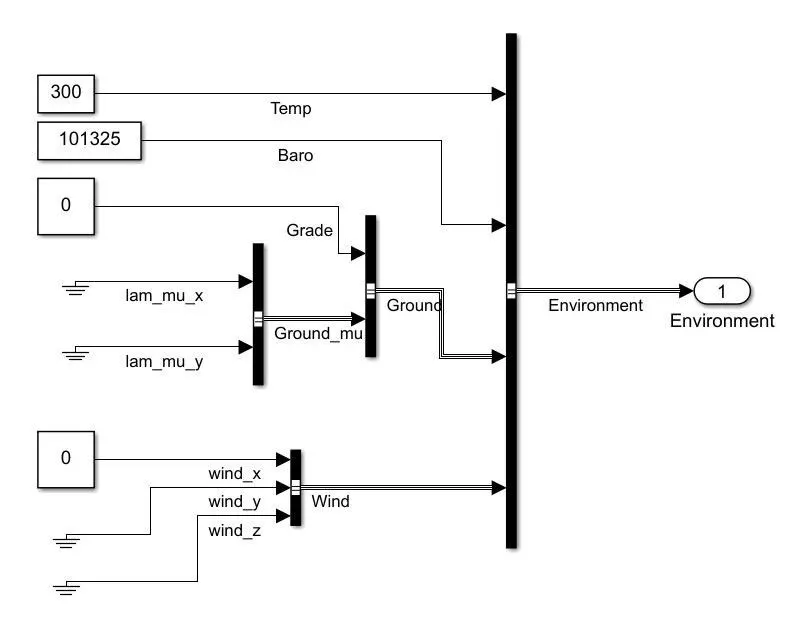
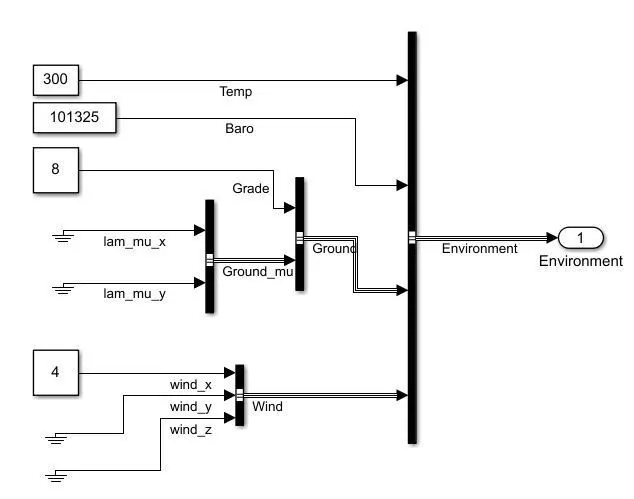
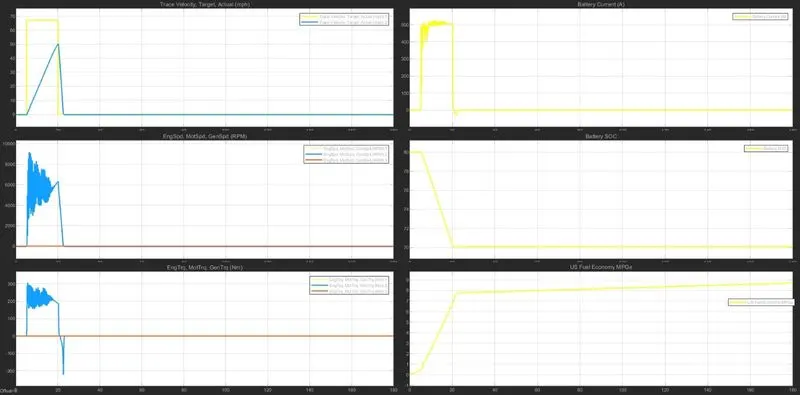
Now changing the Environment sub-system in case1 specification of HEV reference application. The grade was now changed from 0 to8 and wind velocity from 0 to 4.
Graph 2:-
Result:-
1) The target velocity actual was only able to achieve 50.4 mph.The battery current was increased upto 500 Amp and maintained for a duration of 14 sec.
2)Engine speed was able to achieve 8000 RPM but for a small duration of time and battery State of Charge(SOC) was decrease from 80 to 70.
3) Engine torque increases intially and goes to negitive after 20th second and the peak torque achieve was around 275 Nm. The fuel economy was increased from 0 to 8.7 and remains constant.
Solution 4 :-
Case 1:- HEV Multimode Reference Application
1) open Hev Reference Application model in MATLAB.
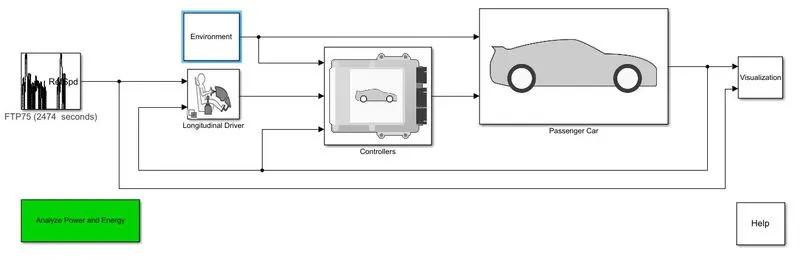
2) The model consist of Environment, Drive cycle, Longitudinal Driver passenger and visualisation Subsystem.
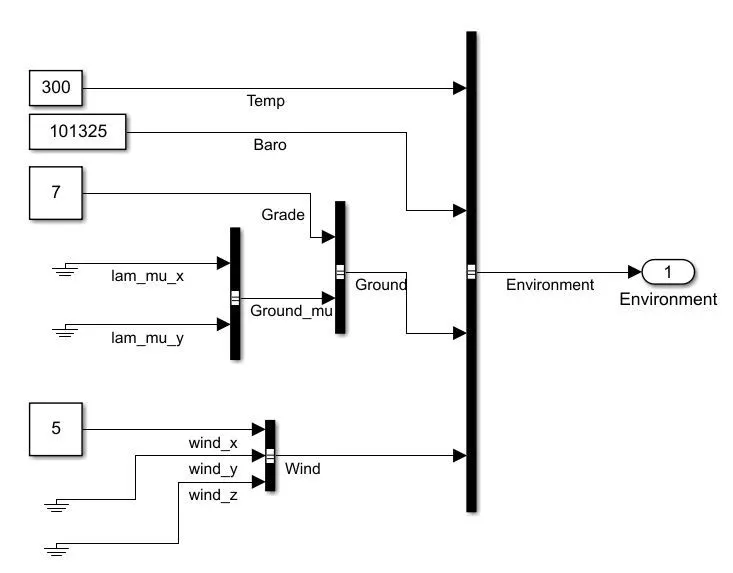
3) open the environment block and change the grade value to 7 and wind velocity to 5.
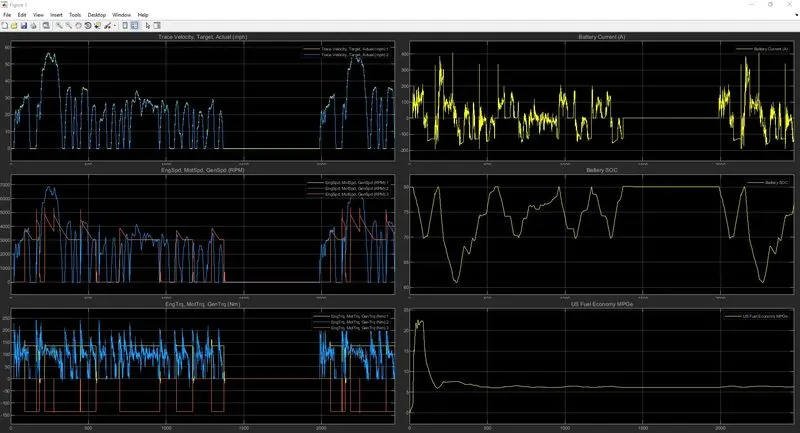
4) Now run the simulation with 2474 seconds and go to visualisation to see the graph.
Model:-
Graph :-
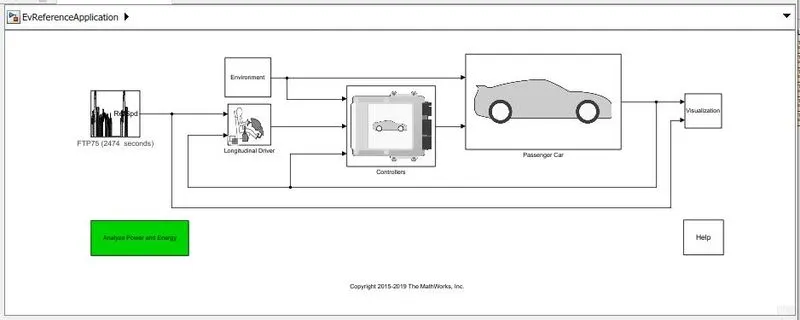
Case 2:- EV Reference application model
1) open Electric Vehicle Reference Application model in MATLAB.
2) The model consist of Environment, Drive cycle, Longitudinal Driver passenger and visualisation Subsystem as similar to HEV but as it is a pure electric vehicle the complexity in the model is less and the rendering time is less.
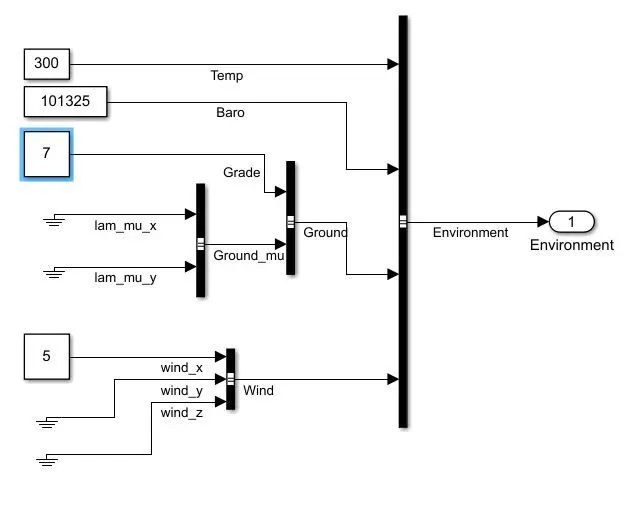
3) open the environment block and change the grade value to 7 and wind velocity to 5.
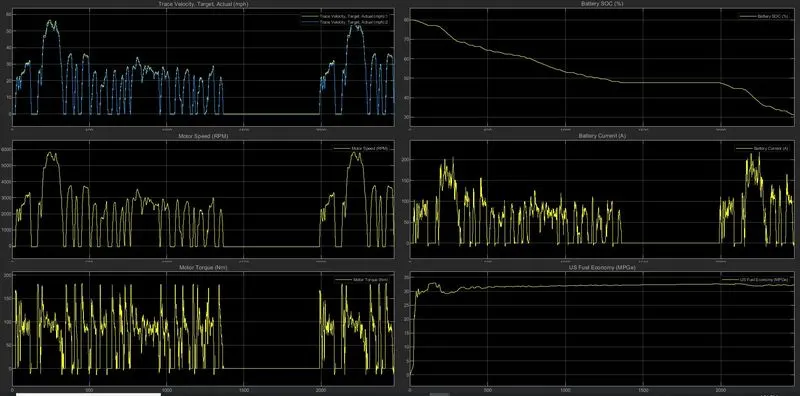
4) Now run the simulation with 2474 seconds and go to visualisation to see the graph.
Model:-
Result Graph:-
Conclusion :-
1) Battery current is continuesly changing in HEV due to charging and discharging while in pure EV the battery current is consistanty dropping.
2) The US fuel economy is high in EV compared to HEV , traveling cost is less for EV.
3) The motor speed (RPM) is high for HEV compared to EV.