Project - Data Handling and Interpolation
data=readmatrix('VI.xlsx');
% read data from VI Excel file
V=data(:,1);
%V is voltage data
I=data(:,2);
%I is the current
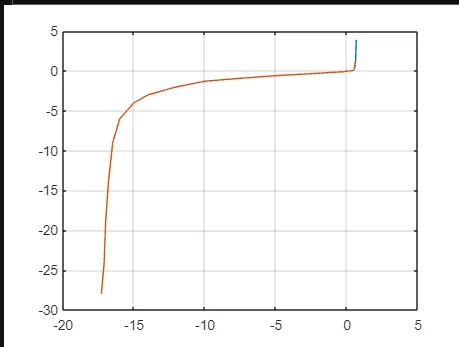
xq=-17.3:0.1:0.9;
% interpolation data range
vq=interp1(V,I,xq);
plot(V,I);
%plotting the graph
hold on
grid on
plot(xq,vq);
%plot interpolated data
diary VI.txt