Week-4 Challenge WOT Condition Part-2
1.
Mapped Models
* Mapped models are used where the inputs to the systems are not in our intrest but with the predefind or from a look up table.
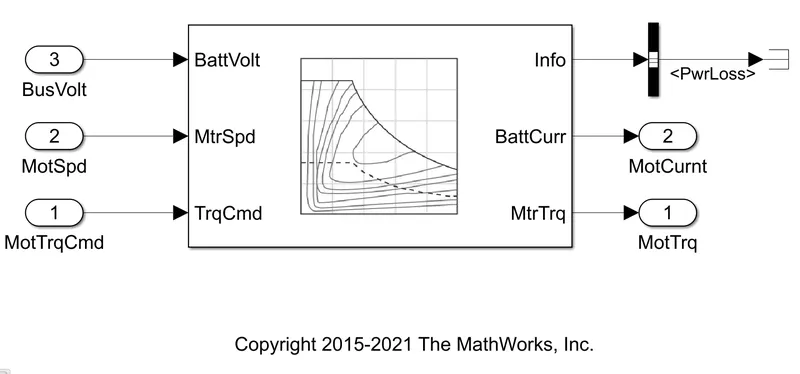
* Above block represents the mapped model of a motor. Which takes the inputs like BusVolt,MotSpd and MotTrqCmd as in the form of look up tables.
Dynamic Models
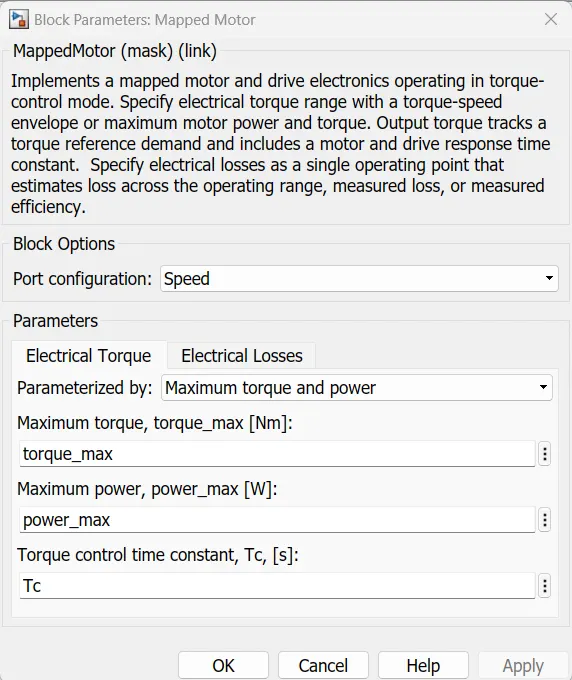
* Dynamic models are used when the internal response to a model with respect to its components is needed.
Change the Model
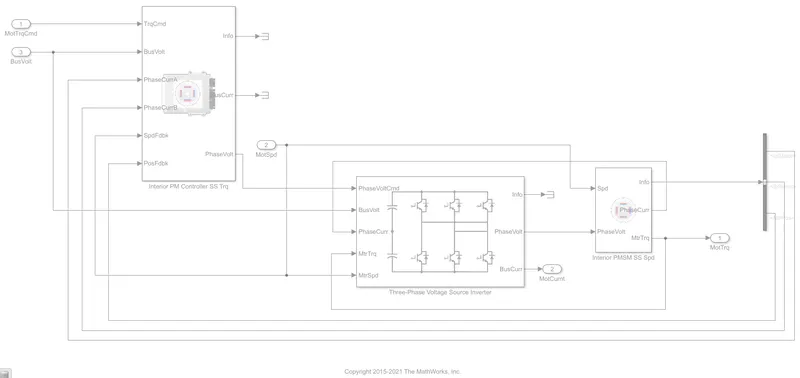
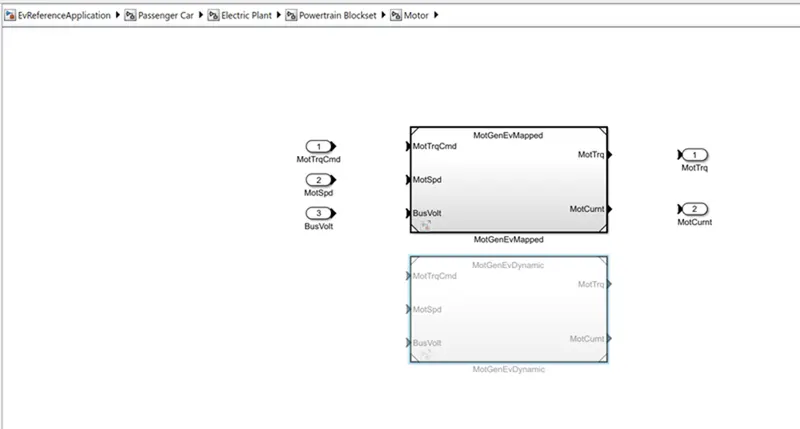
* From the passenger car block select Electric Plant and from that powertrain block and Motor. In this window you can change the type of model from Mapped or Dynamic as Shown below.
To calculate the miles per gallon,
* Open Visualization block from the EvReferenceApplication model, it will show as blow,
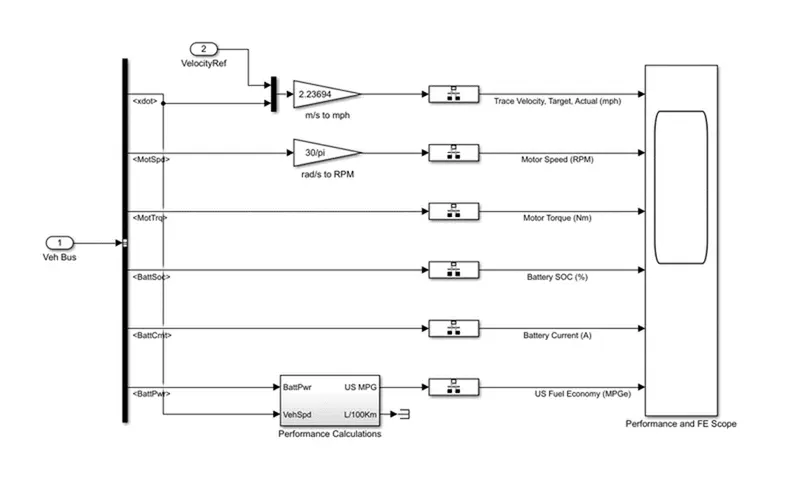
* From this block open Performance calculaiton block,
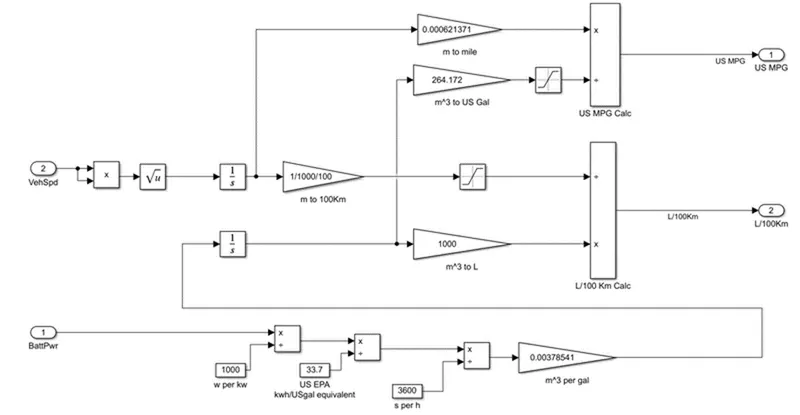
* Here is the calculation for miles per gallon is computed.
* The Battery power is converted into kw and further conveting the into EPA US gal equivalent which will us the m^3 per gallon value.
* In the other hand speed of the vehicle's speed which is in m/s is conveteed into miles/Hr and both speed and US gal value is fed into the US MPG calculation block where the miles per gallon is calculated.
* Its also calculated in Litre/100 Km calculation block also.
3.
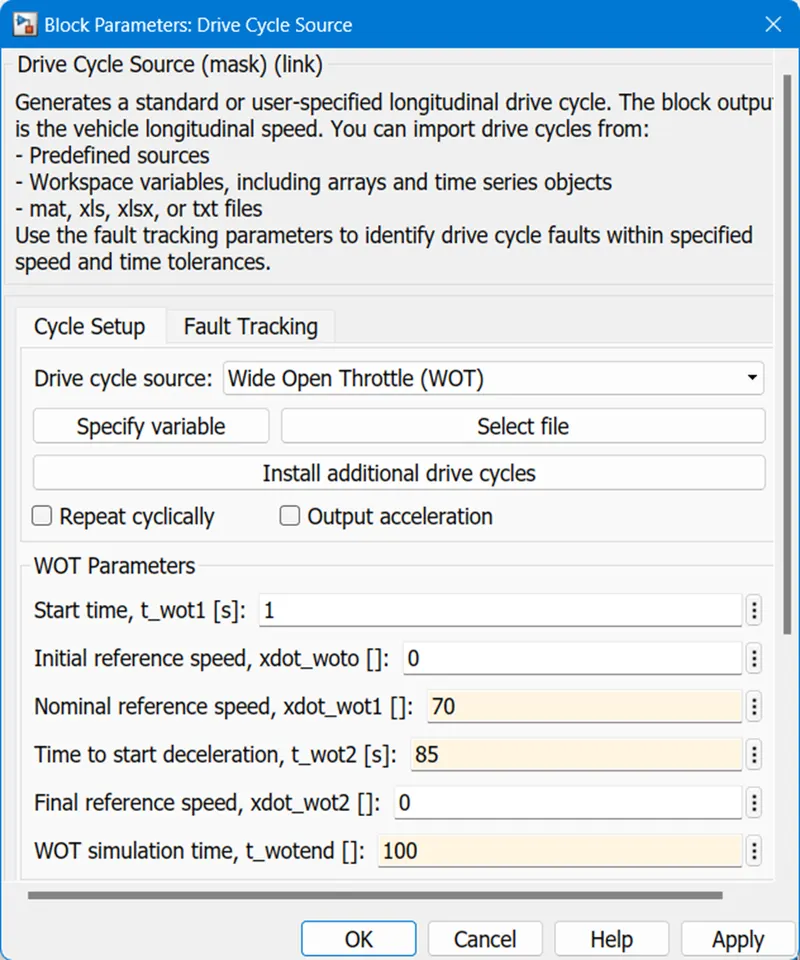
* Open the Drive Cycle source from the EvReferenceApplication model and change the drive cycle to WOT and other parameters as below.
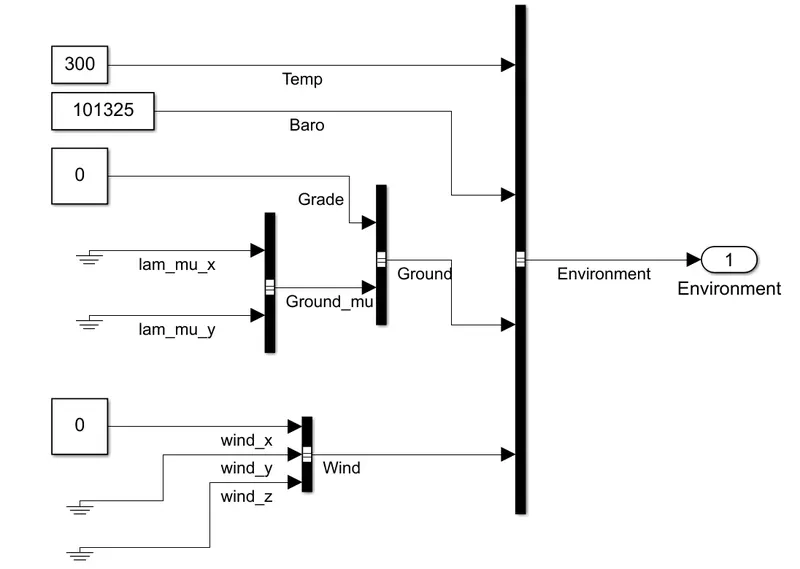
* Change the grade and wind velocity from the environtment block,
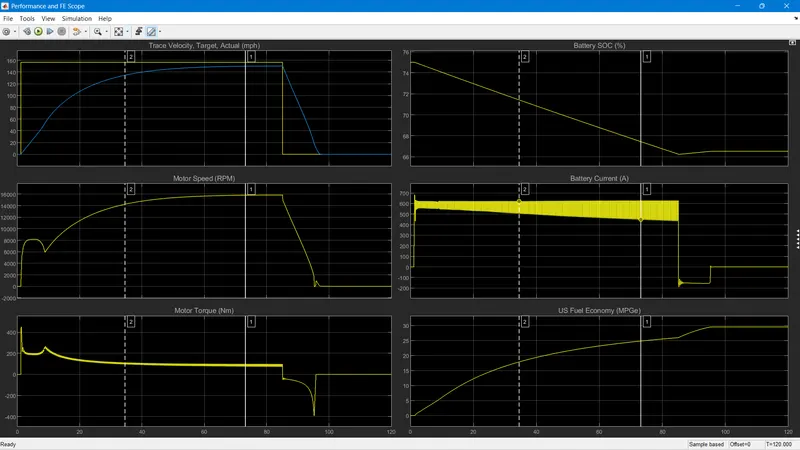
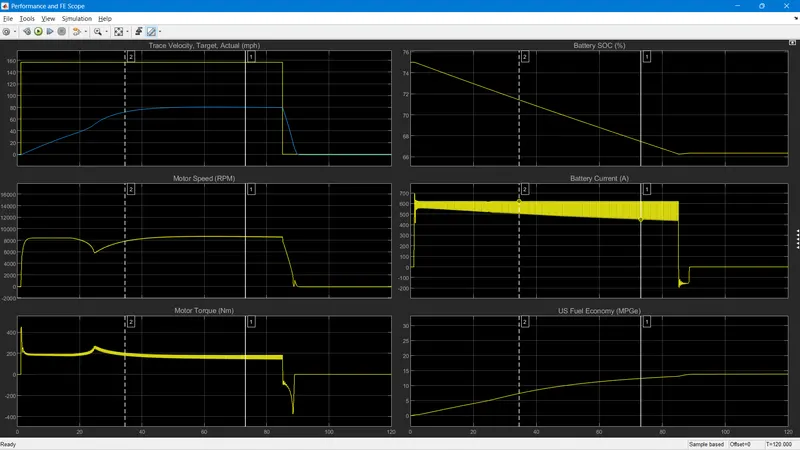
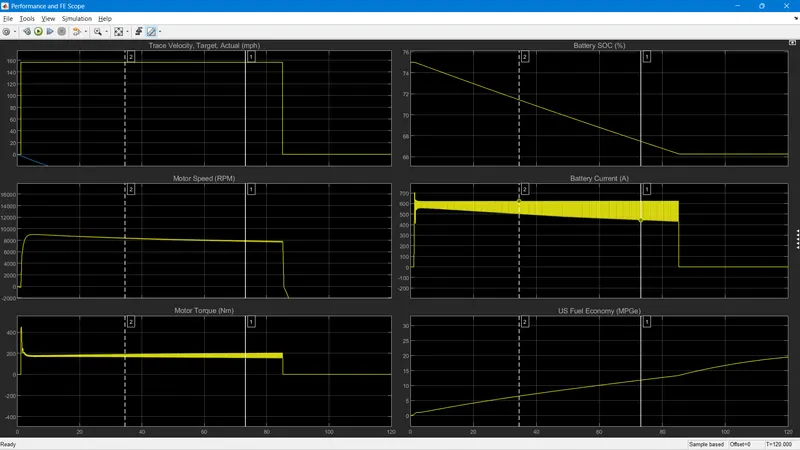
* For diffrent grade and wind velocity we obtained the results as follows,
For Grade = 0, Wind Velocity = 0m/s
For Grade = 10, Wind Velocity = 20m/s
For Grade = 20, Wind Velocity = 40m/s
RESULTS:
with the increase in grade and wind velocity,
- peak velocity achieved is reduced as gradient force and aerodynamic force increases.
- fuel economy is also reduced because the distance traveled is reduced due to external forces.
- deceleration time is reduced so battery recharging capacity is also reduced.
- Battery SOC at the end of WOT acceleration is similar but during deceleration battery is charged more is the grade and wind velocity is less.
4.
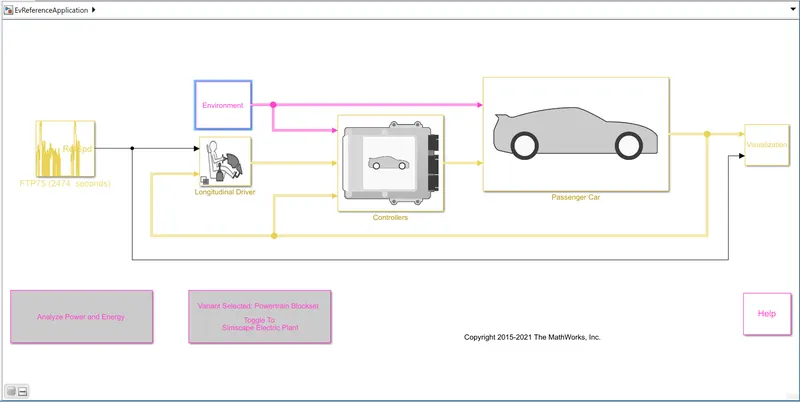
For pure EV checking for same reference model
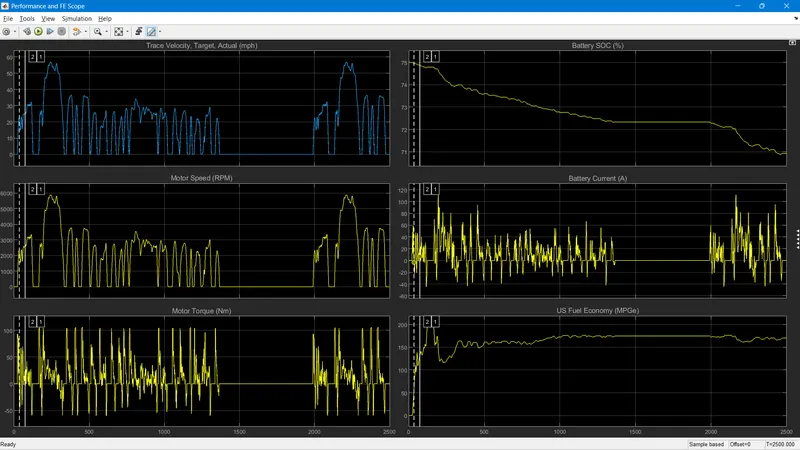
* Checking for FTP75 Drive Cycle, with Grade = 0 and Wind = 0m/s.
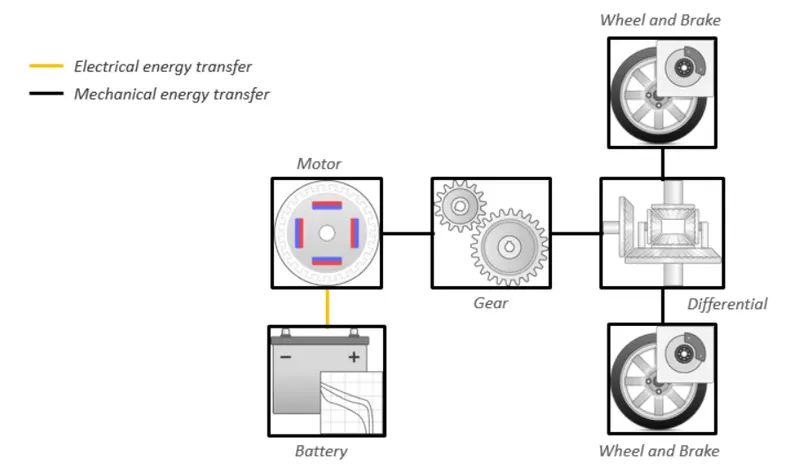
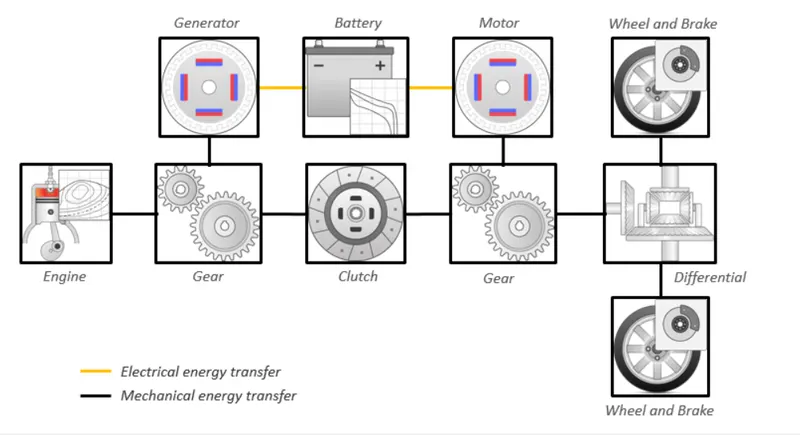
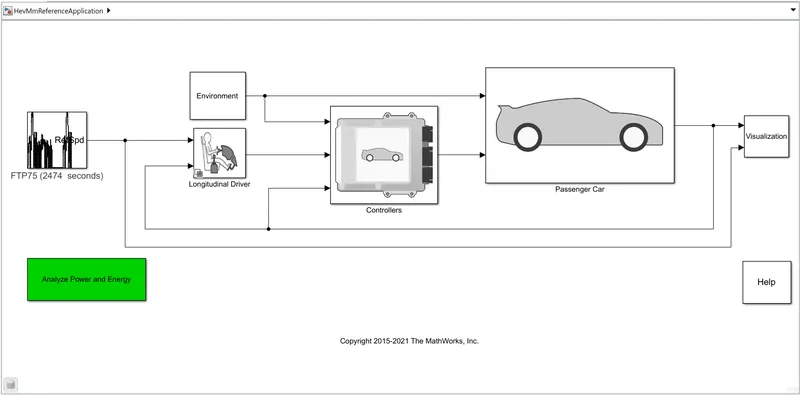
For HEV Multimodel reference we obtained as below,
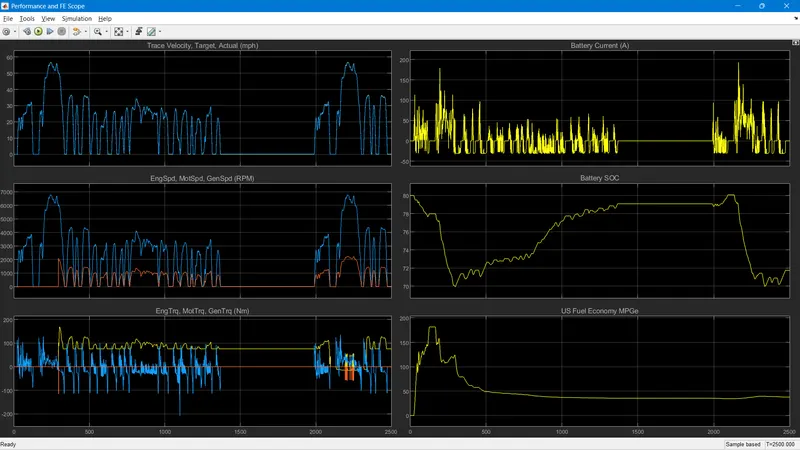
From the both model resulting graphs, We can conclude as follows.
* Time taken to achieve the required peak velocity is less for HEV as compared to EV
* Fuel economy is more for an EV compared to HEV due to less no of moving parts and thus low frictional losses.
* Battery current is continuesly changing in HEV due to charging and discharging while in pure EV the battery current is consistanty dropping.
* The US fuel economy is high in EV compared to HEV , traveling cost is less for EV.
* The motor speed (RPM) is high for HEV compared to EV.