Week-4 Challenge WOT Condition Part-2
Q.1....?
Following are he difference between mapped and dynamic model of the engine.
Mapped Model Dynamic Model
1) mapped motor are used when the behavior 1) Dynamic models are used when the internal re-
of a particular models is not of our interest sponse to a model eith respect to it's
and can be modeled with predefined values components is needed.
in the form of lookup table.
2) e.g. Mapped motor 2) e.g. Motor model
3) implements the mapped motor and drive 3) Motor component such as inverter,phase
electronic operating intorque control mode. controller,Feedback circuit are also modeled.
Changing the mode type...
We can use variant manager in the modeling tab to variant system. We have right click on the model you want & use Set as label mode active choice.
Q.2....?
Simulink block to calculate miles per gallon.
Following are the factors considered to model fuel flow.
1) Vehicle speed data is used to calculate the distance traveled in meters which is then convereted to mles.
2) Battery power data is used to find power used in KWH which is then converted to gassoline
3) EPA 1 gasoline is equal to 33.7 kwh.
4) Divide distance traveled in miles by the number of gallon.
5) HEV the gallon is aded with gallon used by IC engine then miles per gallon is calculated.
Q.3...?
- Go to help and write Powertrain blockset. Go to Get start with powertrain blockset and choose Explore hybrid electric vehicle multimode reference application. Load the simulink model.
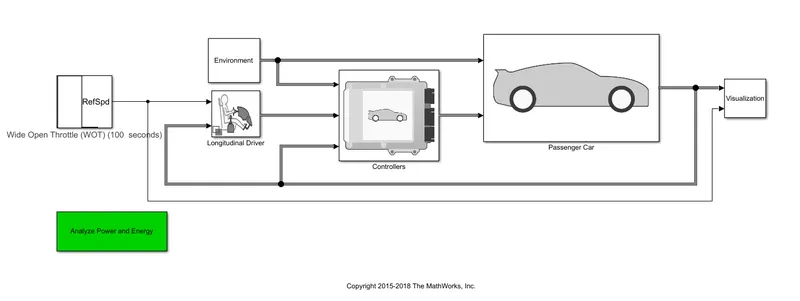
Figure- HEV Powertrain blockset
- As it is a Wide open throttle model, change the drive cycle to WOT and change the parametrs accordingly.
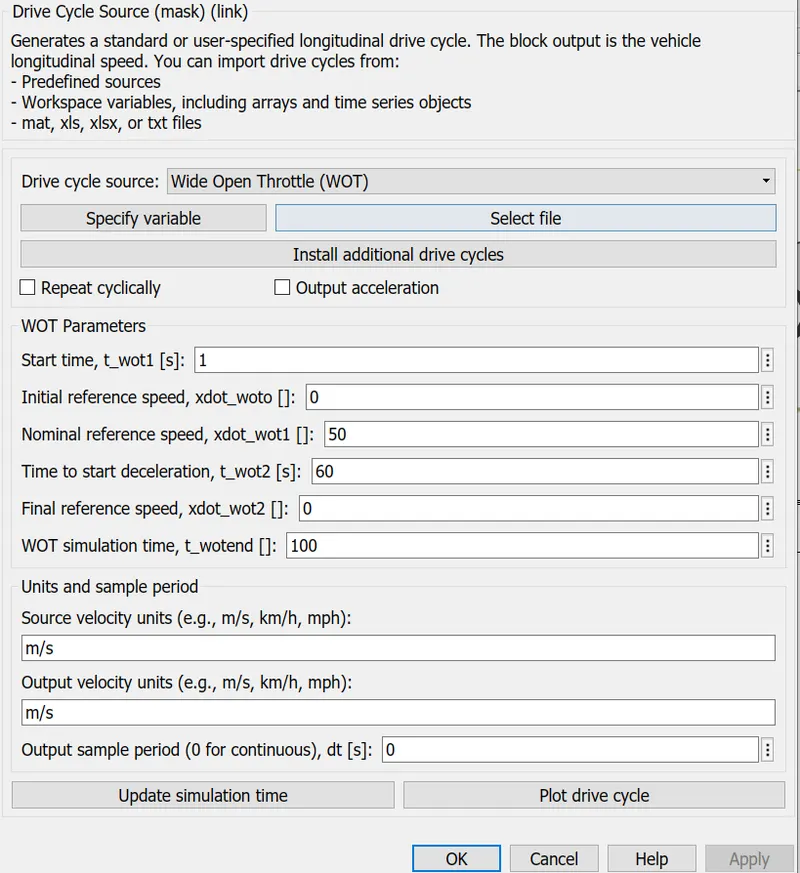
Figure-4 Drive cycle
- Now we need to change the Grade and Wind velocity in the Environment block and comment on the results therefore go to environment block and change the parameters.
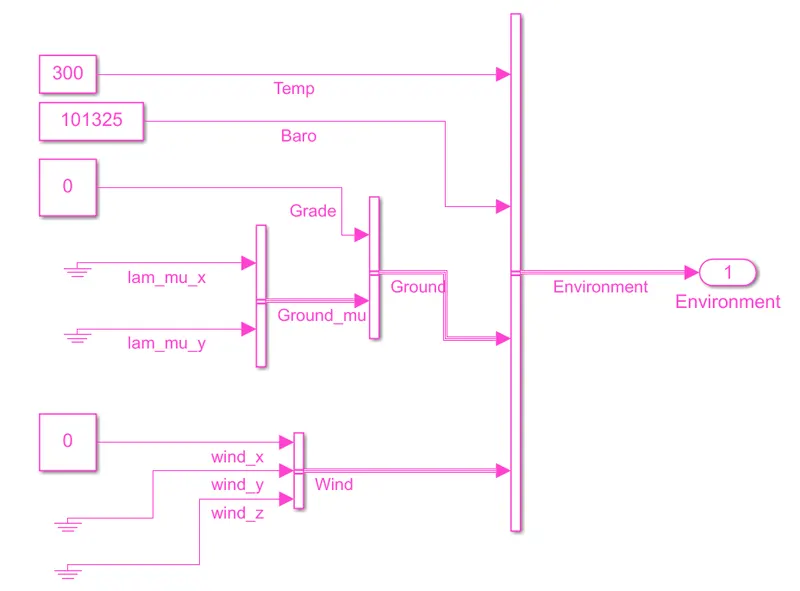
Figure-5 Environment block
Case-1 Grade and Wind velocity kept 0
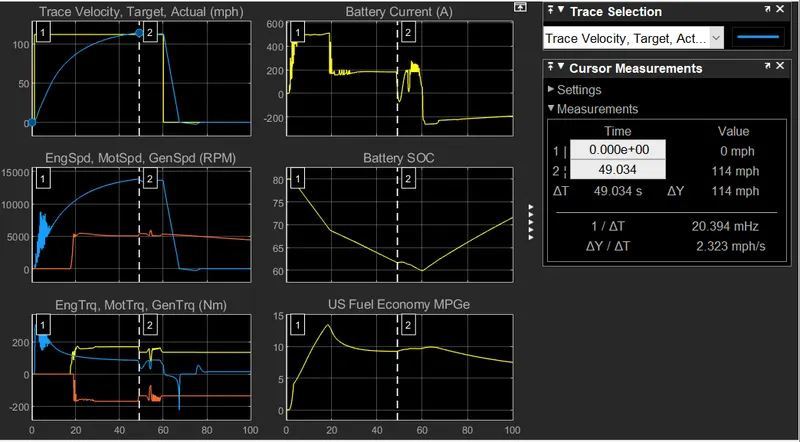
Figure-6 Acceleration time
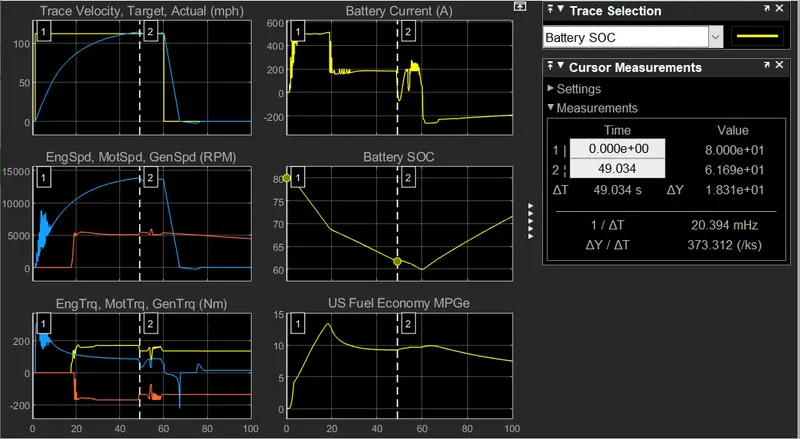
Figure-7 Battery State of Charge
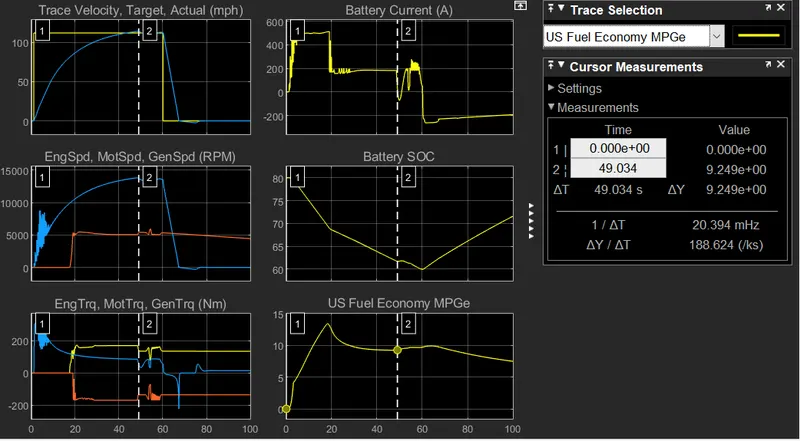
Figure-8 Fuel economy Miles per gallons
Case-2 Keeping grade angle 10 and Wind velocity 0
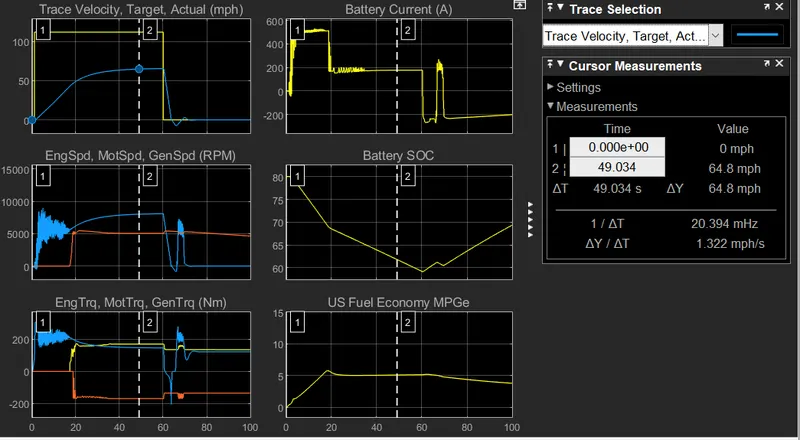
Figure-9 Acceleration time
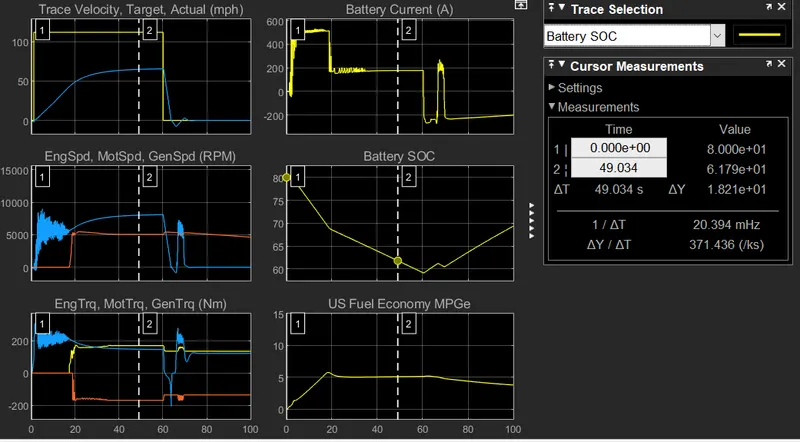
Figure-10 Battery State of Charge
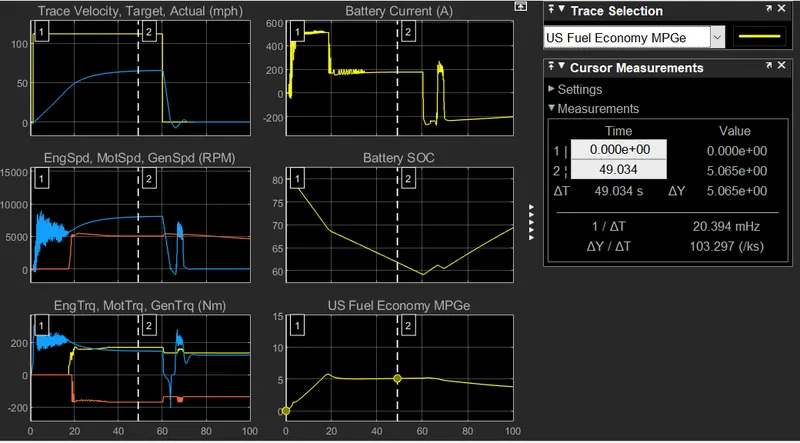
Figure-11 Fuel economy Miles per gallons
Case-3 Keeping grade angle 10 and Wind velocity 20
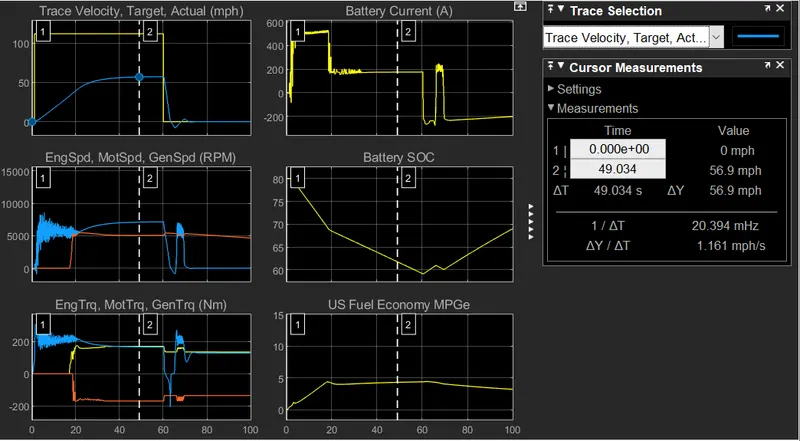
Figure-12 Acceleration time
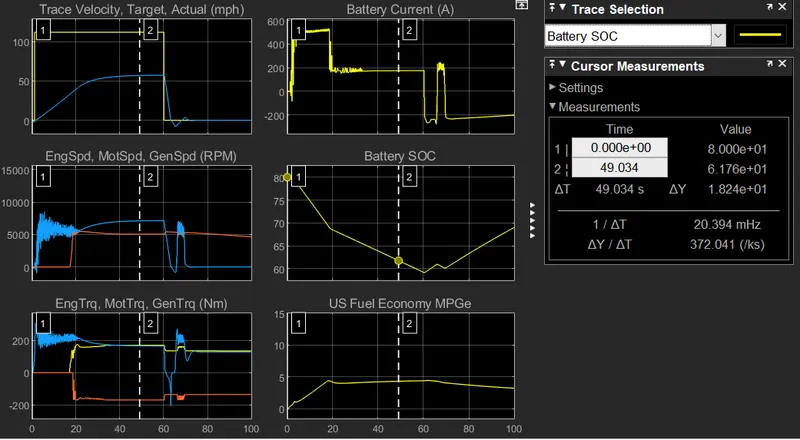
Figure-13 Battery State of Charge
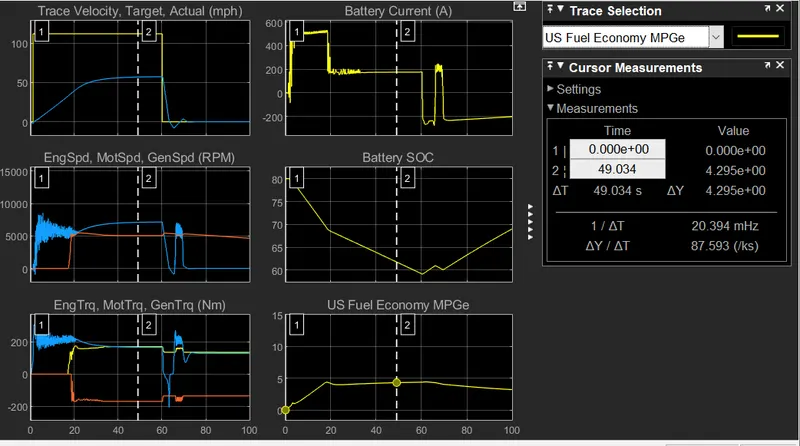
Figure-14 Fuel economy Miles per gallons
Conclusion:
- When the grade and wind velocity are kept 0, Acceleration time of 49 sec is observed and top speed of 114 mph is observed. When the grade is kept at 10 degrees, for the same acceleration time, top speed observed is 64.8 mph. When the grade is kept at 10 degrees and wind velocity is also applied equal to 20 m/s, top speed decreased to 56.9 mph. Hence top speed decreased with increase in grade and wind velocity.
- Battery SOC remains same for all the cases.
- With increase in grade and wind velocity, miles per gallon also decreased.
Q.4...?
If Keeping all other parameters same, compare the simulated results of hybrid and pure electric powertrains.
- Case-1 Electric vehicle with grade and wind velocity 0
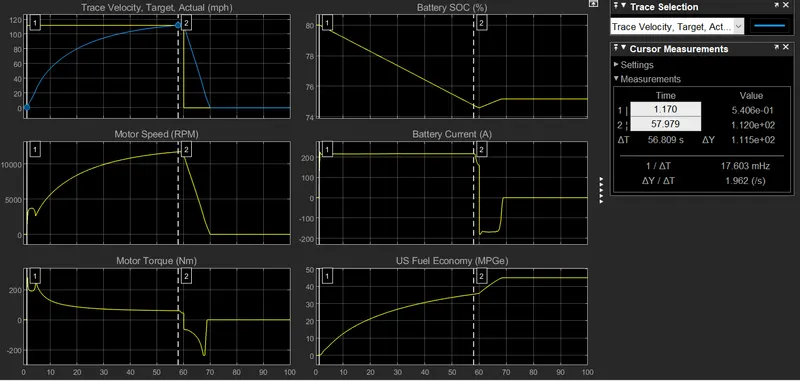
Figure-15 Acceleration time for EV
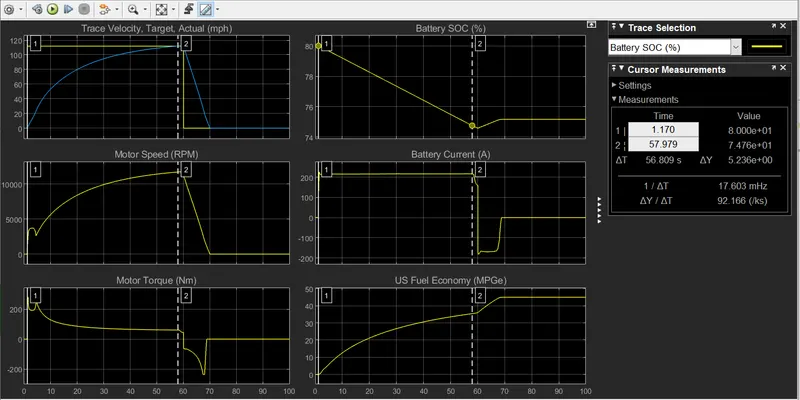
Figure-16 Battery SOC for Ev
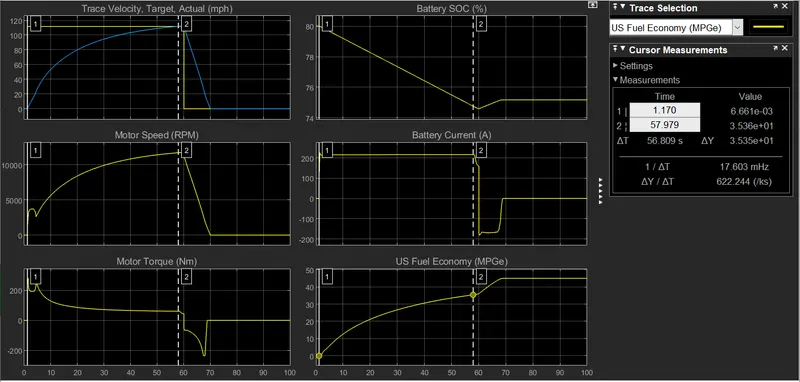
Figure-17 Fuel economy for Ev
- Case-2 Hybrid Electric vehicle with grade and wind velocity 0
Figure-18 Acceleration time for HEV
Figure-19 Battery SOC for HEV
Figure-20 Fuel economy for HEV
Conclusion:
- Better fuel economy is observed in case of EV for obvious reasons (It is fully working on Electric propulsion, whereas Hybris electric vehicle has fuel propulsion as well).
- Battery SOC decreased more for HEV case because of more weight of the vehicle (considering both HEV and EV working in electric propulsion domain).
- More top speed and less acceleration time is observed in HEV.