Week-4 Challenge WOT Condition Part-2
Ans - 1
Mapped Model - 1. Model uses a set of steady-state lookup tables to characterize engine performance.
2. The tables provide overall engine characteristics, including actual torque, fuel flow rate, BSFC, and engine-out exhaust emissions.
3. In simple words this model is designed on the parameters which are already available in lookup tables.
4. Model decomposes the engine behavior into engine characteristics that are separated into lower- level components. By combining components in this way, the models capture the dynamic
effects.
This is also similar to mapped motor modeling where the input values for generator blocks are predefined or taken from the lookup tables here also simulation time is very less
Dynamic Model - 1. If you have engine data from a dynamometer or a design tool like GT-POWER.
2. If you need a more detailed dynamic model and have component-level data.To analyze the impact of individual engine components on the overall performance.
3. In simple words its a component level modeling for designing this model there is no already available parameters it uses actual parameters which are observed during trial and error .
This model also represents an actual generator working in a real-time environment, where the output values calculated continuously according to change in input values as the equation is implementing .simulation time is more compared to the mapped generator.
To change the model type : Firstly select the model here we will take Pure EV, then open the passenger car block , Then Electric plant subsystem and then Power train blockset subsystem and then in power train blockset right click on Subsystem named MOTOR the option named VARIENT and the suboption LABLE MODE ACTIVE choice and then change he Model type.
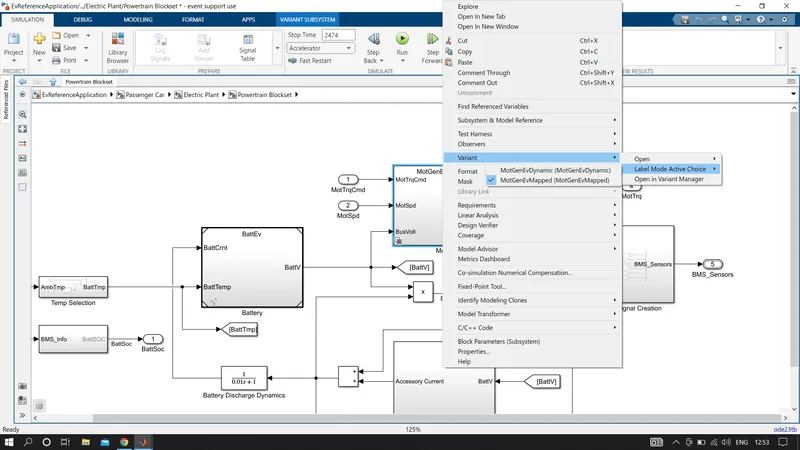
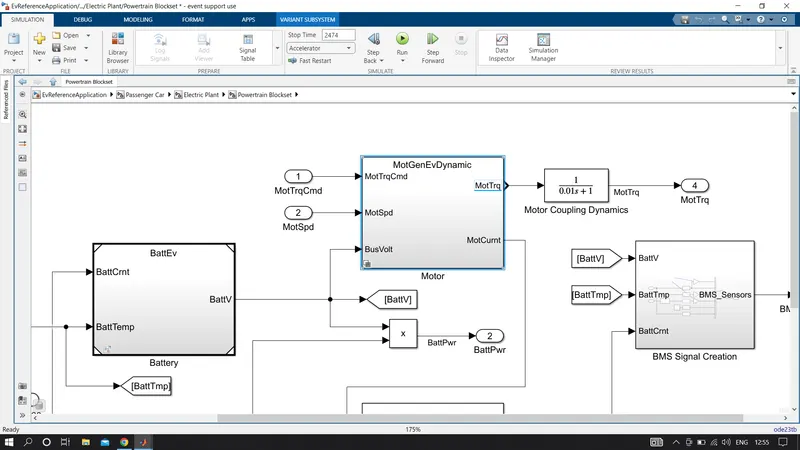
So we have changed Model type to Dynamic from Mapped in Pure electric vehicle .
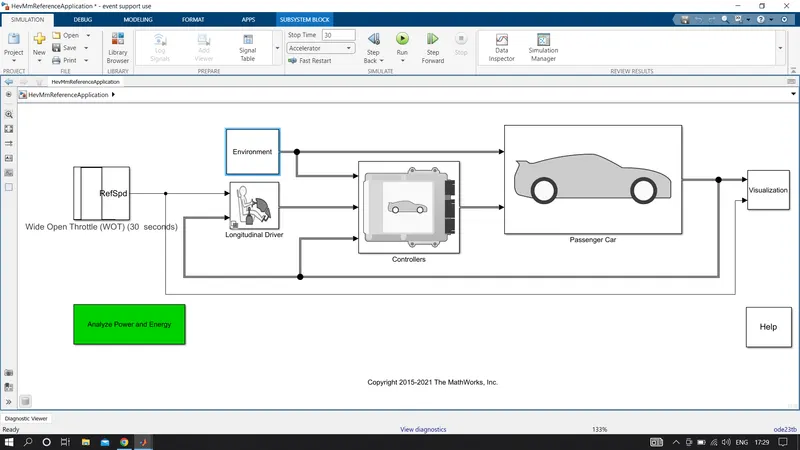
Ans-2 Running HEVmmReference model at WOT drive cycle:

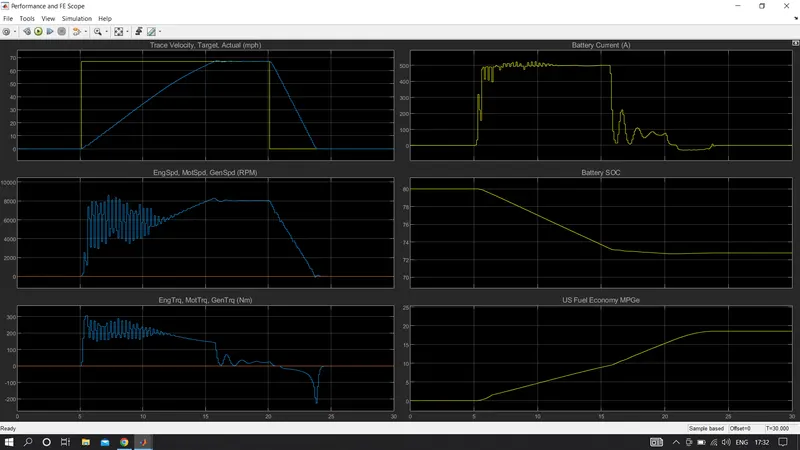
Comment- Graph-1 In this Actual velocithy (blue) increases after 5 sec and started following reference velocity after 15 sec and decreasing at 20 sec and again following ref velocity at arround 24 sec . or we can say that actual speed reached its maximum speed in 16 to 17 sec aprrox .
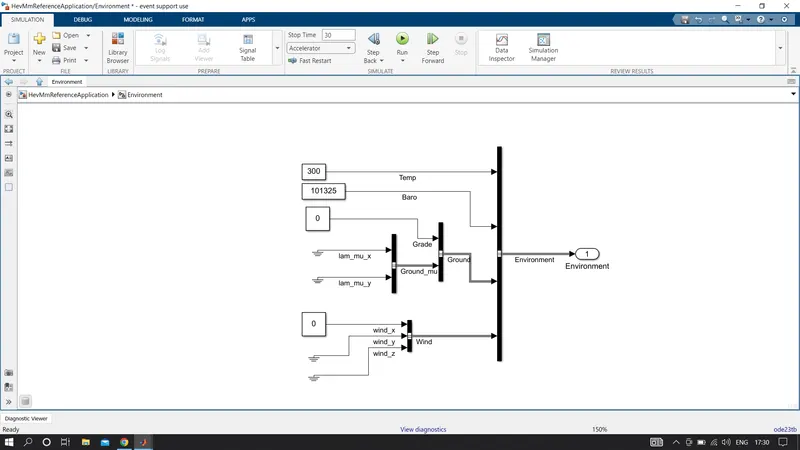
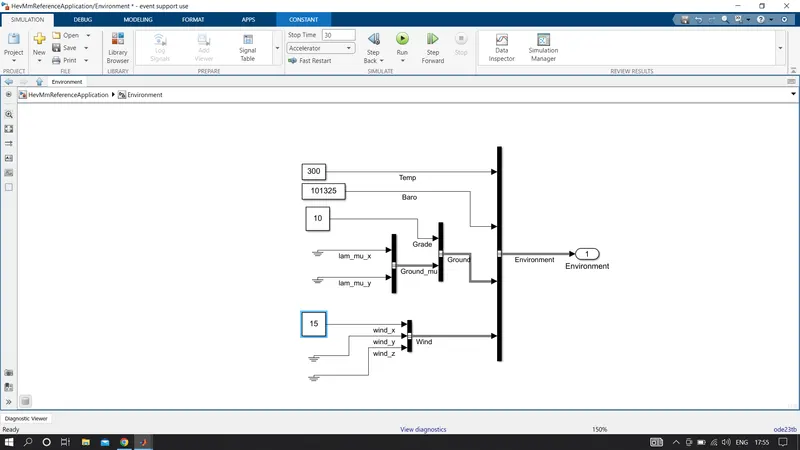
Now we will put grade value and wind velocity in environment block :
Scope output:
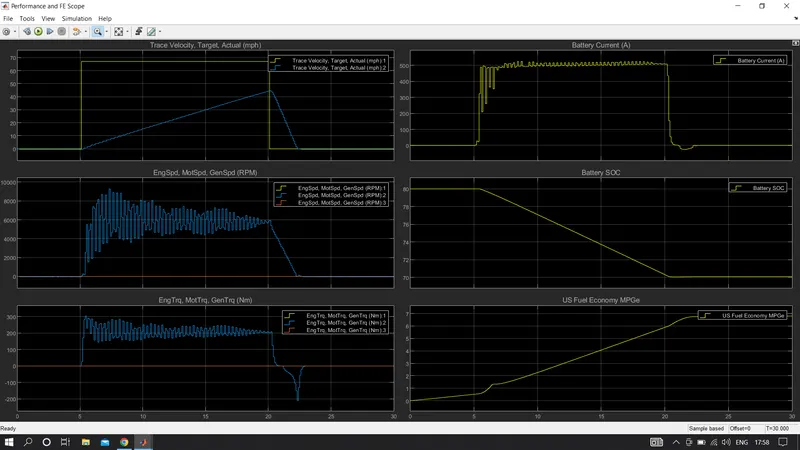
Comment : As we increase the wind velocity and gradeability velocity decreases because this factors affects the vehicle velocity in graph it achieved its maximum speed at 20 sec and suddenly decreases. SOC of battery also got affected it got stable on 70 %.
GRAPH 2:- Engine motor Generator speed
Initial there is no need for the engine and generator speed as the motor is fulfilling the requirement to achieve the maximum speed of the vehicle. Therefore they are at 0 pm. but when the battery will discharging or when the state of charge(SOC)becomes below 70% then the only engine will start to rotate to provide and maintain the speed of the vehicle and so far generator will also start to charge the battery at the same time hence their rpm are the same.
Graph -4 Battery current- when a vehicle uses an electric motor then only it is used to generate the power of the motor, when the vehicle accelerates, then no current is extracted to produce power for the motor. from the graph you also can see, the current requirement becomes stable when the battery charging mode is activated.
Graph- 6 MPGeFuel economy- After increasing the gradeability and winf velocity the fuel economy got decreased .
Ans-4 Above is the Reference model of HEV now comparing it with EV reference Model
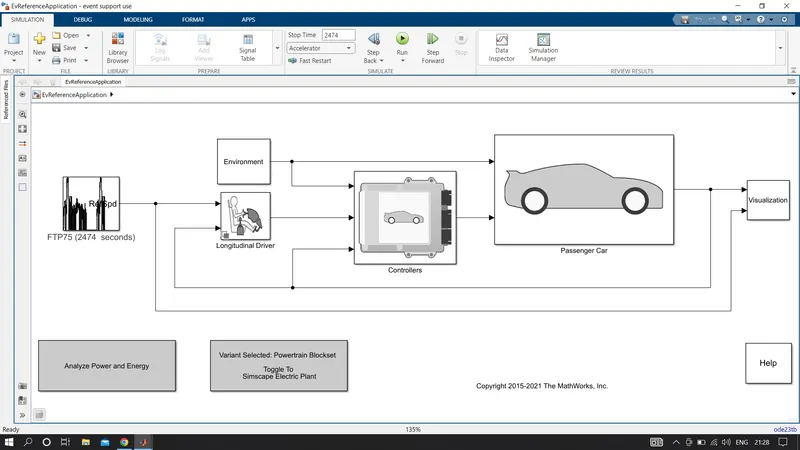
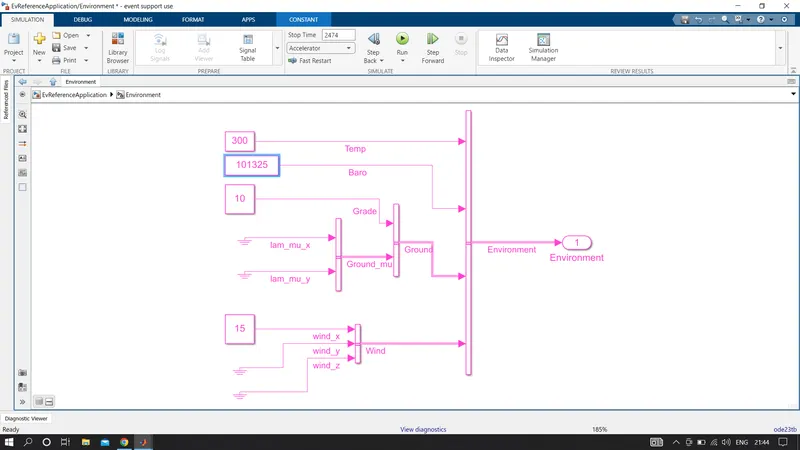
EV REFERENCE APPLICATION MODEL:-
Scope Output:
Comparision Between Ev and HEV :
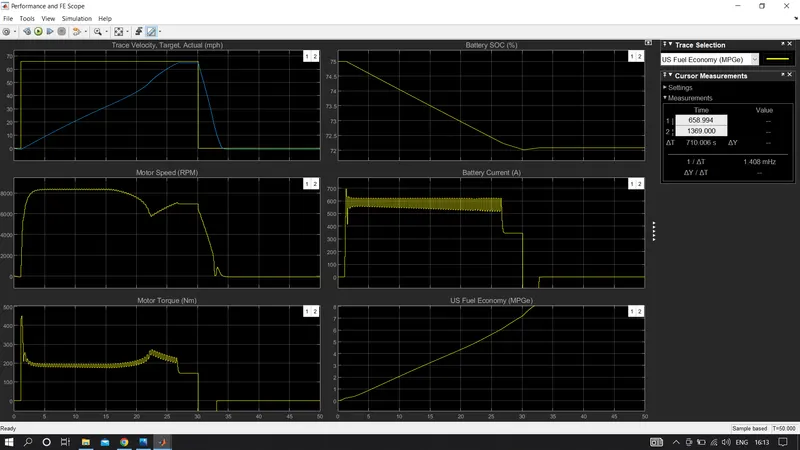
Graph - 1 Electric vehicle achieved its maximum speed in between 25 to 30 seconds whereas HEV achieved 56% of its maximum speed in 20 seconds .
Graph-2 during when Maximumspeed is constant the motor speed of HEV is higher the EV but not stable whereas the Motor speed of EV is Close to the Stability .
Graph-3 Motor torque of EV is higher then HEV
Graph-4 In Ev SOC started decreasing earlier as current started rising early but its late in HEV . During Deceleration in EV the current becomes negative and started charging the battery and hence SOC increased and hence SOC increased after 30 sec .
Graph-6 Fuel economy is higher in EV compaired to HEV
Ans-2
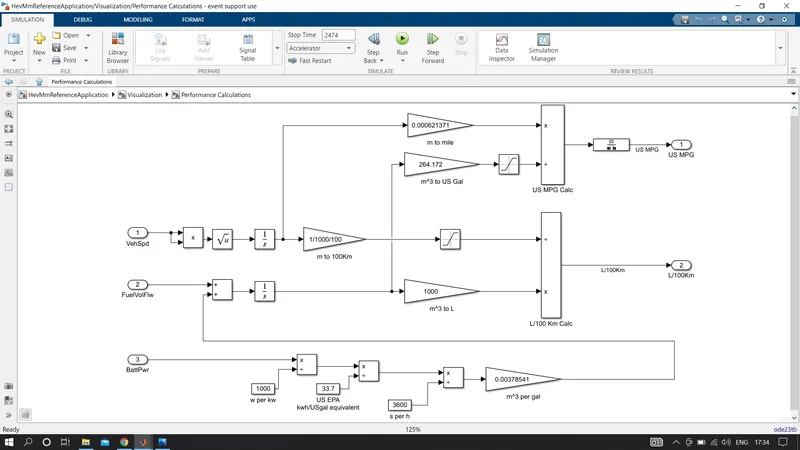
The above MPG calculation is for HEV which means it contains both fuel and battery energy.
-First, we get battery power in watt which is converted into kwatt and further converted into kw/h
-Then it's is converted into US gallon equivalent energy by dividing it by the standard value 33.7. Then converted into US gallons per second
-It is multiplied by standard value 0.00378541 to get volume in meter cube per gallon and it is added to the fuel flow for total value as it is an HEV
-Further meter Cube is converted into US gallon.
On the other hand, the speed of the vehicle is integrated to get distance and the distance which is in the meter is converted into mile by multiplying the standard value 0.000621371