Week-4 Challenge WOT Condition Part-2
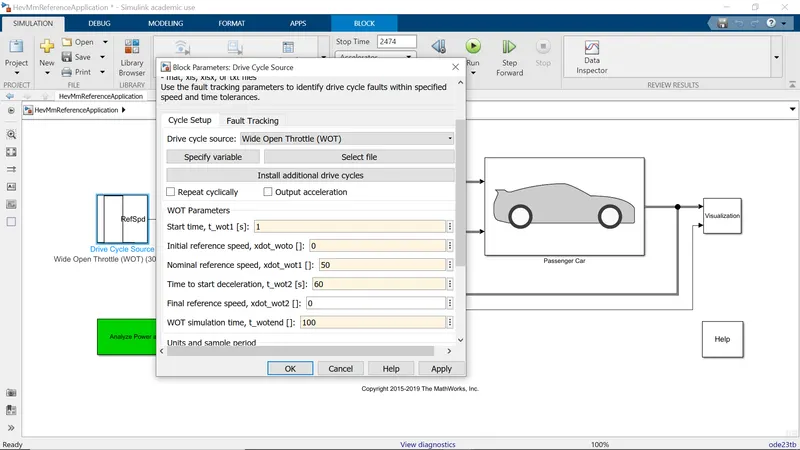
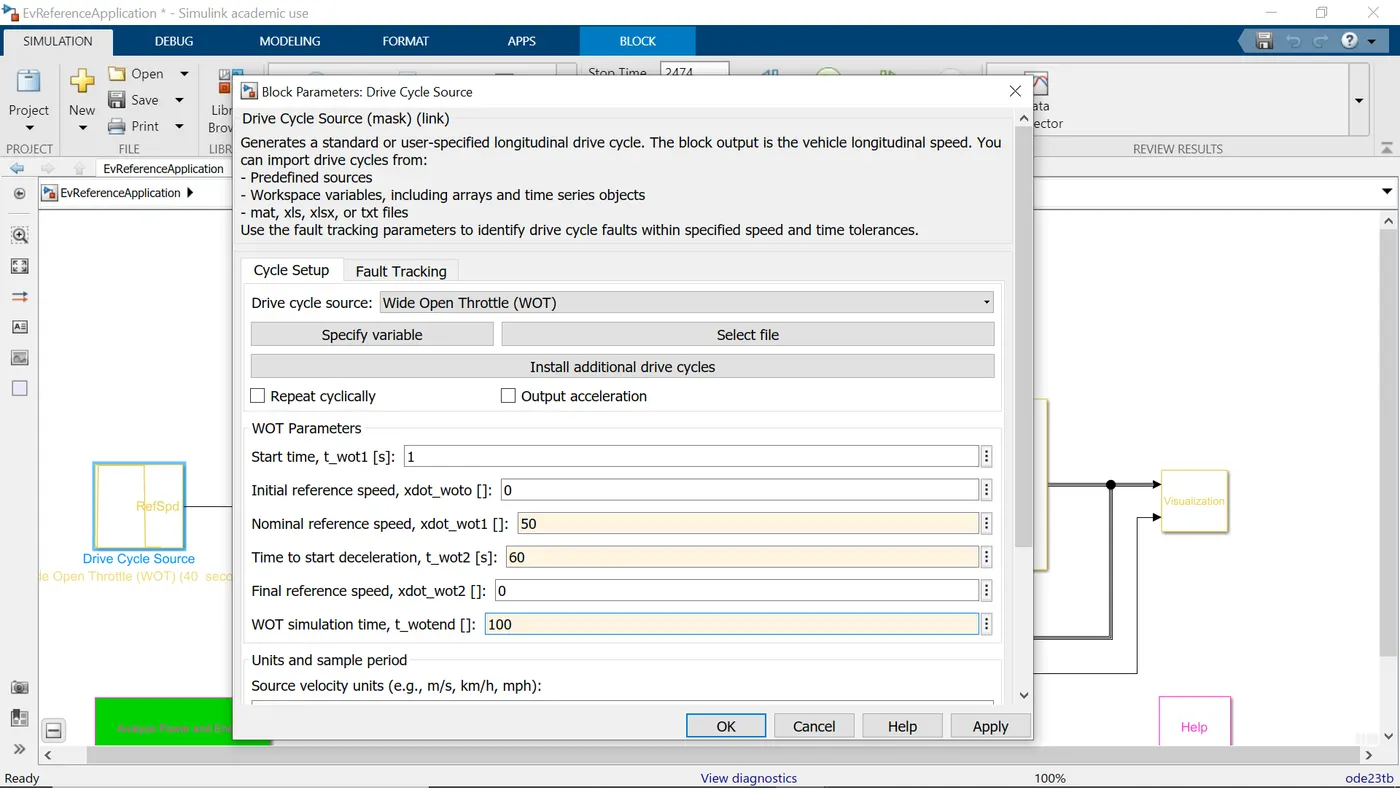
Use the command 'autoblkHevStart ' in the command window to open the HEV reference application. Then double click Drive cycle source block and then change the drive cycle to 'WOT' as shown in the below image. Also configure the parameters like time duration, WOT start time, initial speed, final speed, max speed and time to start deceleration.
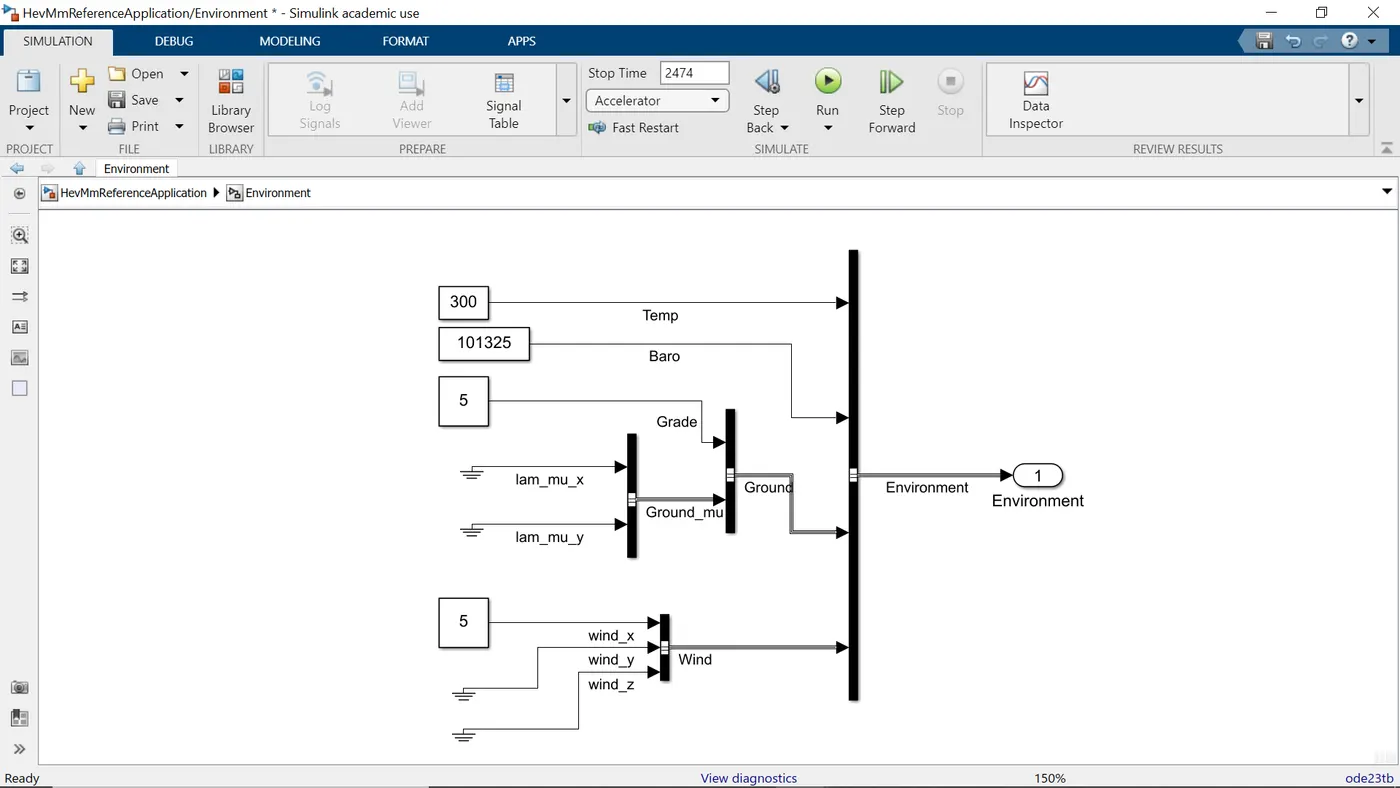
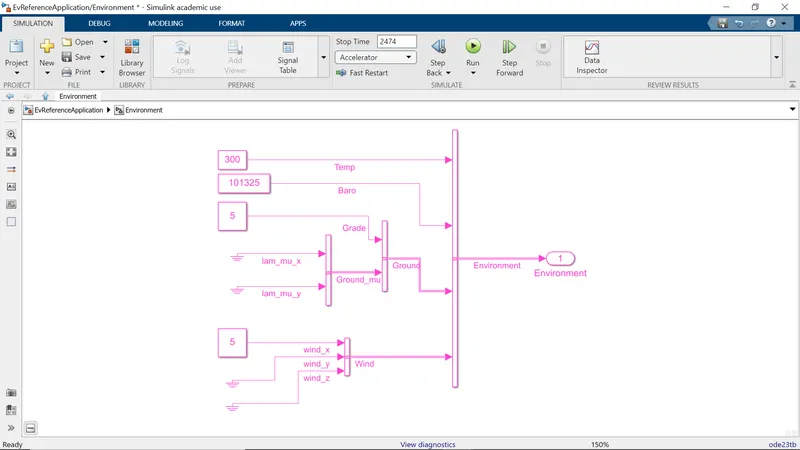
Change the wind speed and grade from the Environment block.
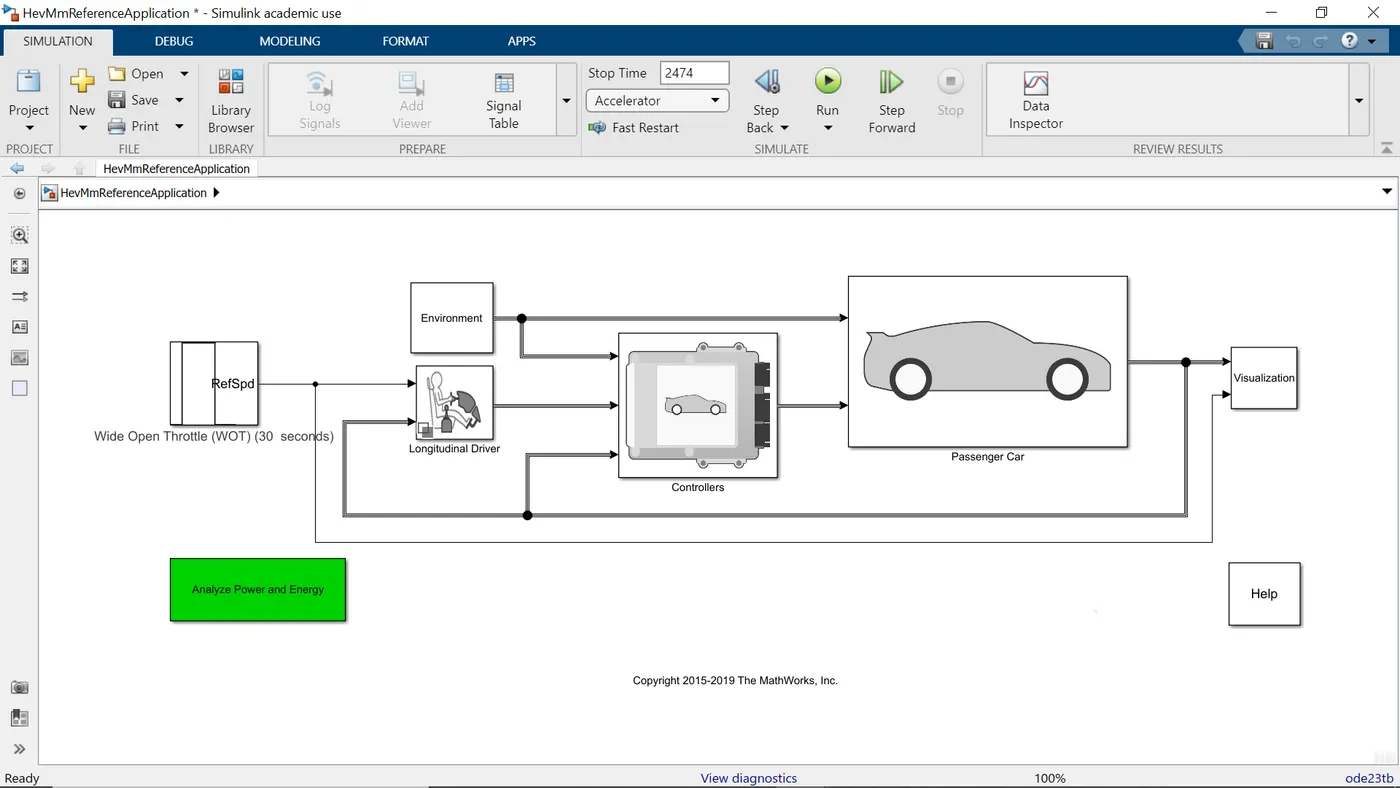
The following graphs are obtained for WOT analysis.
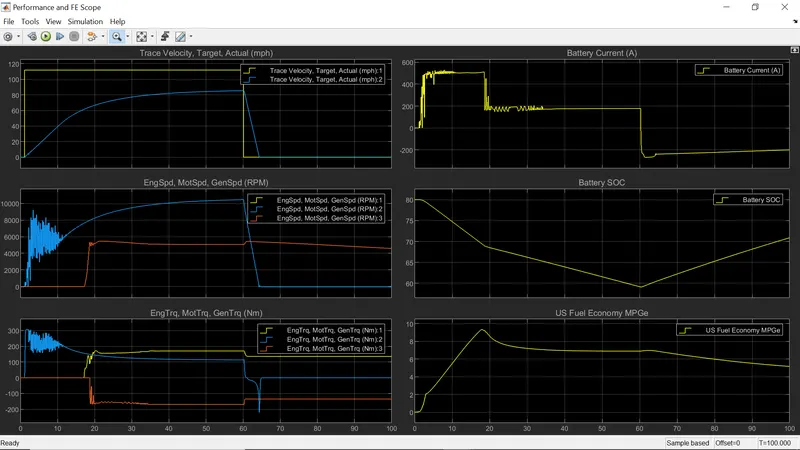
From the above graphs we can see that,
Trace Velocity target and actual graph: The yellow line indicates the desired path and blue line is the actual path. So it can be seen that battery power is not enough to meet the requirements of the grade and wind velocity.
Battery Current Graph: When the vehicle is accelerating the battery current is also increasing. When the velocity is constant the current requirement also becomes constant. When the deceleration starts the battery current becomes negative indicating regenerative braking.
Battery SOC: The battery SOC keeps on depleting until regenerative braking starts. This increases the SOC.
Engine, Motor and Generator Speed: Initially only motor is used to start the vehicle as motor has high initial torque. Later generator (red graph) kicks in charging the battery when SOC drops below 70%. Engine graph can't be seen as it may have overlaped with generator.
Engine, Motor and Generator Torque: Motor torque is high initially (blue line) and then engine kicks in at a later stage (yellow line). Generator torque (red line) is negative as its charging the battery.
4.)Keeping all other parameters same, compare the simulated results of hybrid and pure electric powertrains.
Now simulating the EV with WOT drivecylce, wind velocity as 5m/s, grade as 5 degree and keeping the rest of the parameters same as above HEV case.
We get the following performance graphs:
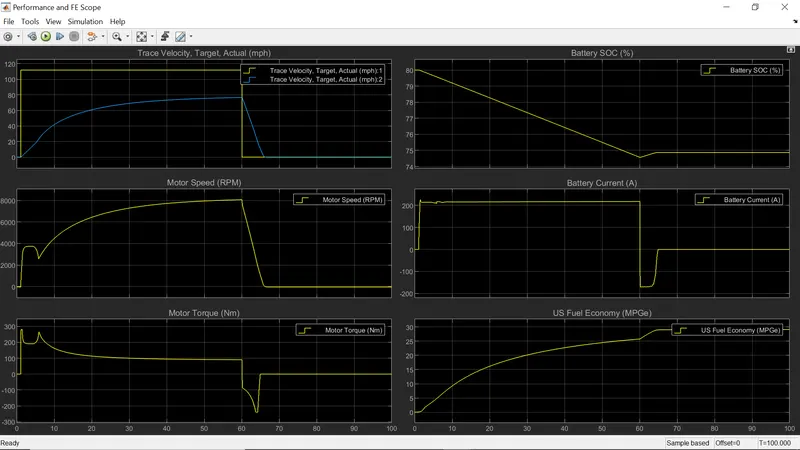
After comparing the graphs of both EV and HEV following conclusions can be drawn:
1. The first graph (target and actual velocity graph) performance is almost same. the reason could be that in that region only motor was operating so the performance in both EV and HEV is similar.
2. The battery current drawn by HEV initially is upto 500 A and later decreases to 200 A. This can be attributed to the fact that initially only motor takes all the load and later engine kicks in so motor load drops thus current drawn by motor reduces. And during the deceleration it is seen that negative current (regenerative braking) flows for a longer time in HEV as compared to EV. So we can say that, regenerative braking is more aggressive in HEV.
3. SOC improvement of almost 15% is seen in HEV during deceleration and only 2% improvement can be seen in EV during deceleration. This can be understood by the same reason explained in point 2.
4. Motor torque and motor speed are stable in EV and they keep fluctuating a lot in HEV during the starting. Also the peak RPM of the motor in EV is less than HEV. These differences can attributed to the fact that battery power of EV is more than HEV.
5. Fuel economy of EV is significantly greater than HEV. This is because electric motor is more efficient than engine.