Week-4 Challenge WOT Condition Part-2
Model uses a set of steady-state lookup tables to characterize engine performance.
The tables provide overall engine characteristics, including actual torque, fuel flow rate, BSFC, and engine-out exhaust emissions both for Motor and generator
It is used
-
If you have engine data from a dynamometer or a design tool like GT-POWER.
For quasi steady-state engine simulations.
Dynamic modelling
1.Dynamic engine decompose engine behaviour into individual component models that account for engine dynamics,most notably intake airflow and turbo charger dynamics.
2.Dynamics engine models are suitable for desiging control,estimator and diagnostic,algorthims that depend on dynamic subsysytem states,for example in closed loop AFR(air fuel ratio)control algorithm development.
Answer for question 2
-
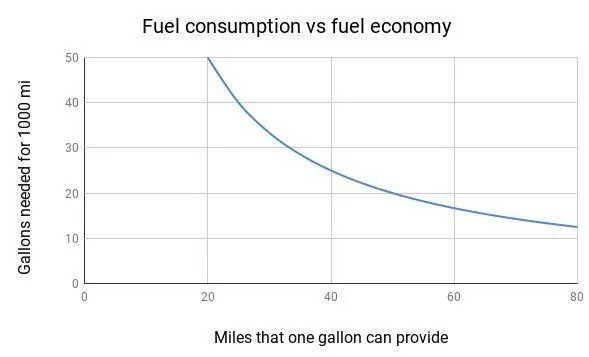
Miles per gallon (mpg) & miles per gallon equivalent (mpge):
for a conventional gasoline vehicle,the fuel efficiency is calculated via miles per gallon (mpg).however fuel efficiency for hybrid electric vehicles is calculated via miles per gallon equivalent(pge).mpg is the number of miles your car can drive per gallon of gas.figuring out an mpge rating is a littile more complicated.since engines that can use an alternative source of fuel cant be measured by liquid gallons of fuel,the mpge rating is calculated by figuring out the number of milles a vehicle can go using the same energy content as gallon of gas.the epa calculated that 33.7 kilowatt hours of electriccity is equivalent to one gallon of gas.
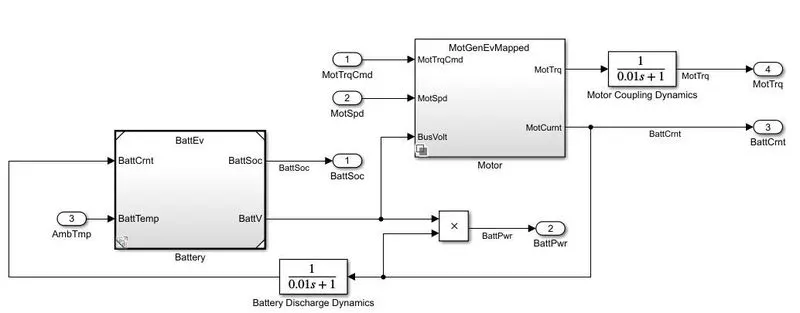
- From the below figure it is clear that by default mapped motor is selected. in motor generator EV mapped block.
Results:- By clicking on Run the results obtained when FTP75 drive cycle is used with a simulation time of 2474 sec is shown below.
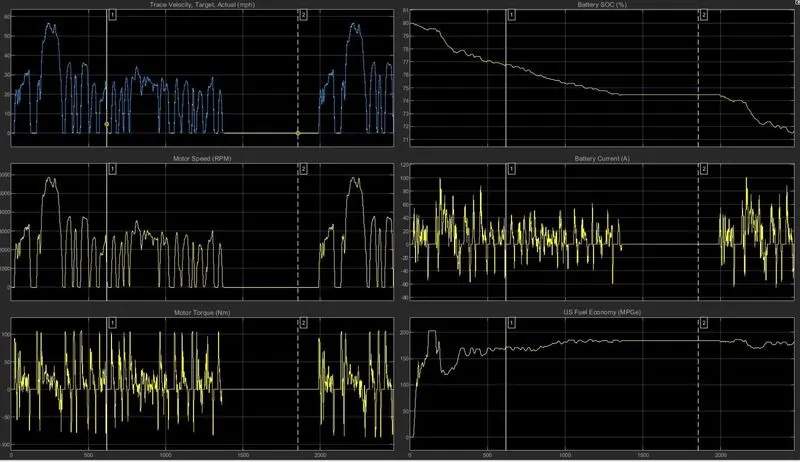
Result:-
1) The target velocity actual was only able to achieve 50.4 mph.The battery current was increased upto 500 Amp and maintained for a duration of 14 sec.
2)Engine speed was able to achieve 7990 RPM but for a small duration of time and battery State of Charge(SOC) was decrease from 79 to 69.
3) Engine torque increases intially and goes to negitive after 20th second and the peak torque achieve was around 275 Nm. The fuel economy was increased from 0 to 8.5 and remains constant.
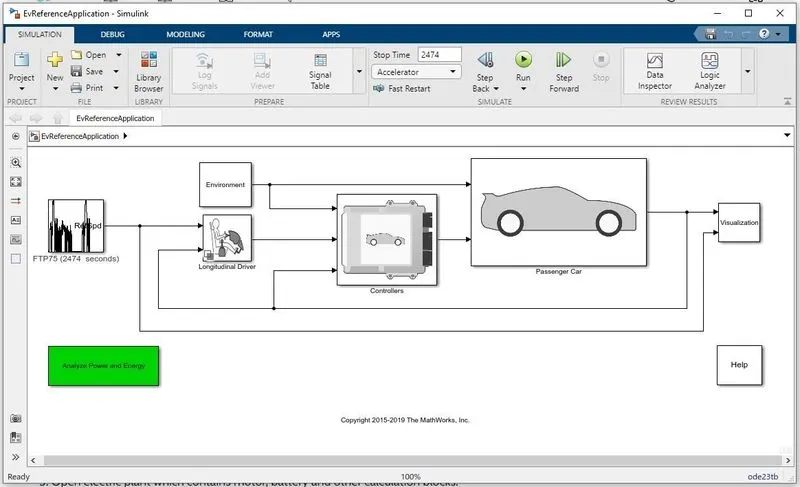
Case 2:- EV Reference application model
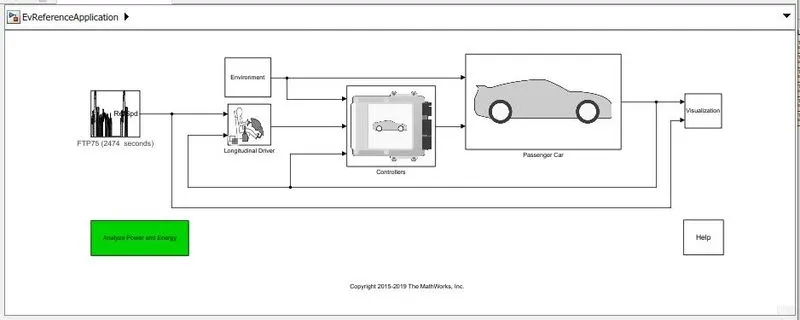
1) open Electric Vehicle Reference Application model in MATLAB.
2) The model consist of Environment, Drive cycle, Longitudinal Driver passenger and visualisation Subsystem as similar to HEV but as it is a pure electric vehicle the complexity in the model is less and the rendering time is less.
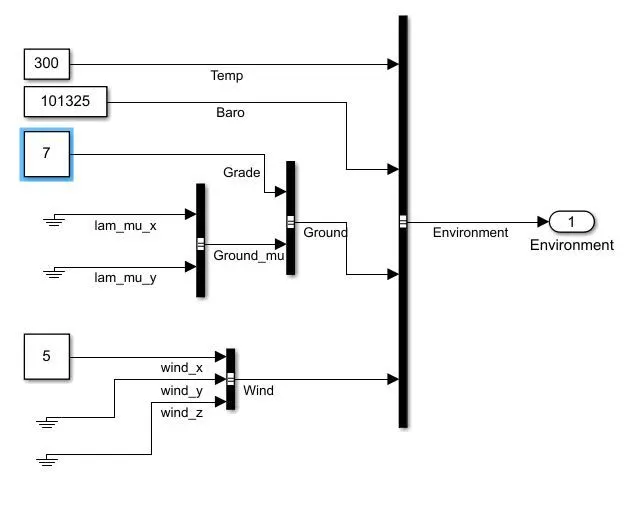
3) open the environment block and change the grade value to 7 and wind velocity to 5.
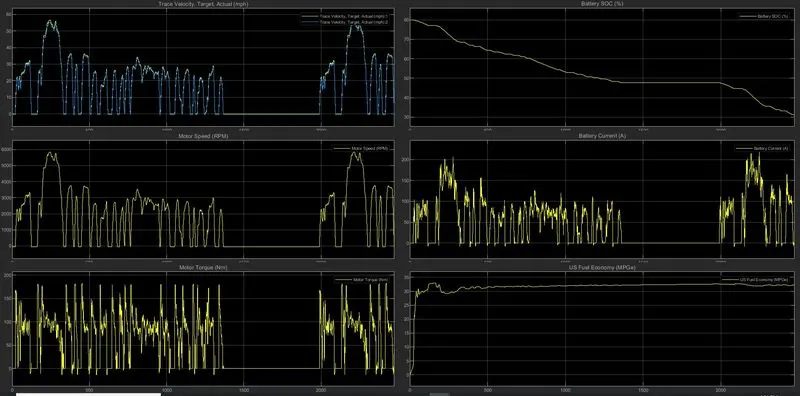
4) Now run the simulation with 2474 seconds and go to visualisation to see the graph.
Conclusion :-
1) Battery current is continuesly changing in HEV due to charging and discharging while in pure EV the battery current is consistanty dropping.
2) The US fuel economy is high in EV compared to HEV , traveling cost is less for EV.
3) The motor speed (RPM) is high for HEV compared to EV.