Week-4 Challenge WOT Condition Part-2
Q.1.What is the difference between mapped and dynamic model of engine, motor and generator? How can you change model type?
ANS:
Powertrain blocksetv provide two type of model:
1) Mapped model
2) Dynamic model
1) Mapped model:
It is quite faster than Dynamic model. Its run on the Data given in the lookup table. We have earlier requirement of output from what output is required. So that we can put all the values in the lookup table.(lookup table where we can store the input and output values which doesn't have relation between them).
Earlier where their was no ELECTRIC CONTROL UNIT(ECU) at that time pedal was connected physically to the engine. so when the more pedal is pushed the throttle letting more fuel to the engine.which drove more power through the engine which increase combution.it was easy and simple,but its had also limitations.
So Now the Pedal is measured Electronically and read by ECU.so ECU takes lots of input from the car and work out how to manage the combution process.ECU looks up the whats going on exactly with the car and find out what supposed to do with the engine. so we can say its called as a lookup table.
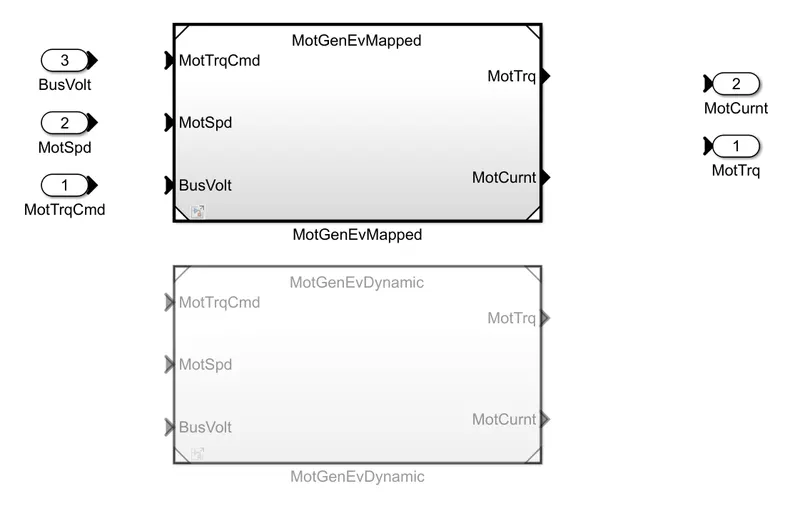
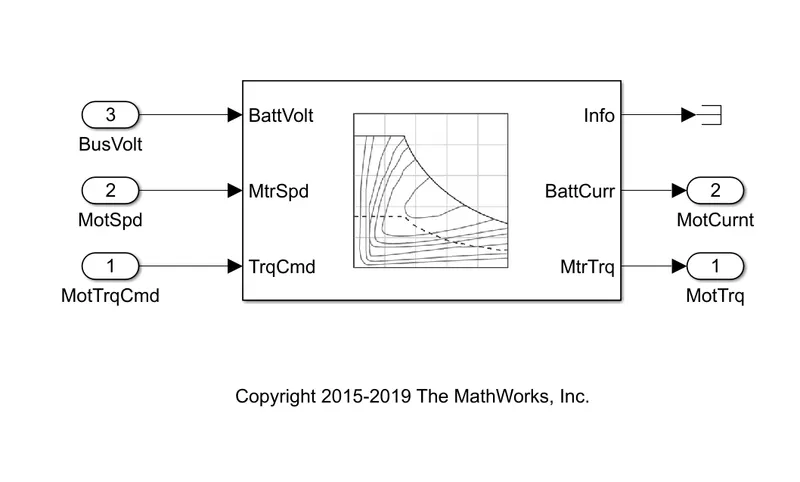
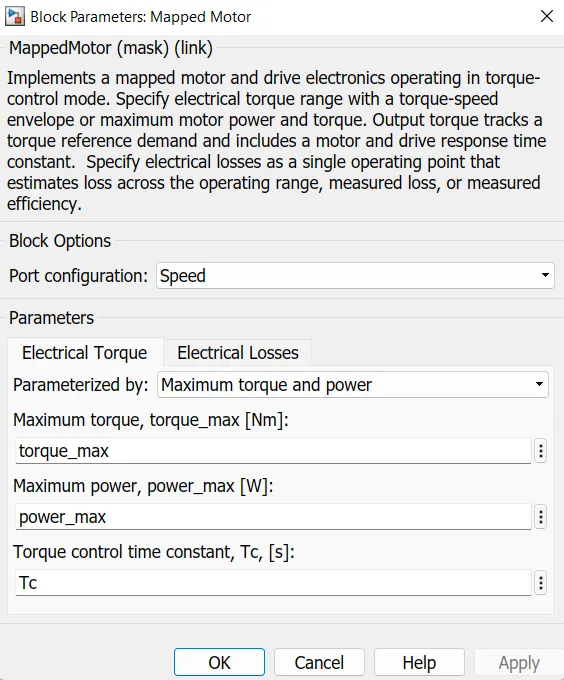
The mapped Motor block as shown above fig.this block act as a motor and generator at the time of regenerative of braking.that means output determines only by current input and software looksup in the look up table and gives required output.
2) Dynamic Model:
Dynamic Model is going to represent actual component.here the system has to check individual component and then give disirable output so output takes time to react. in this dynamic we dont have any requirement of output,we dont know what output is happened so as per output condition we change the parameter.
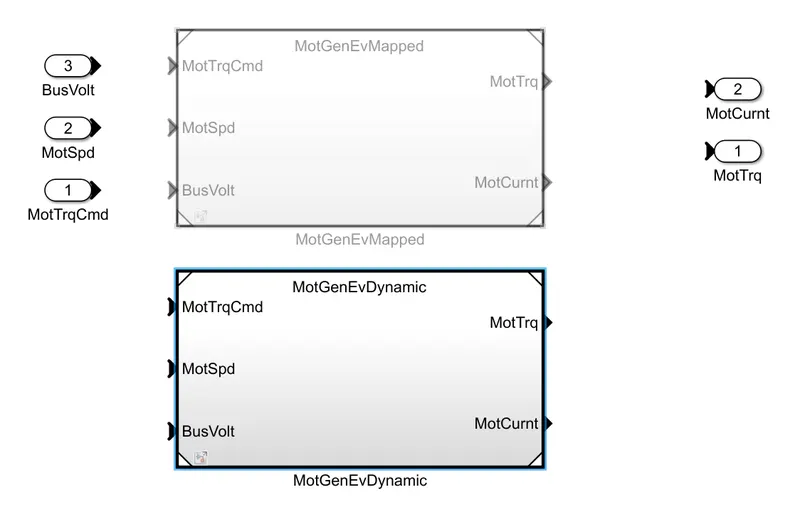
The Dynamic Block as shown above fig.in above fig.we have dynamic motor system which use permanent magnet motor controller and inverter for regenerative braking.
Now for changing the model from mapped to dynamic and vic versa following steps to be followed:
1) Open the model then go to passenger car block double click on that and go to electric plant.
2) In electric plant motor block is their,right click on that then go variant - label mode active choice.
3) You will get two option mapped and dynamic so you can select which one you want.
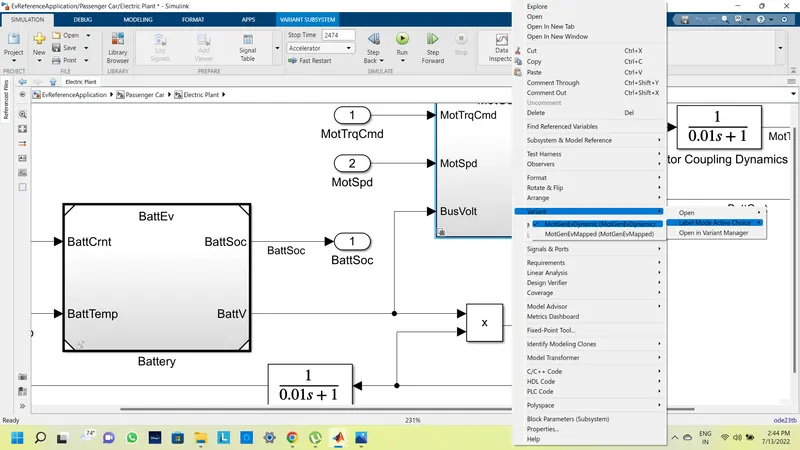
After changed the dynamic model shown below,
| STATIC ENGINE MODEL | DYNAMIC ENGINE MODEL |
|
|
|
|
|
|
Q.2.How does the model calculate miles per gallon? Which factors are considered to model fuel flow?
ANS:
Factors are consider to model fuel flow are given below:-
- Vehicle speed
- Fuel flow
- Battery Power
Steps to follow:
- Go to visualization block.
- Click on performance calculations.
- Will get this calculated model bolcks of miles per gallon.
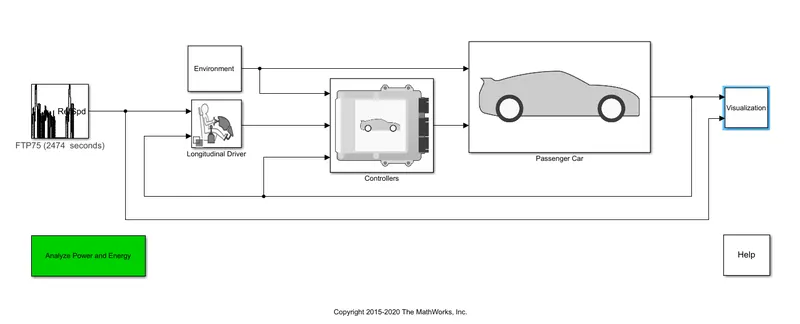
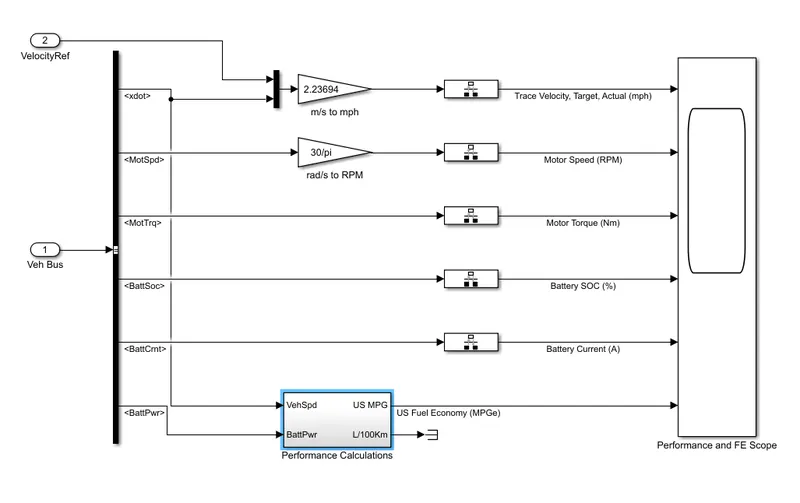
Model calculate miles per gallon as shown below:
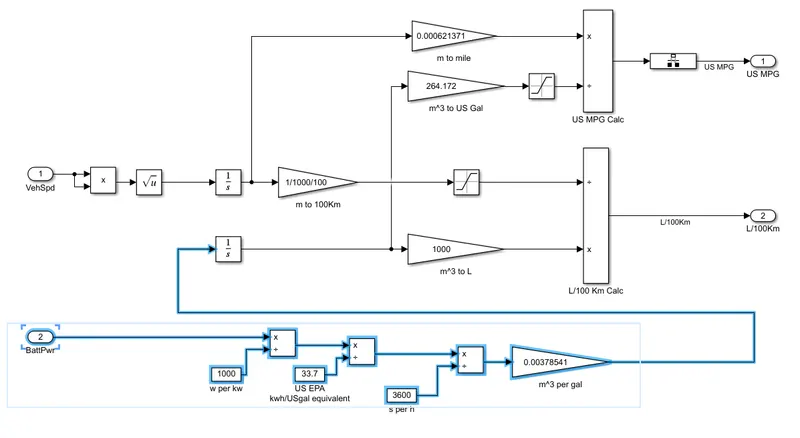
Conversion of cubic meter to gallon(m^3 to gallon)
Their are three inputs:
1)Vehicle speed
2)Fuel flow
3)Battery power
Here from battery power by using fundamental block converted watt into m^3 per gallon as shown above fig. battery power are converted to KW then KW/US gallon. then m^3 per gal.
Now for example in conventional and hybrid model we have to consider fuel as a physical quantity and calculate its volume from the mass flow rate.when in pure EV Model we have to consider batteries as a electric energy as a source of fuel.then battery power is converted to energy per gallon.
Q.3. Run the HEV ReferenceApplication with WOT drive cycle. Change the grade and wind velocity in the environment block. Comment on the results.
ANS:
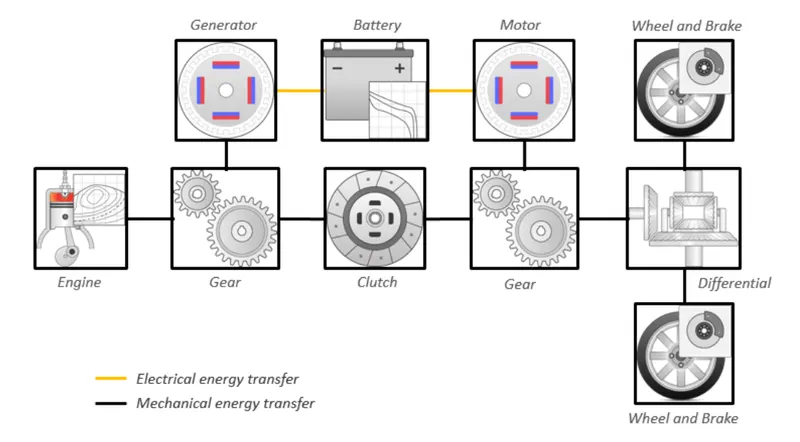
The block diagram of HEV as shown in below fig.
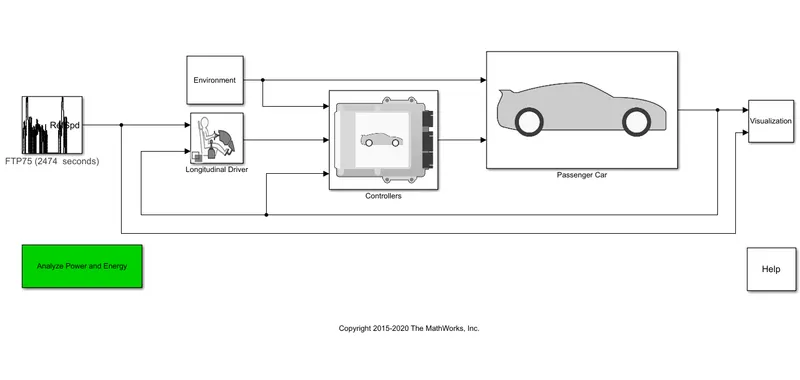
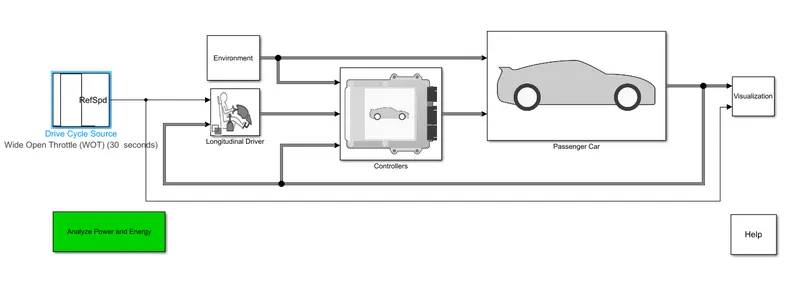
The Model of HEV Reference application with WOT drive cycle as shown below fig.
The output waveforms of default values as shown below fig.
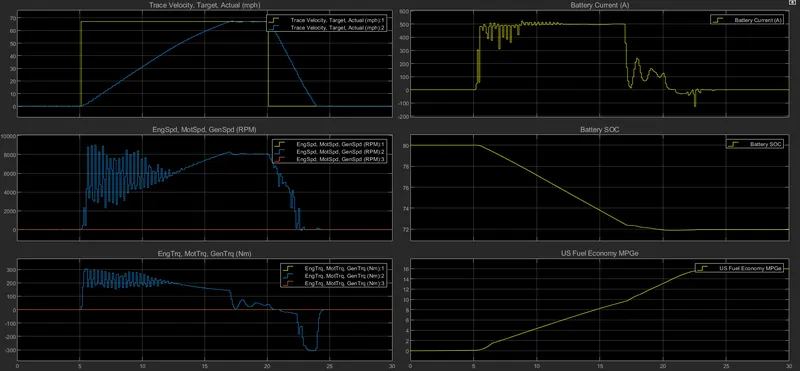
Plot 1:- graph between velocity and time on x & y axis respectively.
Peak velocity=67mph
Time taken by vehicle to accelerate and reach the peak velocity=12sec.
Time taken by vehicle to deaccelerate and stop =3sec.
Plot 2:- Engine speed(RPM)
Engine speed=8990rpm.
Plot 3:- Engine torque(Nm)
Engine torque=305Nm
Plot 4:- Battery current(A)
Battery current= drop down at 16.9sec
Plot 5:- Battery SOC(%)
Battery SOC= Constant at 72
Plot 6:- US fuel economy MPGe
Max US fuel economy MPGe=16
Now changed the grade & wind velocity:
Grade=10%
Wind Velocity=10m/s
Drive cycle= Wide Open Throttle(WOT)
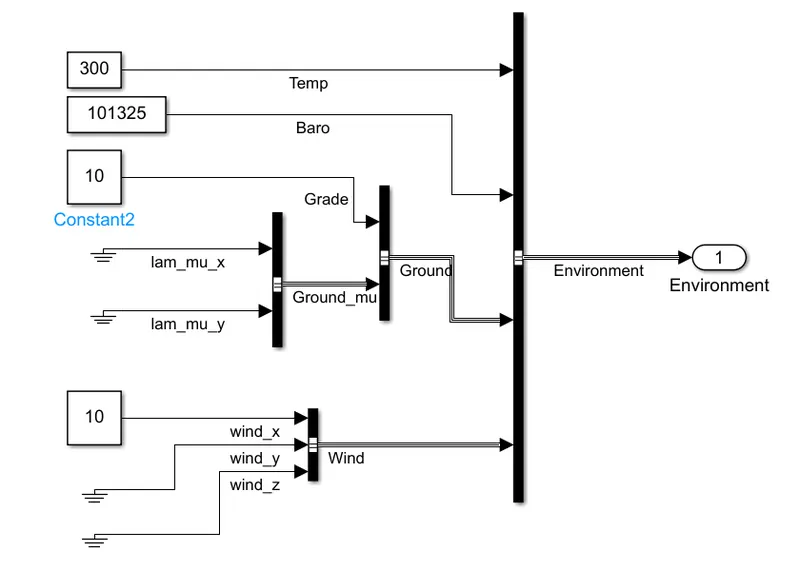
This values are changed in environment block.
The output waveforms with changed grade & velocity values as shown below fig.
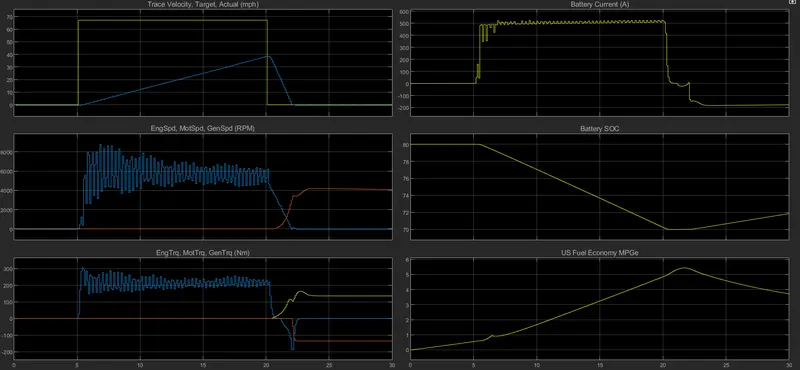
Plot 1:- graph between velocity and time on x & y axis respectively.
Peak velocity=39mph
Time taken by vehicle to accelerate and reach the peak velocity=14sec.
Time taken by vehicle to deaccelerate and stop =2.16sec.
Plot 2:- Engine speed(RPM)
Engine speed=8790rpm.
Plot 3:- Engine torque(Nm)
Engine torque=303Nm
Plot 4:- Battery current(A)
Battery current= drop down at 20sec
Plot 5:- Battery SOC(%)
Battery SOC= Constant at 70
Plot 6:- US fuel economy MPGe
Max US fuel economy MPGe=5.5
| Sr.No | Parameters | Default Condition | With changed values |
| 1 | Peak Velocity | 67 mph | 39 mph |
| 2 | Engine peak speed | 8890 | 8790 |
| 3 | Engine peak torque(Nm) | 305 Nm | 303 Nm |
| 4 | Battery current drop down at | 16.9 sec | 20 sec |
| 5 | Battery SOC constant at | 72 | 70 |
| 6 | Max US fuel economy MPGe | 16 miles | 5.5 miles |
Q.4.Keeping all other parameters same, compare the simulated results of hybrid and pure electric powertrains.
ANS: I am using the WOT drive cycle for simulating the hybrid and pure EV.already i have simulated the hybrid vehicle,so now i will simulated pure EV with WOT drive cycle.
Pure Electric Vehicle:
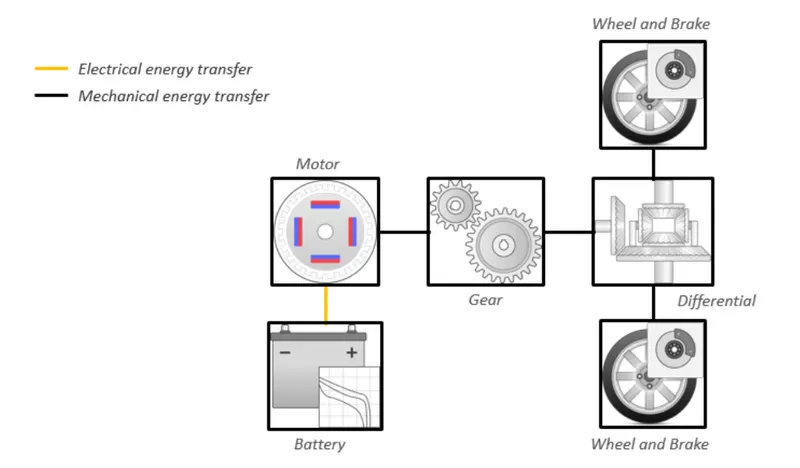
The Model of Pure EV with WOT drive cycle as shown below fig.
Output waveforms of pure EV:
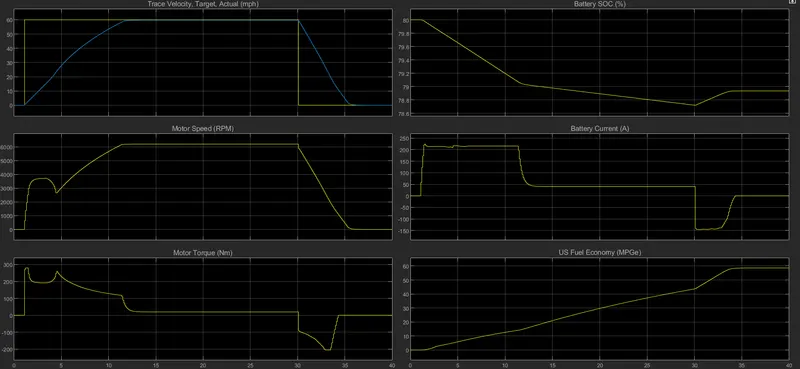
Plot 1:- graph between velocity and time on x & y axis respectively.
Peak velocity=59mph
Time taken by vehicle to accelerate and reach the peak velocity=10.9sec.
Time taken by vehicle to deaccelerate and stop =5.3sec.
Plot 2:- Motor speed(RPM)
Motor speed=6208rpm.
Plot 3:- Motor torque(Nm)
Motor torque=280Nm
Plot 4:- Battery current(A)
Maximum discharge current=225A
Plot 5:- Battery SOC(%)
Battery SOC= Constant at 78
Plot 6:- US fuel economy MPGe
Max US fuel economy MPGe=58
| Sr.No | Parameter | HEV | Pure EV |
| 1 |
Peak Velocity |
67 |
59 |
| 2 | Motor peak speed | 8890 | 6208 |
| 3 | Motor peak torque(Nm) | 305 | 280 |
| 4 | Battery current dropdown at | 523 | 225 |
| 5 | Battery SOC constant at | 72 | 78 |
| 6 | Max US fuel economy MPGe | 16 | 58 |
Conclusion:
So as per our comparision with hybrid and pure EV you can see EV is much better than HVE.