Week-4 Challenge WOT Condition Part-2
1. What is the difference between mapped and dynamic model of engine, motor and generator? How can you change model type?
MAPPED:
IMPLEMENTATION:
1. Model uses a set of steady state lookup table to characterize engine performance.
2. the tables provide overall engine characteristics, including actual torque, fuel flow rate, BSFC, and engine-out exhaust emissions.
USES:
1. If you have rngine date from a dynamometer or a desigh tool like GT-POWER.
2. For quasi steady-state engine simulations.
DYNAMICS:
1. Model decomposes the engine behaviour into engine characteristics that are separated into lower-level components. By combining components in this way, the models capture the dynamic effects.
USES:
1. If you need a more detailed dynamic model and have component-level data.
2. To analyze the impact of individual engine components on the overall performance.
2. How does the model calculate miles per gallon? Which factors are considered to model fuel flow?
Get the miles traveled 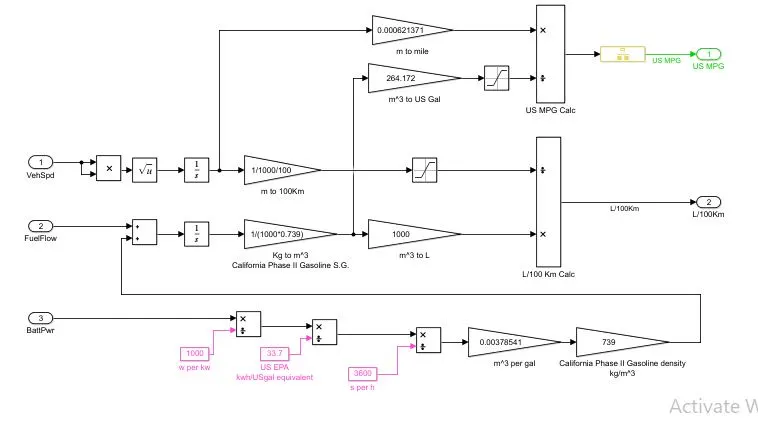
from the trip odometer, or subtract the original odometer reading from the new one. Divide the miles traveled by the amount of gallons it took to refill the tank. The result will be your car's average miles per gallon yield for that driving period.
- Get the miles traveled from the trip odometer, or subtract the original odometer reading from the new one.
- Divide the miles traveled by the amount of gallons it took to refill the tank. The result will be your car’s average miles per gallon yield for that driving period.
-
Here’s the formula: miles driven gallons used = mpg
You can perform the same steps to calculate kilometres per litre.
kilometers driven liters used = kplHere’s an example: 312 miles driven ÷ 16 gallons fueled = 19.5mpg
-
Repeat this procedure every time you refill your tank can help you monitor and improve your gas mileage. Improving your fuel efficiency is possible!
But what about cost? How much does it cost you to drive your car? Finding that out adds another step.
-
How to Calculate Your Rate of Gas
You’ve already calculated how many miles (or kilometers) per gallon (or liter) you can drive in your car. Using that number, you can find out how much it costs you to drive your car per distance measured. Here’s how.
Take the average price that you pay at the pumps per gallon and divide that by the number you found when you calculated mpg for your car. Here’s the formula:
price per gallon miles per gallon = price per mile
Again, you can use a variation of the same equation to calculate price per kilometer:
price per liter kilometers per liter = price per kilometer
Once you’ve found out how much it costs you to travel per unit of measure, you can apply that price to the distance of whatever trip you’re planning. This will tell you how much a given trip will cost in your particular car.
Knowing these amounts can help you improve both your fuel efficiency and your savings every time you drive.
3.Run the HEV ReferenceApplication with WOT drive cycle. Change the grade and wind velocity in the environment block. Comment on the results.
PERFORMCE SCOPE WOT - SCOPE
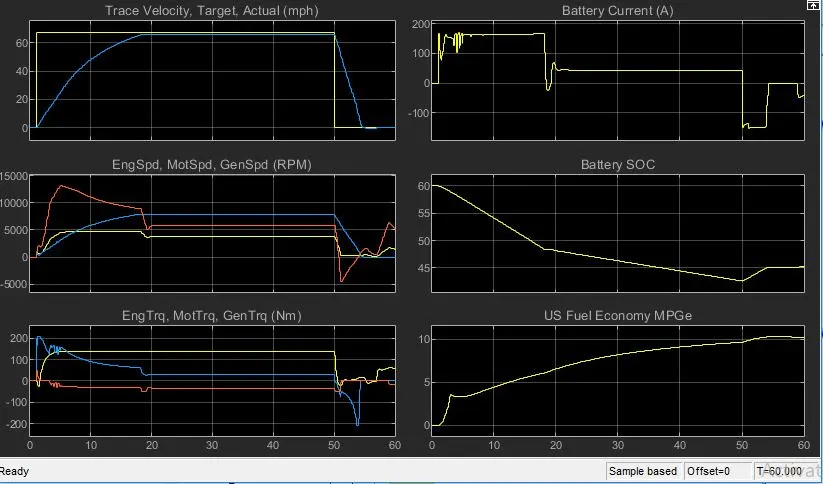
comments and comparision of the result.
1. Plot 1 (Trace Velocity Target vs Actual) this is clearly visible that as the grade and the wind velocity is increased compare to the normal state the velocity is not able to reach the target velocity.
2. plot 2 rpm- in this plot comparing with the normal plot the engine speed has reduced to steep slope on the negative side as compared to the normal situation the gradee is increasing the load on the engine and thus the target engine speed is not met.
3. plot 3 Nm- There are multiple variations in all these aspects and the same is visible in both the results of normal and the grade wind velocity.
4. plot 4 A- Battery current has been flucturated at the higher range as compared to the normal after the vehicle is reaching near to the steady state peace the fluctuation is simulated.
5. plot 5 MPGe - the average fuel economy differ in the range of 6 and 9 mph in both the scenes.
4. Keeping all other parameters same, compare the simulated results of hybrid and pure electric powertrains.
BELOW MENTIONED VEHICLE IS SIMULATED FOR EV
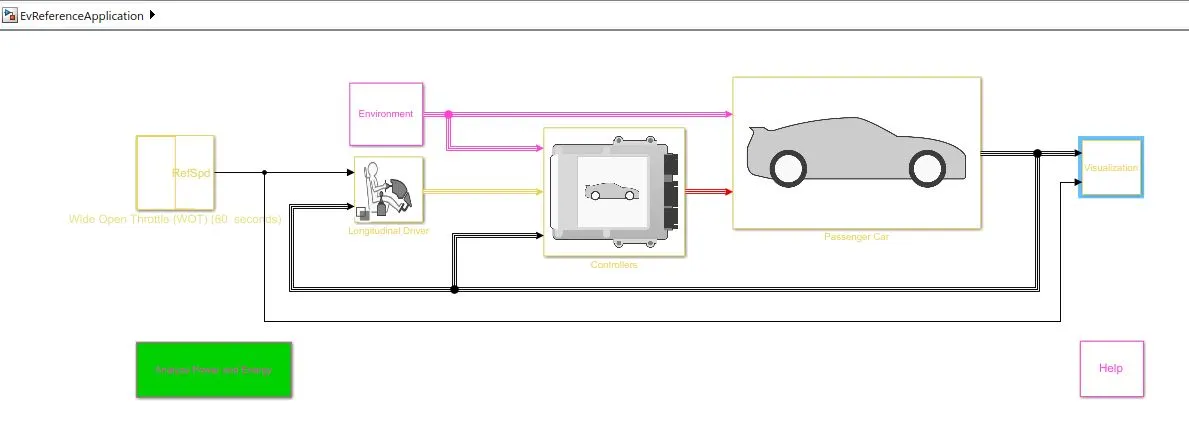
The performance and the FE scope result :
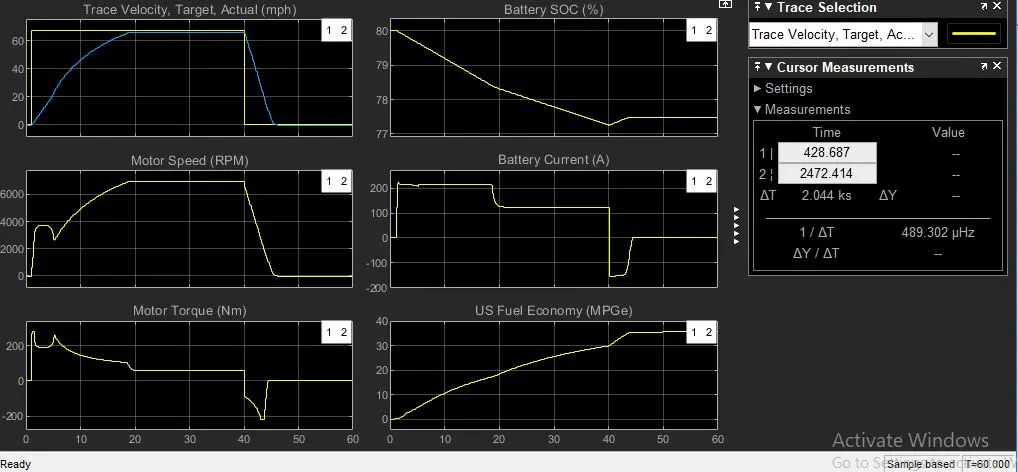
BELOW MENTIONED VEHICLE IS SIMULATED FOR HEV
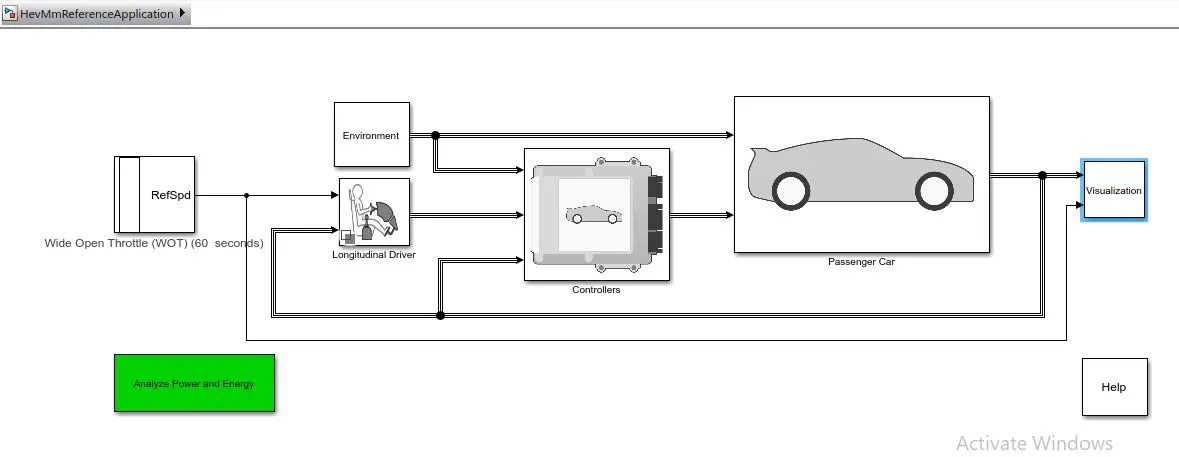
The performance and the FE scope result :
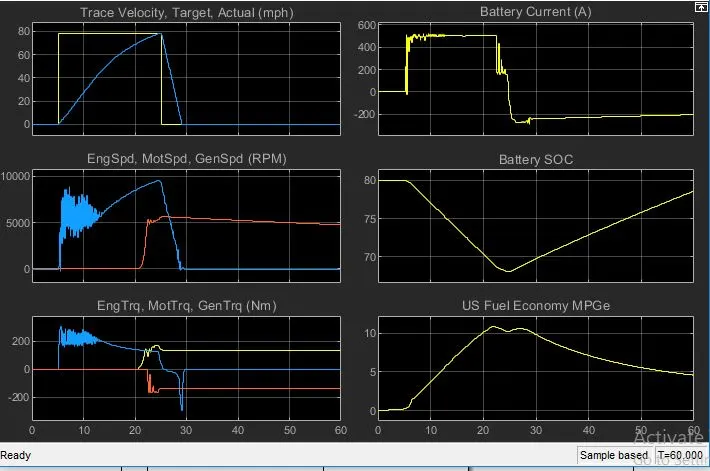
RESULT :
The over all difference is both these simulations are their vehicle operations where the EV is completely operated on battery as the power source and on the other hand the HEV has the two power source SI/CI Engine and battery.
The result obtained are varied and the parameters are also differenciated accordingly.