Week-4 Challenge WOT Condition Part-2
1) What is the difference between mapped and dynamic model of engine, motor and generator? How can you change model type?
*** Difference between mapped model and dynamic model of engine, motor and generator:
* MAPPED MODELS:
Mapped models represent the macro behaviour of the subsystem as a set of lookup tables.
These models are useful for understanding the behaviour of the subsystem using empirical data.
Mapped models are suitable for analysis and design activities that do not require subsystem dynamic characteristics.
* MAPPED MODEL MOTOR:
Macro motor behaviour can be represented as a set of lookup tables of efficiency, torque curve, rpm, power curve and temperature.
* MAPEED MODEL ENGINE:
Macro engine behaviour can be represented as a set of lookup tables as functions of commanded load and measured engine speed.
* MAPPED MODEL GENERATORS:
Macro generator behaviour can be represented as a set of lookup tables of generator efficiency and motor torque.
* DYNAMIC MODELS:
Dynamic models decompose the subsystem behaviour into indidual component models.
Dynamic models are suitable for design control, estimator and diagnostic algorithms that depend on dynamic subsystem states.
Dynamic models are difficult to build for customized operations.
* DYNAMIC MODEL MOTOR:
Dynamic models of a motor decompose the motor behaviour into individual component models, the performance is estimated using real time details and the specifications provided by the user.
* DYNAMIC MODEL ENGINE:
Dynamic models of an engine decomposes the engine behaviour into indivudual component models that account for engine dynamics, mostly intake sirflow and turbocharger dynamics.
The performance is estimated using real time details using the specifications of the designed vehicle.
* DYNAMIC MODEL GENERATORS:
Dynamic models of a motor decompose the motor behaviour into individual component models, the performance is estimated using real time details and the specifications provided by the user.
*** How can one change the model type?:
One can switch between the two models according to his/her application.
First, open the powertrain module for the vehicle and click on the passenger car and select the emectric plant/engine.
Then, right click on the engine/generator on the vehicle model and select subsystem and model reference.
Then select the option convert to the variant subsystem.
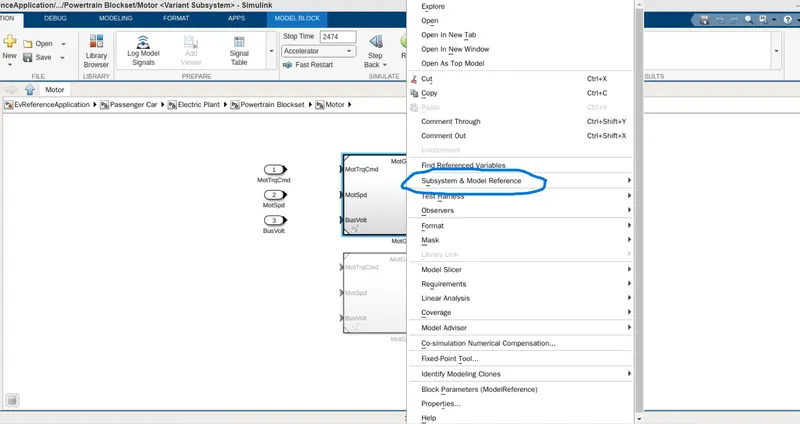
After that click on model explorer, where the model type can be changed.
2) How does the model calculate miles per gallon? Which factors are considered to model fuel flow?
*** How does the model calculate miles per gallon?:
* MILES PER GALLON:
Miles per gallon is a fuel economy rating determined by how far a car can travel usoing one gallon of diesel or petrol.
In the case of electric vehicle, this is a measure of how much electrical energy is consumed by the battery pack to travel a fixed distance.
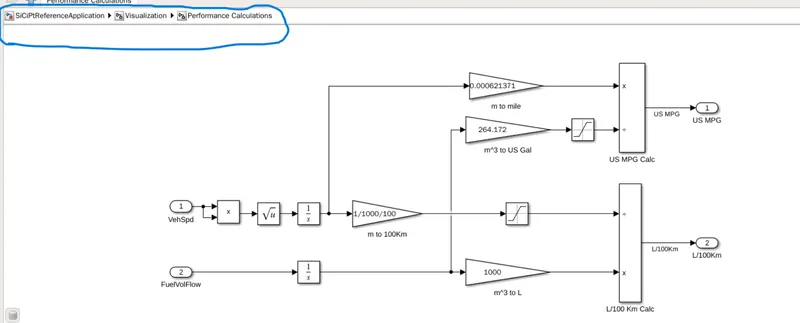
* The powertrain blockset has a model that calculates the miles per gallon for all kinds of vehicles.
* CONVENTIONAL VEHICLE:
* HYBRID VEHICLE:
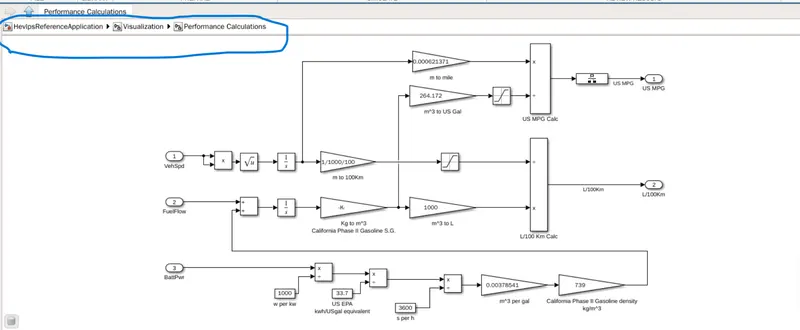
* ELECTRIC VEHICLE:
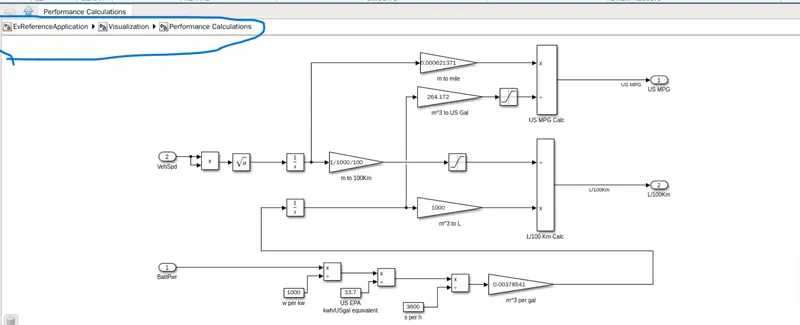
The model takes an input of vehicle speed, fuel economy and battery power to calculate fuel consumption and the equivalent battery consumption to calclate the miles per gallon.
* CALCULATING MILES PER GALLON:
The inputs from the vehicle speed are taken into calculation and ids converted to the miles by multiplying with 0.000621371
After that the inputs from fule flow is taken in m^3 and are converted into equivalent US gallons by multiplying with 264.172
Finally, the two inputs miles covered and equivalent US gallon are further divided and the results is got in miles/gallon.
*** Factros considered to model fuel flow:
FUEL ECONOMY:
The fule economy of an automobile realtes distance travelled by a vehicle and the amount of fuel consumed, consumption can be expressed in terms of volume of fuel to travel a distance or the distance travelled per unit volume of fule consumed.
The fule consumption of vehicles is a significant factro in air pollution and since the importation of otor fuel can be a large part of a nation's foreign trade, many countries impose requirements for fuel economy.
Different methods are used to approximate the actual performance of the vehicel, the energy in the fuels is required to overcome various losses encountered while propelling the vehicle and in providing power to vehicles systems such as ignition or air conditioning
Major factors considered in the fuel economy,
vehicle speed
engine speed
motor torque
FUEL CONSUMPTION:
Fuel consumption is the inverse of the fuel economy discussed above .
It is the amount of fuel consumed in driving a particular distance.
3) Run the HEV ReferenceApplication with WOT drive cycle. Change the grade and wind velocity in the environment block. Comment on the results.
*** Run the HEV ReferenceApplication with WOT drive cycle.
HYBRID ELECRIC VEHICLE:
It is a type of vehicle that combines a conventional internal combustion engine system with an elecrtric propulsion system hybrid vehicle drivetrain.
The presence of the electric powertrain is intended to achieve either better fule economy that a conventional vehicle or better performance.
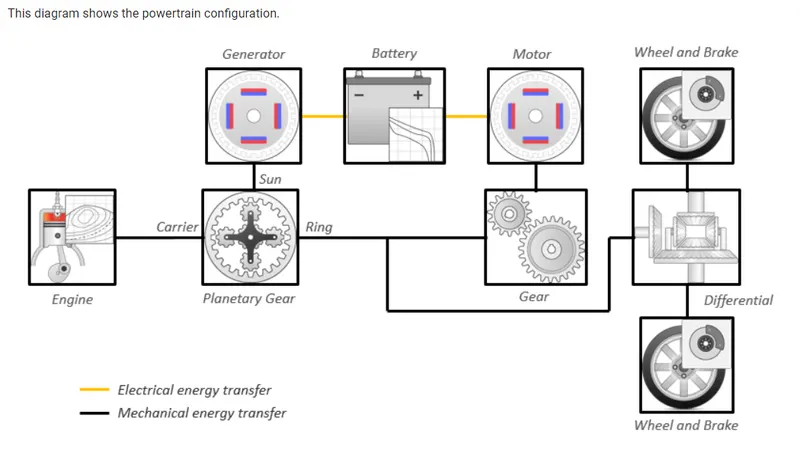
Now, in Matlab with the help of powertrain blockset open the simulink model of the HEV reference application.
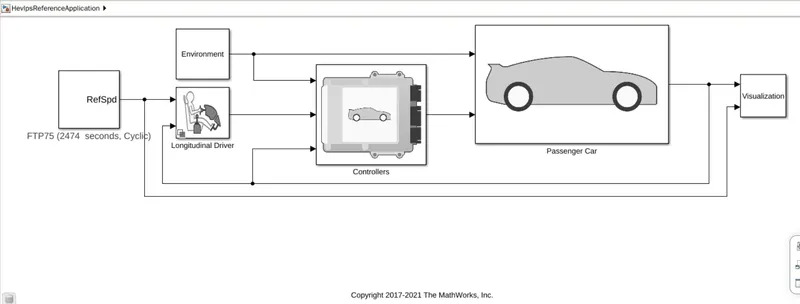
Select the first block in the simulink model and select the wide open throttle(WOT) drive cycle source and then let the grade and the wind velocity remain as it is.
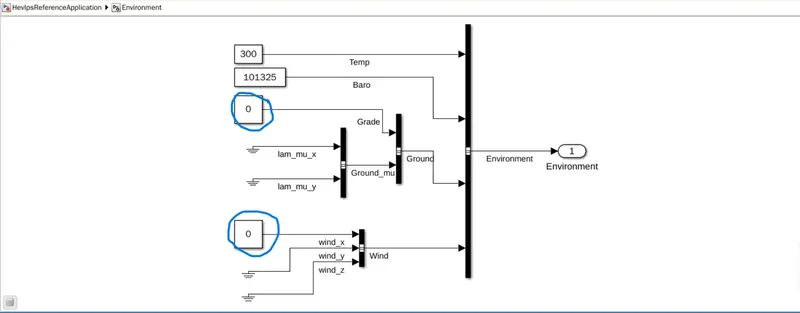
Then the simulation is done for HEV reference application with WOT drive cycle as per the question and the results are obtained.
PLOTS OBTAINED:
(1) Trace velocity, Target, Actual (mph):
It shows the velocity of the vehicle for the drive cycle data with the time scale on the x axis.
It can ve seen that the top speed of the vehicle achieved very fast(11 sec) and the same speed remains till 30 sec.
Top speed comes down to the minimum speed within 3.16 sec and then the simulation cycle continues.
(2) Engine speed, Motor speed, Generator speed (rpm):
It shows the changes in the speed of the engine, motor and generator in rpm throughout the drive cycle.
The engine, motor and generator speed is increasing when the vehicle speed is increasing, it can be seen that generator and engine speed have reaches the peak value when the battery started falling after 40 seconds.
(3) Engine torque, Motor torque, Generator torque (Nm):
It shows the torque characteristics and its changes of engine, motor and generator in (Nm) throughout the drive cycle.
With the WOT specifications, the motro runs at maximum torque, however the power distributed stabilizes between the motor and the engine as the vehicle reaches the desired velocity.
(4) Battery current (A):
It shows the battery current values and its changes for various acceleration inputs as per the drive cycle.
With WOT specificcations the powertrain draws maximum current from the battery and stabilizes as the conditions are met and the engine is activated.
A negaative battery current value indicates regenerative braking and charging by the engine.
(5) Battery SOC:
It shows the battery state of charge SOC and its changes corresponding to the drive inputs.
(6) US Fuel economy MPGe:
It shows the fuel economy as Mile Per Gallons for the corresponding input drive conditions.
*** Change the grade and wind velocity in the environment block.
First, in Matlab with the help of powertrain blockset open the simulink model of the HEV reference application.
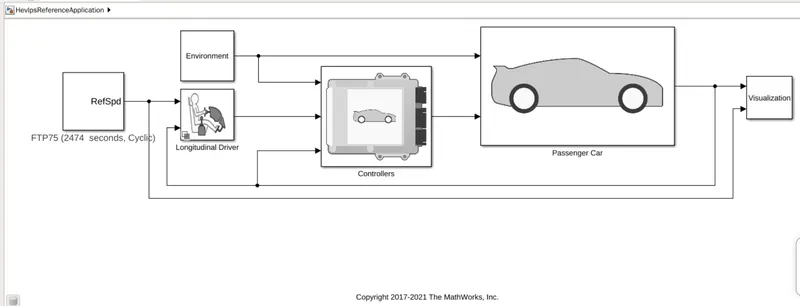
As done previously slect the first block in the simulink model and select the WOT drive cycle source and then change the grade and wind velocity values different from each other.
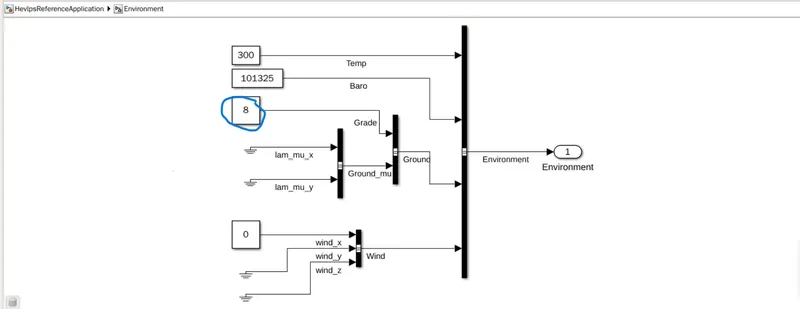
Giving the grade input as 8 degrees.
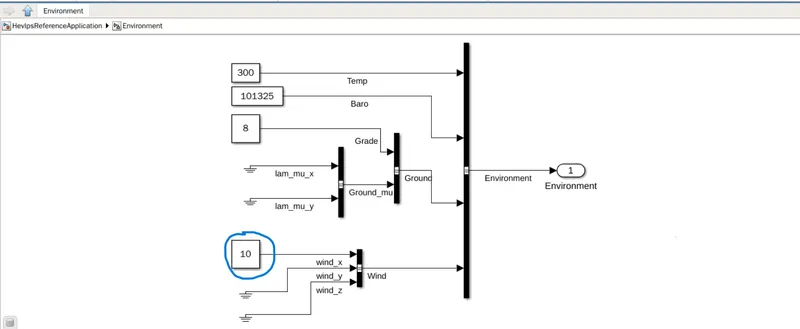
Giving the wind velocity input as 10m/s.
After this the simulation is done and the results are obtained.
There may be many changes in the graphs compared to the previous graphs obtained by keeping the grade and wind velocity same.
PLOTS OBTAINED:
(1) Trace velocity, Target, Actual (mph):
It shows the velocity of teh vehicle fro the drive cycle data with the time scale on the x axis.
It can be seen that the top speed achieved with these conditions is less than the earlier case and time required to reach thr top speed is also higher.
(2) Engine speed, Motor speed, Generator speed (rpm):
It shows the changes in the speed of the engine, motor and generator in rpm throughout the drive cycle.
The motor initiates the initial acceleration to produce propulsion power to reach the specified maximum velocity, but it can be seen that the motor is unable to produce enough propulsion power to reach the desired velocity an therefore the engine contributes to the propulsion effort.
(3) Engine torque, Motor torque, generator torque (Nm):
It shows the torque characteristics and its changes of engine, motor and generator in (Nm) throughout the drive cycle.
(4) Battery current (A):
It shows the battery cyrrent values (A) and its changes for vsrious acceleration inputs as epr the drive cycle.
(5) Battery SOC:
It shows the battery state of charge SOC and its changes corresponding to the driving inputs.
(6) US Fuel economy MPGe:
It shows the fule economy as Mile Per Gallons for the corresponding input driving conditions.
** Therefore, it can be seen that vehicle in where the grade and the wind velocity is equal to zero is more efficient that the another one where the grade and the wind velocity where differernt.
4) Keeping all other parameters same, compare the simulated results of hybrid and pure electric powertrains.
*** Comparison of Pure electric powertrain and the Hybrid vehicle powertrain:
(1) In a pure electric vehicle less top speed is achieved as compared to the hybrid one.
(2) The hybrid vehicle combines the torque of both motor and the engine and this helps in pulling the hybrid vehicles to a hgher speed compared with the pure electric vehicles.
(3) The pure electric vehicles uss lithium ion battery and the hybrind vehicles uses the nickel metal hybrid battery.
(4) The battery discharging and the charging rate is higher in the pure electric vehicle compared with the hybrid vehicle.
(5) The pure electric vehicle produces zero emissions but the hybrid vehicles produce a lot of air pollution by its emission.
(6) From the data of Miles Per Gallons for both the pure electric and the hybris vehicles it is can be observed that the pure electric vehicle has more efficiency and the hybrid vehicle has a lower efficiency.