Week-4 Challenge WOT Condition Part-2
WIDE OPEN THROTTLE CONDITION-PART-2:
OBJECTIVE:
- To Highlight the Difference between the mapped and dynamic model of Engine, Motor, and Generator.
- To explain the miles per gallon calculation and to define the factors that influence the fuel flow
- To Run the HEV ReferenceApplication with WOT drive cycle and Change the grade and wind velocity in the environment block and Comment on the results.
- Keeping all other parameters same, compare the simulated results of hybrid and pure electric powertrains.
PROCEDURE:
1)Difference between the mapped and dynamic model of Engine, Motor, and Generator.
MAPPED MODEL:
- The mapped model is one type in which the values are pre-defined in lookup tables.
- In this method, it generates output as defined previously without considering real-time factors.
- The accuracy of this type is comparatively less to dynamic model but it requires less simulation time.
DYNAMIC MODEL:
- The dynamic model uses the combination of outputs from various subsystems to generate the output.
- The outputs are generated in real-time based on the inputs from the various subsystems.
- The accuracy of the model is very high as it considers inputs from various subsystems in realtime.
- Since it considers input from various subsystems in real-time it requires more simulation time.
2)Miles Per Gallon Calculation:
MPG:
- Mpg Stands for "Miles Per Gallon" and it is used to denote How far the car able to travel every gallon(4.55litres) of fuel it uses.
Forex:
- If you own a car which returns 60Mpg and its fuel tank has only one gallon of fuel (petrol or diesel), you should be able to drive 60 miles before the car runs out of fuel.
- The US uses miles per gallon but many other countries show the efficiency of the car by saying how many litres of fuel it uses after it's been driven for 100Km(Roughly 62miles).
- To convert 1/100km to mpg, it's helpful to know that 282.5mpg is same as 1/100km. As a result, dividing 282.5 by the car's fuel consumption in 1/100km will give you the results in mpg.
- Dividing 282.5 by a car's mpg figure will also give you its results in 1/100km rating.
MPGe:
- MPGe is the abbreviation for "miles per gallon of gasoline-equivalent."
- It's an energy efficiency metric that was introduced by the Environmental Protection Agency(EPA) in 2010 to compare the amount of energy consumed by alternative fuel vehicles to that of traditional gas-powered cars.
- If a vehicle uses non-liquid fuels that aren't burned and get its power from electricity or compressed natural gas, it's rated in MPGe.
- According to EPA, burning one gallon of gas produces 115,000BTUs(British Thermal Units).
- To generate the same amount of heat by way of electricity, it takes 33.7 kilowatt-hours(kWh).
- Kilowatt-hours is the standard energy unit for electricity.
Forex:
- If an electric vehicle can travel for 100 miles on 33.7kWh of electricity, the EPA rates it as 100MPGe.
- Even though the car's MPGe number is a good way to compare it's energy consumption that of a gas-powered car, it does not give us complete details regarding the vehicle's fuel cost.
- If an electric car gets 135MPGe compared to a gas car's 34MPG, it is clear that the electric car is more efficient than the gas-powered car but how much does electricity cost at 135MPGe?.
- In order to find the solution for the above case, the EPA provides another metric data.
- The EPA specifies a car's kilowatt-hours-per-100-miles rating(kWh/100mi), or the number of kWh necessary to travel 100 miles.
- This rating gives you a clear idea that how good a vehicle is at turning its electricity into miles of range.
- Unlike miles per gallon (where a higher number is better), the lower the number of kilowatt-hours required to go 100 miles, the better.
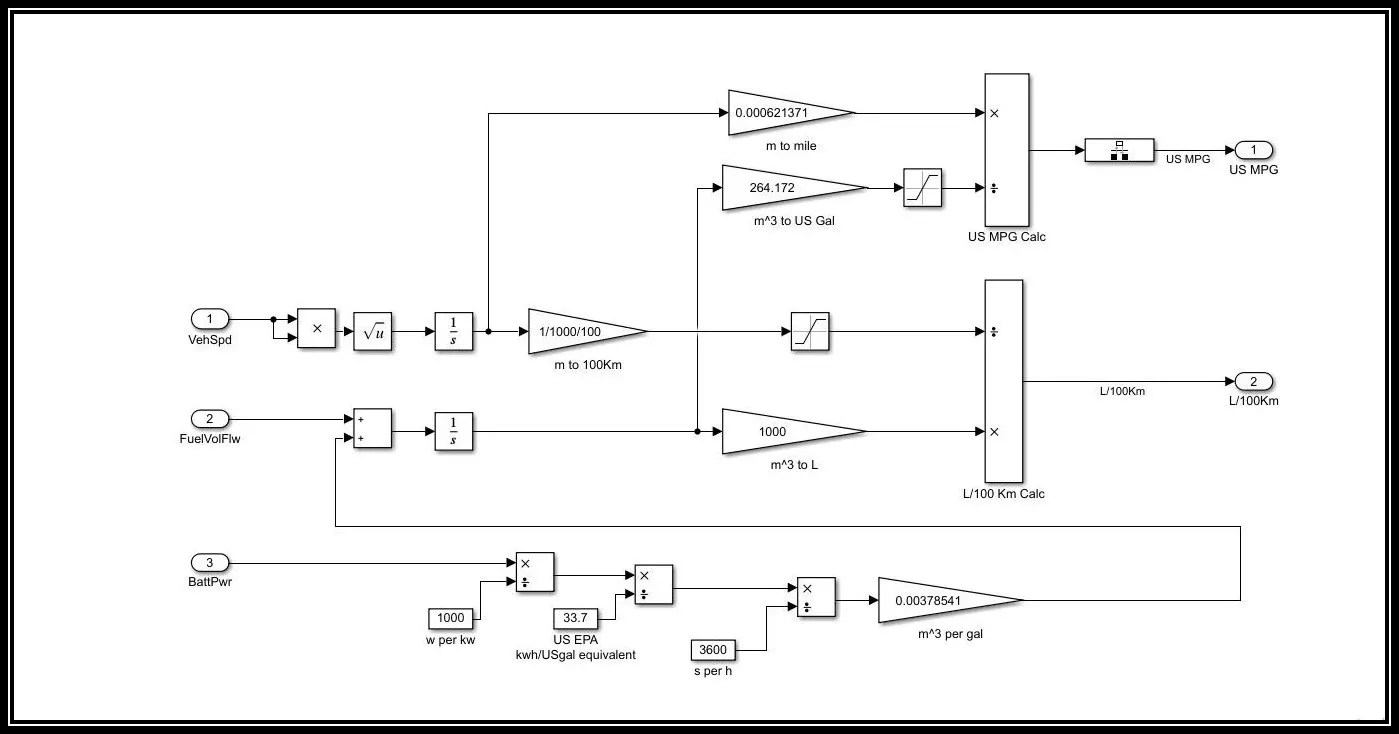
Calculation of US MPG:
- The vehicle Speed is squared and the square root is taken, since the vehicle speed is sensed by sensors errors may come. In order to reduce the error, we use this way.
- Using the vehicle speed, the distance can be calculated by integrating the vehicle speed.
- Since the vehicle speed is in m/s, we need to convert it into miles.
- In order to do that we are using the gain block to multiply the input with 0.000621371.
- The Battery power is converted into KW by dividing the watt value by 1000.
- Then, in order to convert it into US EPA equivalent divide it with 33.7 value.
- Then the value is divided by 3600 in order to convert the seconds into hours.
- Then using the gain block the conversion of US EPA gal into m^3 is done.
- Since this is a Hybrid vehicle Both the battery consumption and fuel consumption are considered.
- So, both the values are added and it is integrated.
- Then to convert the m^3 to US Gal, we need to multiply 264.172 with the m^3.
- In order to do that, we use the gain block.
- Then using the saturation block, the upper and lower limits are defined.
- Then the miles per gallon is calculated by diving the gallons to the miles travelled.
- This can be viewed as a graph by using the scope block.
Calculation of Consumption of litres per 100km:
- The vehicle Speed is squared and the square root is taken, since the vehicle speed is sensed by sensors errors may come, In order to reduce the error, we use this way.
- Using the vehicle speed, the distance can be calculated by integrating the vehicle speed.
- The conversion of metre to 100Km is done using the gain block.
- Then this was given as input to the saturation where the upper limit and lower limit is defined.
- The Battery power is converted into KW by dividing the watt value with 1000.
- Then, in order to convert it into US EPA equivalent divide it with 33.7 value.
- Then the value is divided by 3600 in order to convert the seconds into hours.
- Then using the gain block the conversion of US EPA gal into m^3 is done.
- Since this is a Hybrid vehicle Both the battery consumption and fuel consumption are considered.
- So, both the values are added and it is integrated and it is converted to litres by multiplication with 1000.
- Then, in order to calculate how many litres travelled per 100 km, the litres calculated is divided by the distance calculated in terms 100 km block.
- The output is viewed in a graph using the scope block.
Factors to be considered to model fuel flow:
- Driving Behavior: rapid acceleration, driving at inconsistent speeds.
- Weather: The colder it is, it takes more fuel flow.
- Weight: The Gross vehicle weight also influences the fuel flow.
3)To run the HEV reference application with WOT drive cycle and to change the grade and wind velocity in the environment block.

- Using the help file in Matlab, the Hybrid Electric Vehicle multimode reference application was opened.
- After opening the file, change the drive cycle mode to WOT using the drive source block.
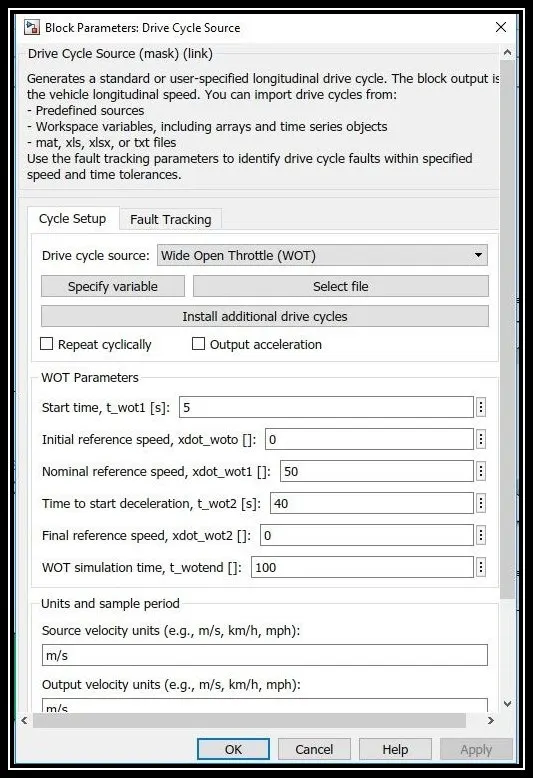
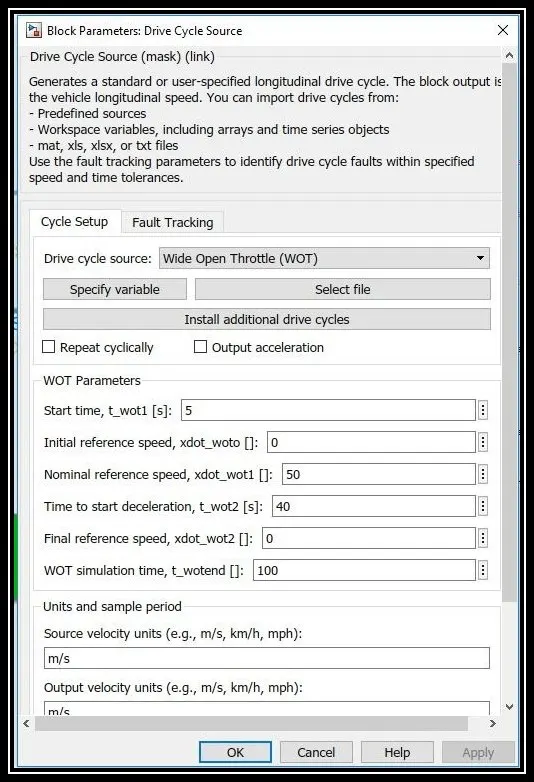
- Input the values into the drive cycle block Such as Nominal reference speed, time to start deceleration, WOT simulation time.
- Then change the simulation time according to the WOT simulation time given in the drive cycle block.
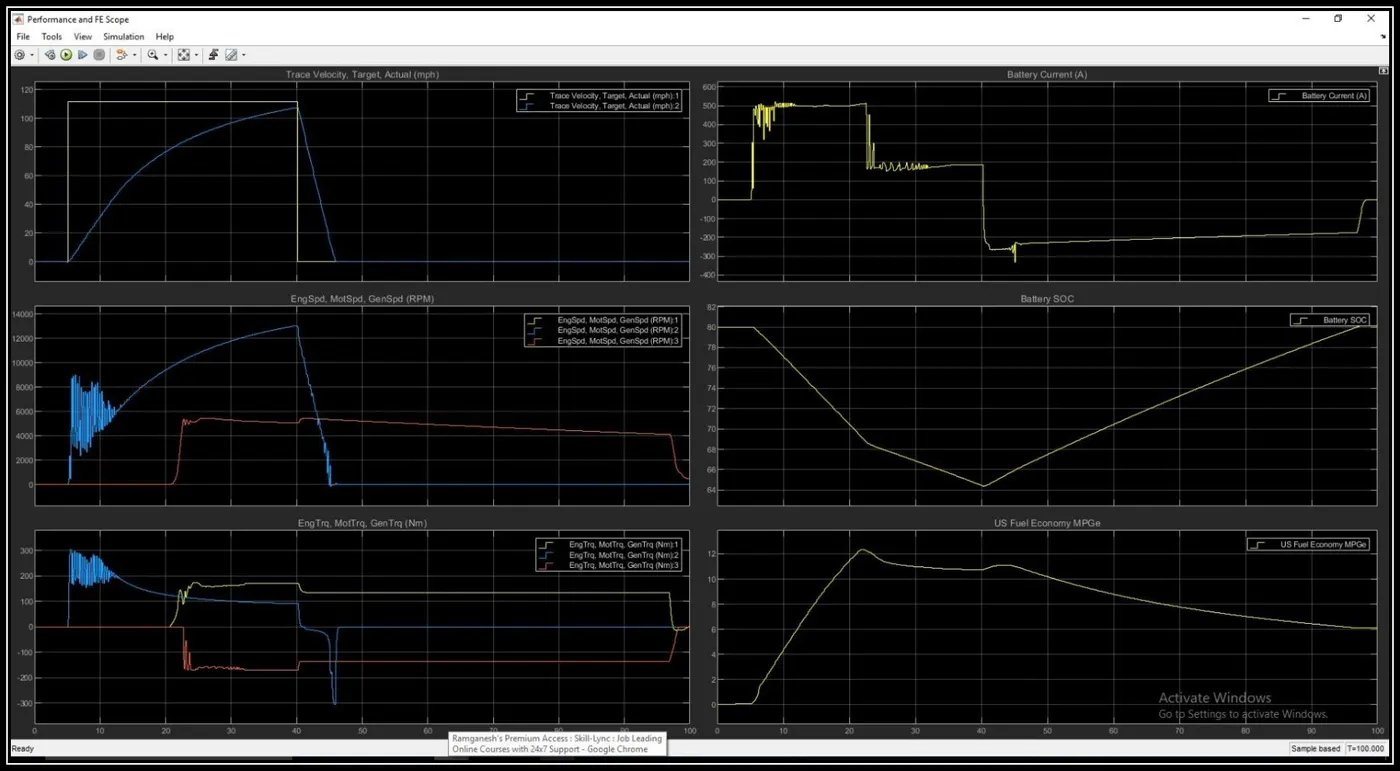
- Using the scope block view the results.
RESULT:
Fig:1
Change the Grade and Wind Velocity:
- With the same above mentioned WOT condition, change the grade and wind velocity.
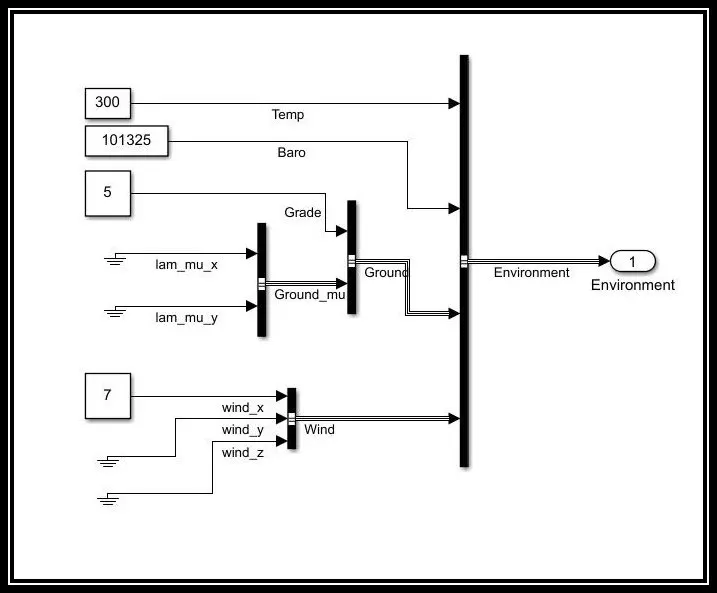
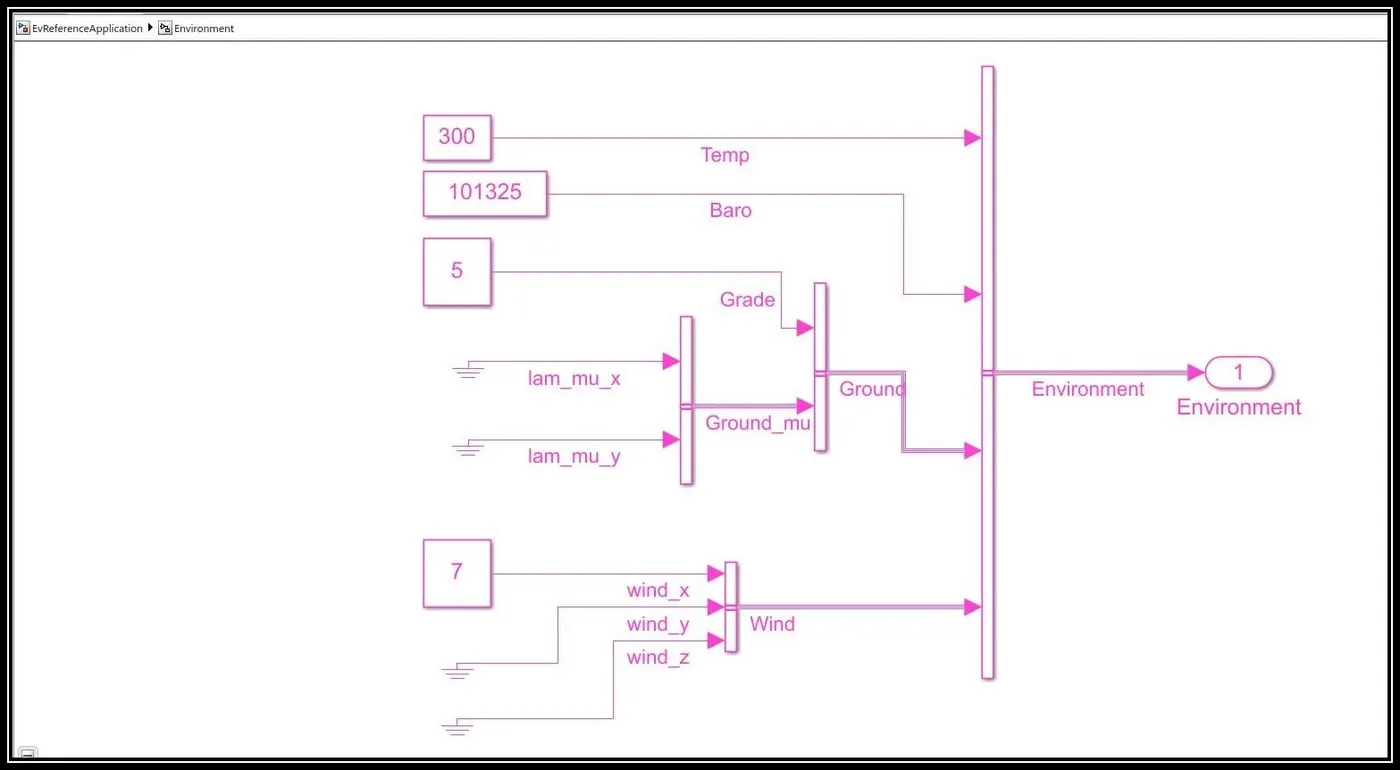
- By clicking on the Environment block you can able to view the above parameters in the block.
- In that change the grade and wind value in order to compare the results initially, it was zero.
- Click on the run command in order to view the result.
Result:
Fig-2:
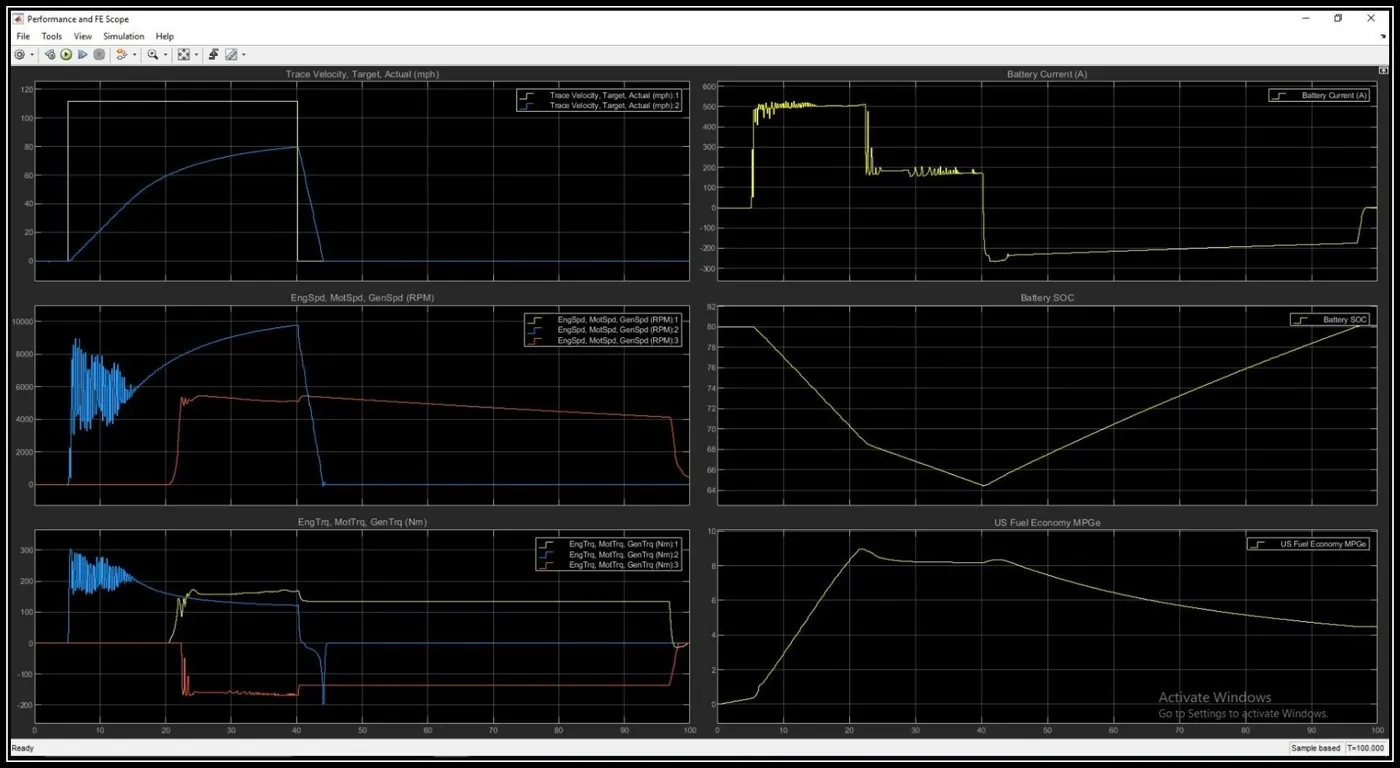
- From the above two results, it was inferred that as grade and wind velocity is applied, the distance covered by the vehicle decreases drastically and also the max velocity also decreases.
- In the fig-1 you can observe that the trace velocity reaches almost 105mph in 40 seconds whereas in fig-2 it reaches up to 80mph only.
- Similarly, in the fig-1 it is clear that during the initial acceleration it covers 12miles for 22 seconds due to less opposing force whereas in fig-2 it covers only 9miles(approx) for 22 seconds.
- Thus based on the results we observe that when grade and wind velocity increases, the distance covered by the vehicle decreases.
4)To keep all parameters same compare it with the pure electric vehicle powertrain:
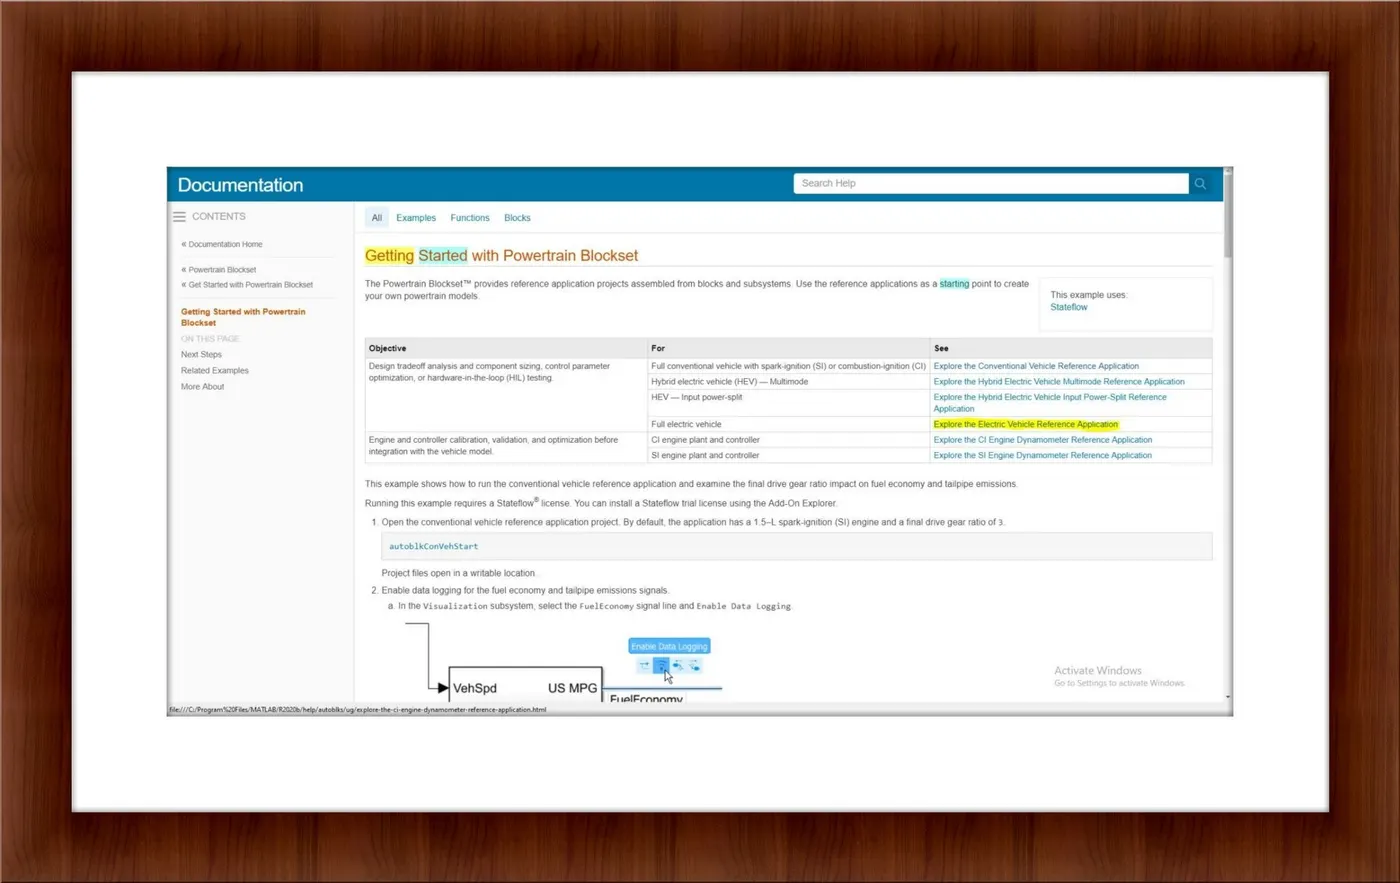
- Using the Matlab help command search EV reference application file and click on open to open the Simulink model.
- Then change the conditions the same as given in the Hybrid model.
- Change the drive cycle to WOT and enter the same values.
- Then open the environment block and change the grade and wind velocity value.
RESULT:
Fig:3
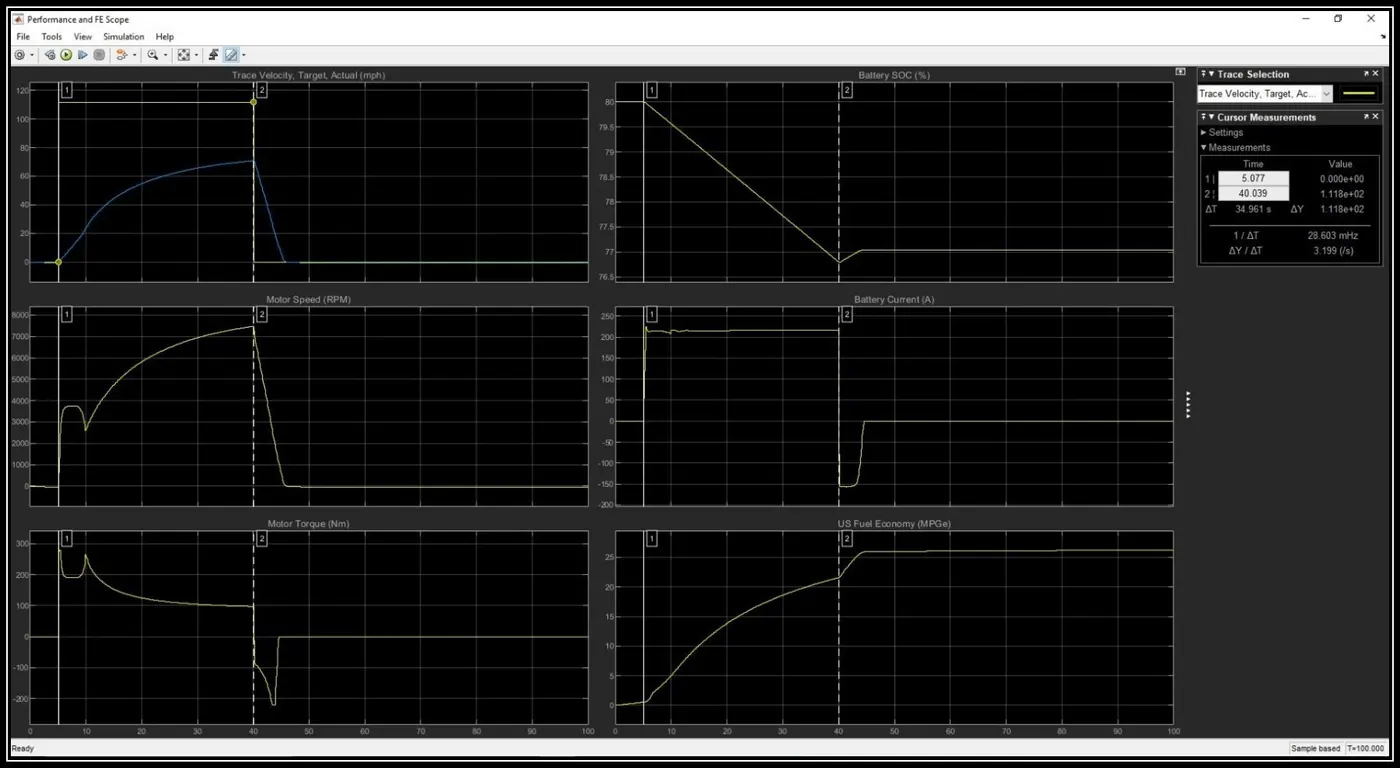
- On comparing fig:2 with fig:3, it is clear that the HEV vehicle has higher top speed it is due to the combination of both the engine and motor.
- Even though the Hybrid vehicle motor produces less torque and less motor speed compared to the electric motor when it combines with the conventional engine the output is higher when compared with the electric vehicle.
- Due to the combination of both engine and motor, the Hybrid vehicle reaches maximum speed.
- Since the electric vehicle uses lithium-ion battery its discharging and charging efficiency is high compared to the battery used in the hybrid vehicle.
- In an electric vehicle, the State of Charge (SOC) of the battery is not decreased drastically as seen in the hybrid vehicle.
- The efficiency of the electric vehicle is high as compared to that of the hybrid vehicle which is evident from the graph US fuel economy(MPGe).
- The electric vehicles are zero gas emissions whereas the hybrid vehicle exhibits exhaust gases.