Week-4 Challenge WOT Condition Part-2
- What is the difference between mapped and dynamic model of engine, motor and generator? How can you change model type? A; Mapped Motor: It is also known as static motor where the model runs based upon look up tables or some predefined inputvalues. Simulation using this model is fast than the dynamic model.
Dynamic Motor: This model represents the real time working of the model. It represents the actual model of the equipment. It does not take any predefined values as input. It takes the real time values inputs and gives the output continuously.
Mapped Generator: This is also similar like the mapped motor, where the input values for the generator block are predefined or it takes from the lookup tables. Here also simulation time is less when this model is used.
Dynamic Generator: This model also represents actual generator which work in a real time environment. Here the input values
are not taken from look up tables, the output values are calculated continuously according to the changes in input values. Here
also simulation time is more compared to mapped Mapped Engine: It is a steady-state model where all the input parameters like air mass flow, fuel flow, exhaust temperature,
efficiency, and emission performance are taken from look tables where values are predefined. Simulation time here is less when
this model is used.
Dynamic Engine: This model also represents the actual working of the engine in real time. The input values change every time
so the output values from the model also changes continuously. Here also simulation takes more time to complete To change the model from dynamic to mapped,
1. In the reference application model where ever the mapped model is used, below that a dynamic model is also present
and its connected out since the connection s are given to mapped models.
2. To use the dynamic model, first we have to comment out the mapped model and then connect all the inputs to the
dynamic model.
3. Similar way is used to change from dynamic to mapped model.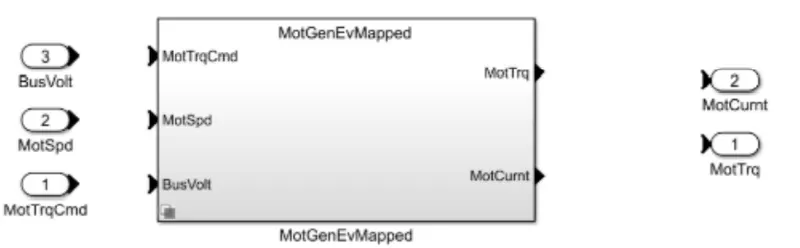 2. To see how does the model calculates miles per gallon? Which factors are considered to model fuel flow? . Miles per Gallon is a fuel economy rating determined by how far a car can travel on a gallon of petrol or Diesel for a Engine
powered car.
. In case of an electric vehicle it tells us the energy which is equivalent that of a engine powered carto propel the car through a
distance.
. The amount of Fuel Energy required to move a engine powered car through a distance is determined and then it is compared to
the eqivalent amount of electric energy required to move the car throgh the same distance and is expressed as the miles per
gallon.
.The powertrain blockset has a model that calculates the miles per gallon for all kinds of vehicle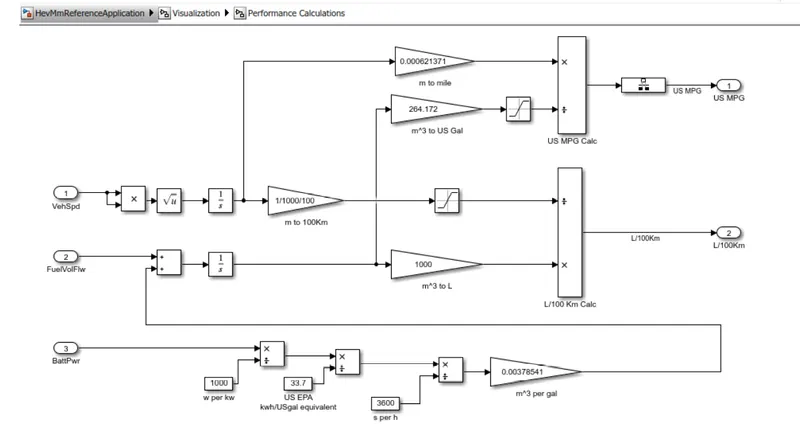 . The above model takes the input of the Vehicle speed , Fuel flow and Battery power to calculate the fuel consumption and the
equivalent battery consumption and calculates the miles per gallon. Vehicle Speed And Fuel Flow: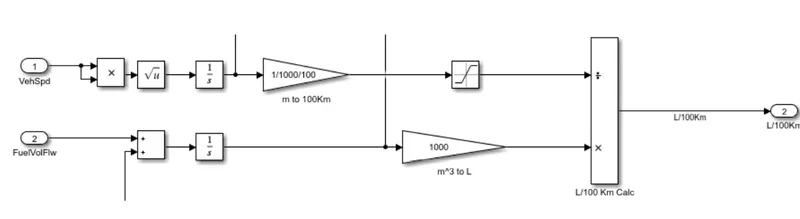 . The Vehicle speed is a important factor while considering the fuel consumption at that particular time,so to determine the fuel
consumption throughout the drive cycle.
. To convert speed to Distance we can Integrate with time and we are doing the same of converting the velocity to get distance
covered by integrating. Batter power;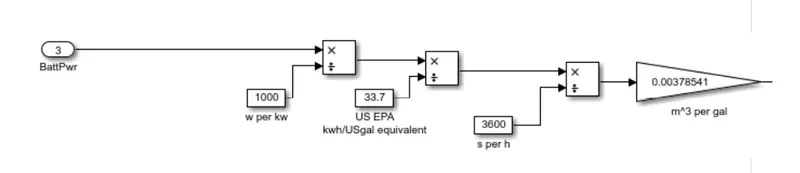 . The amount of Energy from battery power required to propel the vehicle Equivalent to that of the Engine is calculated here.
. The battery power is given in watts and it is converted to Kw by dividing with 1000.
. Then we convert the power into energy by multiplying with the time into KWh.
. Then we convert the Energy from kWh to equivalent energy in US gallon of automotive gasoline by dividing with 33.7. since we
get the energy in US Gallons equal in KWh we are trying to get the energy of equivalent LIS Gallons per seconds and we do this
by dividing with 3600 and we convert the hour to seconds.
.Then multiplying with 0.00378541 we convert the US Gallons per sec to the volume of the fuel flow in (mA3/ s) and then we
multiply with 739 (California Phase Il Gasoline density) (i.e) mA3/s * kg/mA3 Calculating Miles Per Gallon ;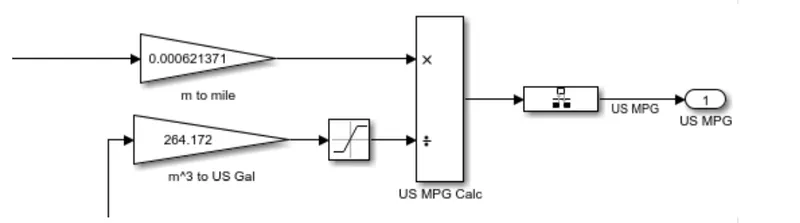 3 To run the HEV Reference Application with WOT drive cycle and to change the grade and wind velocity in the environment block
and comment on the results. A;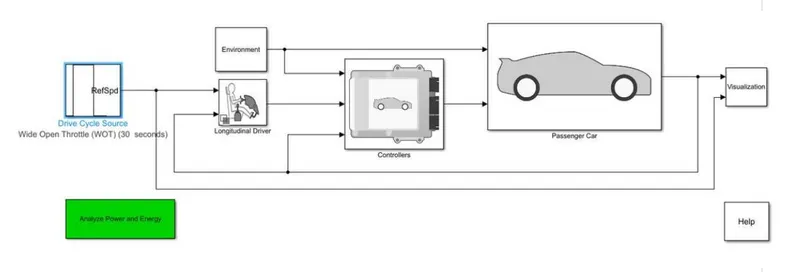 1. To change the drive cycle, click on the ‘Drive Cycle Source’ block and from the drop down, select WOT option.
2. Now run the model to observe the results.

 3. We will the above results once the simulation has ended. In the first graph we can see the difference between drive cycle and
actual velocity change. To attain maximum speed, it takes nearly 18 seconds and to reach zero velocity from maximum velocity
it takes nearly 5 seconds. So, to reach top speed and again come back to rest it takes total of 23 seconds. So, the actual time
varies from the drive cycle time. 4. In the second graph we can observe that while achieving the top speed, the speed of motor is varying continuously and once
achieved the speed of motor is constant and then the speed reduced continuously to zero. High speed of motor is observed
when the vehicle is reaching maximum speed.
5. In the third graph we can observe that the motor is giving high torque to achieve the top speed and then slowly is its reducing.
Once it reaches the top speed then the motor torque slowly reduces and reaches zero. From here it goes negative because the
motor is rotating due to vehicle speed thus the torque produced is due to vehicle, not due to motor so, its negative.
6. In the fourth graph we can see that the current consumed by motor is high when vehicle is achieving top speed and is constant
until the speed is maximum and then as the vehicle speed decreases the current also decreases and a point it goes to negative
which means that it charged due to regenerative braking and then again becomes zero 4Q; Keeping all other parameters the same, compare the simulated results of hybrid and pure electric powertrains.
A;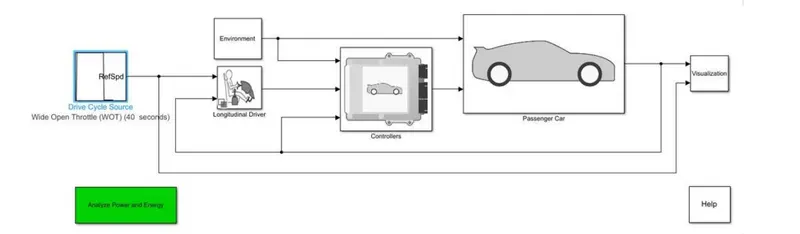
when we run the model, we get the following results.
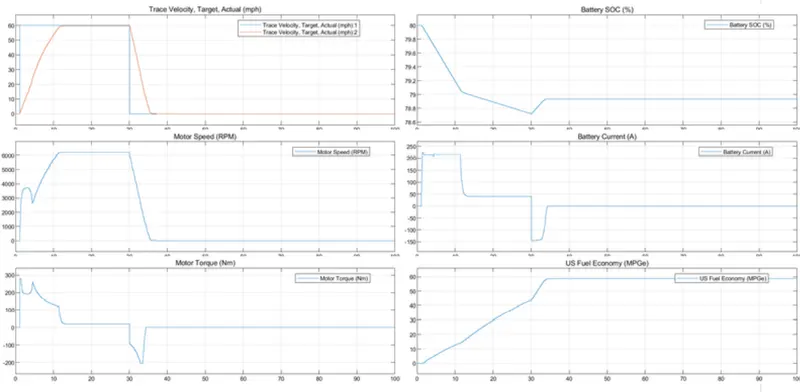 3. Here in the above figure, in the first graph we can see the top speed is achieved nearly at 14 seconds which very quick than the
HEV model graph the time taken to come to zero velocity from top speed is nearly 5 seconds. So totally its takes 19 seconds to
achieve top speed and come back to rest, which is quick than the HEV model.
4. In the second graph, we can observe that the graph is much smother than the HEV model. Thus, in electric vehicle the motor
speed is smoother than the HEV motor speed.
5. In the third graph, here also the torque od motor is much smoother than HEV model an we can also observe that while the
vehicle is decelerating, it is in regenerative braking mode, that’s why the torque is negative while deceleration.
6. In the fourth graph, the SOC of battery is decreases slowly like HEV model but here it decreases much more than the HEV model.
Since in electric vehicle only battery is used so battery is consumed more thus while achieving top speed the SOC line in the
graph falls down more than that of HEV model graph. Since regenerative braking is happening, which charges the battery so the
curve has raised little bit at the end. THE CONCLUSIONS: . The objectives were achieved successfully.