Week-4 Challenge WOT Condition Part-2
Week-4 Challenge WOT Condition Part-2
- What is the difference between the mapped and dynamic models of engine, motor, and generator? How can you change the model type?
Mapped Model:
The mapped model uses a set of steady-state lookup tables to characterize engine performance. The tables provide overall engine characteristics, including actual torque, fuel flow rate, BSFC, and engine-out exhaust emissions.
We use a mapped model,
-
If we have engine data from a dynamometer or a design tool like GT-POWER.
-
For quasi-steady-state engine simulations.
Mapped engines represent macro engine behavior as a set of lookup tables (brake torque, fuel flow, air mass flow, exhaust temperature, efficiency, and emissions) as functions of commanded load and measured engine speed.
Mapped engine models are suitable for analysis and design activities that do not require engine subsystem dynamic characteristics, for example, in engine and transmission powertrain matching analysis for fuel economy, emissions, and performance tradeoffs.
Dynamic Model:
The Dynamic model decomposes the engine behavior into engine characteristics that are separated into lower-level components. By combining components in this way, the models capture the dynamic effects.
We use a dynamic model,
-
If we need a more detailed dynamic model and have component-level data.
-
To analyze the impact of individual engine components on the overall performance.
Dynamic engines decompose engine behavior into individual component models that account for engine dynamics, most notably intake airflow and turbocharger dynamics.
Dynamic engine models are suitable for designing control, estimator, and diagnostic algorithms that depend on dynamic subsystem states, for example, in closed-loop AFR control algorithm development.
Mapped Motor:
The mapped Motor block implements a mapped motor and drives electronics operating in torque control mode. The output torque tracks the torque reference demand and includes a motor-response and drive-response time constant. Use the block for fast system-level simulations when you do not know detailed motor parameters, for example, for motor power and torque tradeoff studies. The block assumes that the speed fluctuations due to mechanical load do not affect the motor torque tracking.
Dynamic Motor:
In the dynamic motor 3 phase, an interim permanent magnet synchronous motor (PMSM) is used. This block uses 3 phase input voltage to regulate the individual phase current allowing control of the motor torque or speed. When the parameters are known in that particular simulation this block is used.
Mapped generator:
In mapped generator, most of the data required is taken from the lookup tables corresponding to the given input parameters.
Dynamic generator:
In a dynamic generator, the user enters the parameters manually during run time for the particular applications.
Below image shows the model for mapped and dynamic:
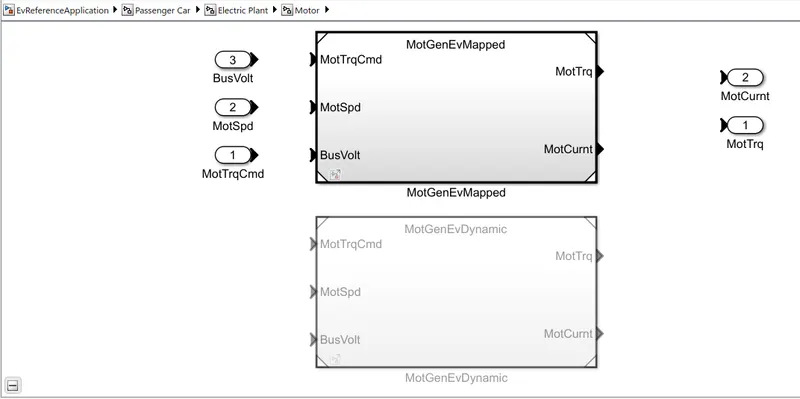
In modeling tab, go to variant Manager to change the model from mapped to dynamic.
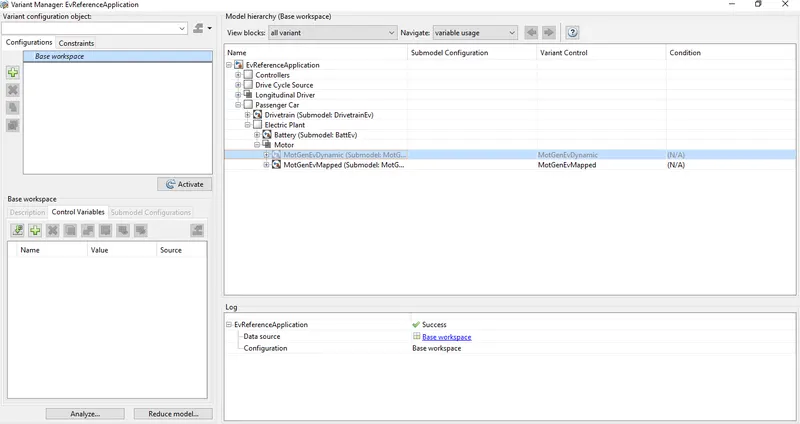
In this right click on the MotGenEvDynamic, then select "Set as Label Mode Active choice".
2. How does the model calculate miles per gallon? Which factors are considered to model fuel flow?
MPG:
MPG, or miles per gallon, is the distance, measured in miles, that a car can travel per gallon of fuel. MPG is also the primary measurement of a car's fuel efficiency: The higher a car's MPG, the more fuel-efficient it is.
The calculations of miles per gallon is done in the visualization block. It is calculated from the value of vehicle speed and the battery power.
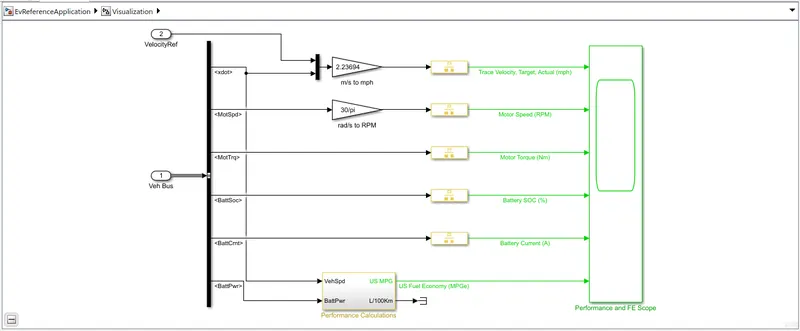
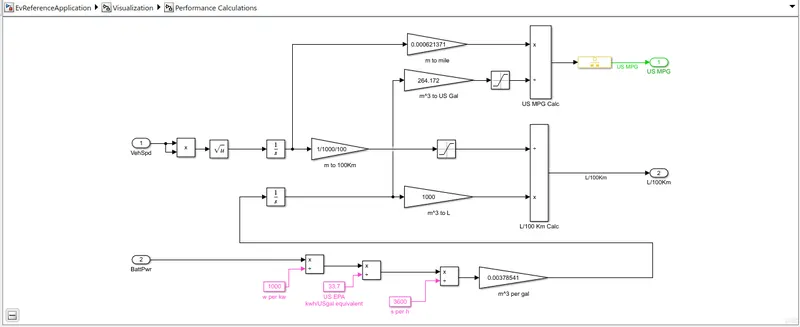
As we can see from the above image, battery power is converted to equivalent miles per gallon value. Also, the vehicle speed is used to calculate the efficiency of the drive cycle.
3. Run the HEV ReferenceApplication with WOT drive cycle. Change the grade and wind velocity in the environment block. Comment on the results.
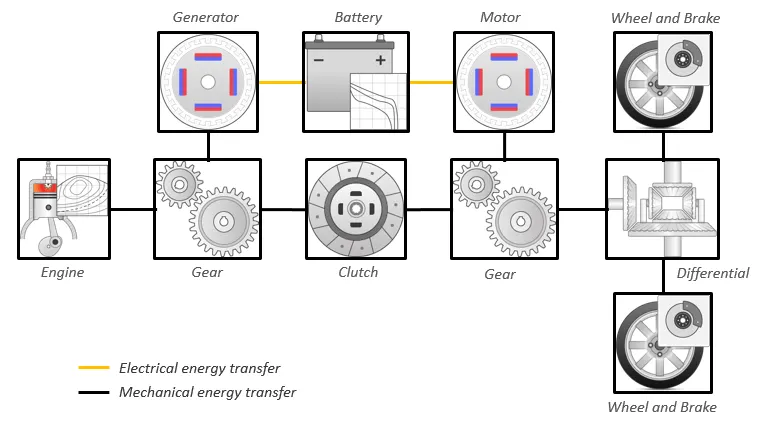
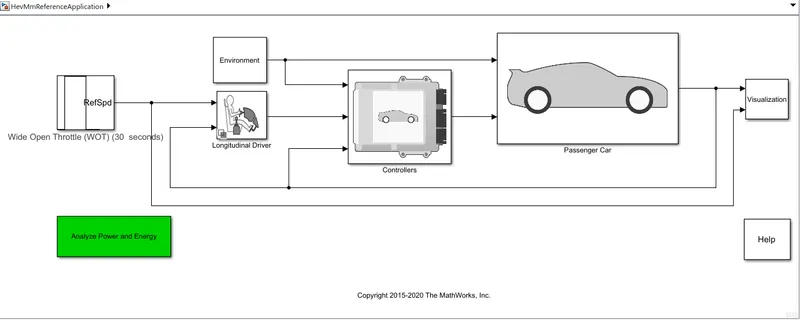
The hybrid electric vehicle reference application represents a full multimode hybrid electric vehicle (HEV) model with an internal combustion engine, transmission, battery, motor, generator, and associated powertrain control algorithms. Use the reference application for powertrain matching analysis and component selection, control and diagnostic algorithm design, and hardware-in-the-loop (HIL) testing.
The power configuration is shown as:
Open the HEV Reference Application block and it is shown as:
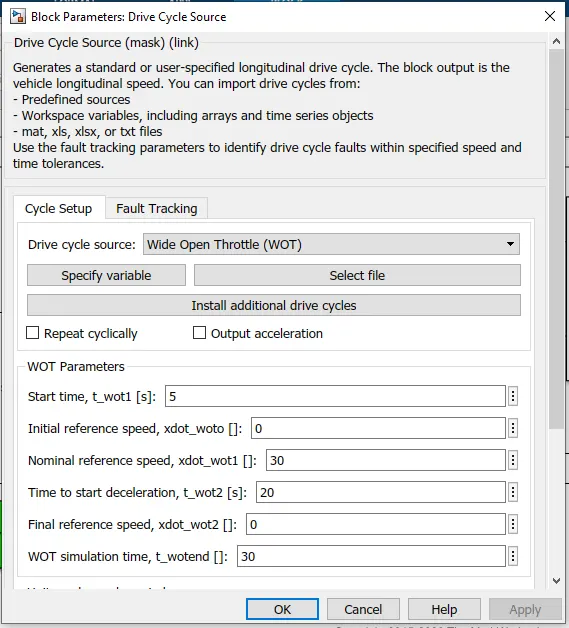
Changing the drive cycle to WOT as :
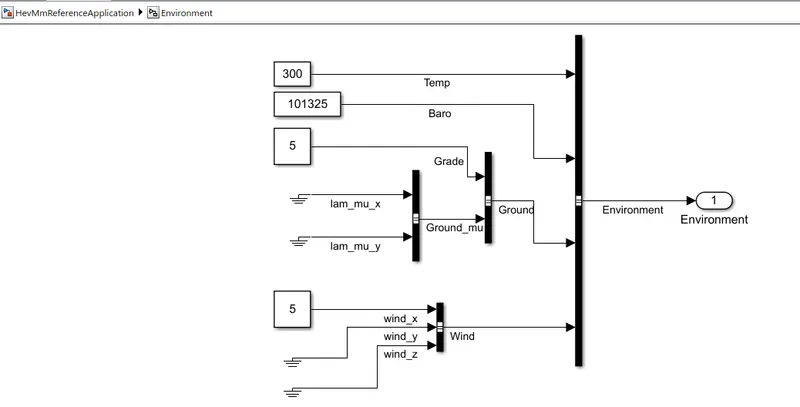
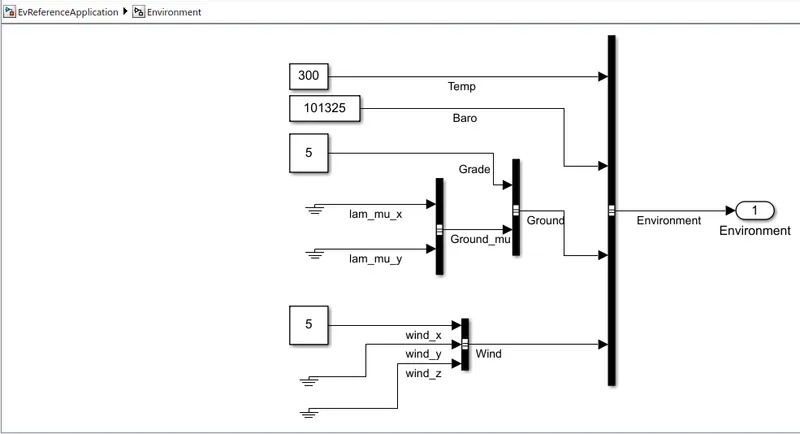
Changing the wind speed and grade values from the environment block as 5 as shown below:
The following graphs are obtained for WOT analysis:
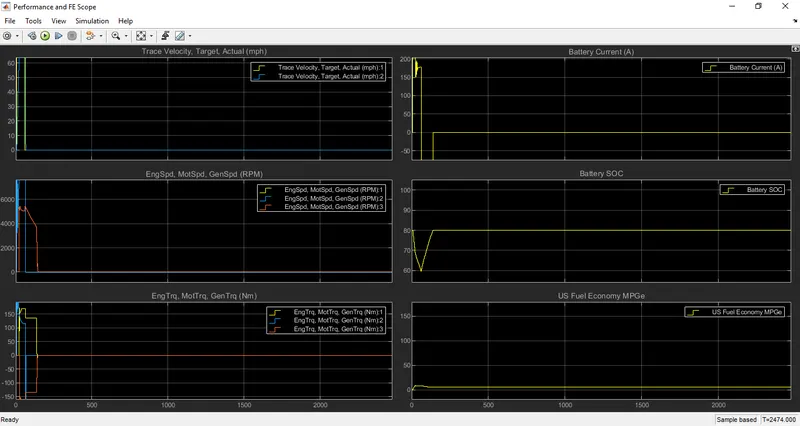
From the above graph we can see that:
Trace velocity target and actual graph: The yellow line indicates the desired path and the blue line indicates the actual path.
Battery current graph: When the vehicle is accelerating the battery current is also increasing, when the velocity becomes constant, the current requirement has also become constant.
Battery SOC: The battery SOC keeps on depleting till the regenerative breaking starts, which increases SOC.
4. Keeping all other parameters the same, compare the simulated results of hybrid and pure electric powertrains.
The electric vehicle reference application is configured with a mapped motor and battery.
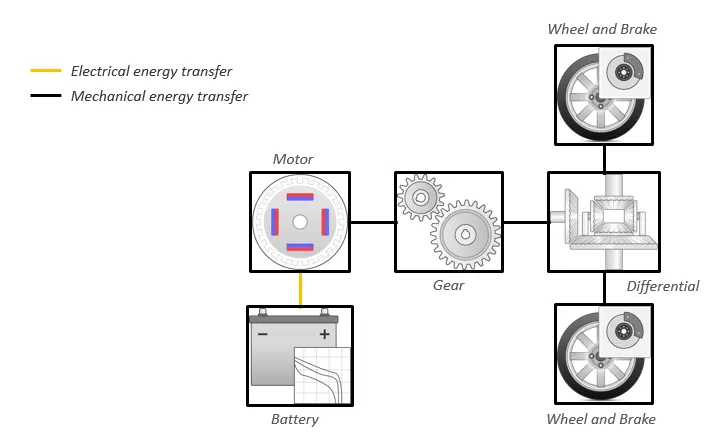
Now simulating the EV with WOT drive cycle and keeping the same drive cycle values and same wind speed and grade values for analyzing and comparing the results of both.
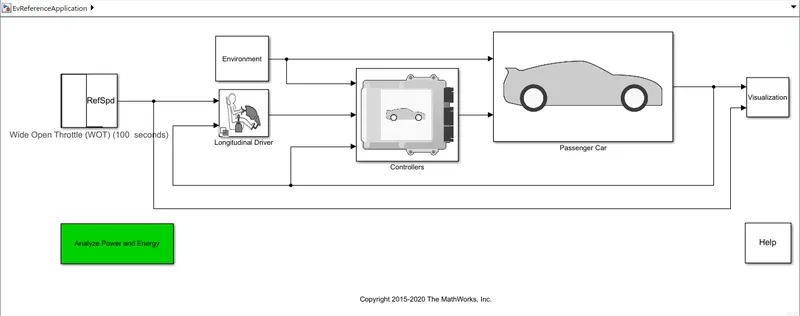
The following figure shows the output graph:
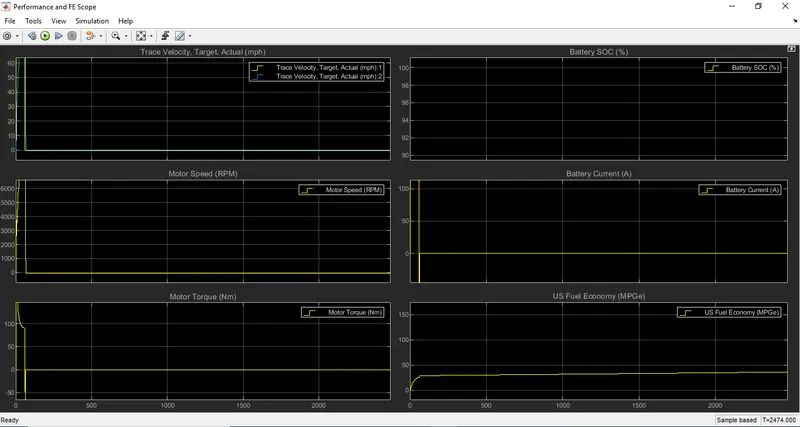
After comparing the outputs for both EV and HEV,
The first graph target and actual velocity are almost the same for both EV and HEV.
The battery current drawn by HEV is almost 200 but in EV it is around 100.