Week-4 Challenge WOT Condition Part-2
What is the difference between mapped and dynamic model of engine, motor and generator? How can you change model type?
| Mapped Model | Dynamic Model |
| Mapped model will run the analysis based on the data given in the lookup table | Dynamic model represents the actual model |
|
Need a data lists to run the analysis and will take less time for analysis |
Dynamic model analysis doesn't required any data and analysis take time due to real models |
| Engine: The effect of the engine can be simulated based on the data interpeted | Engine: Can be simulated based on original specificaiton of the engine and the results are real time |
| Motor: Specifcation such as Motor torque,speed, Voltage datas are to be entered for simulation | Actual motor models is designed and real time value will be given for simulation |
| Genarator: |
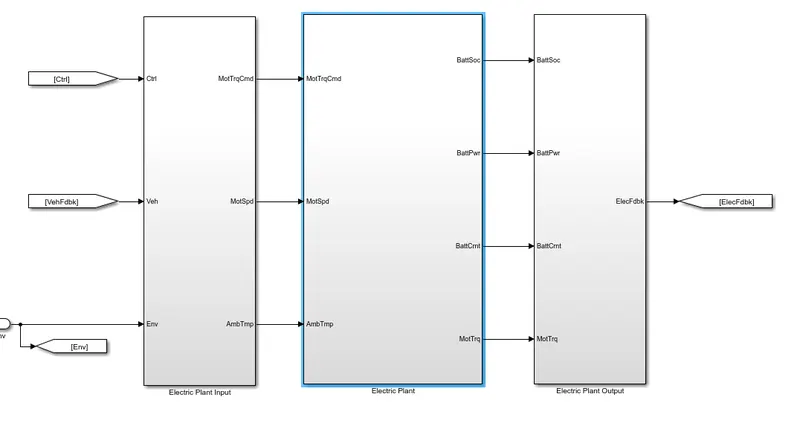
Electric plant block
In below block, the motor torque , Motor spd & Amb temp are given to electric plant as a input.
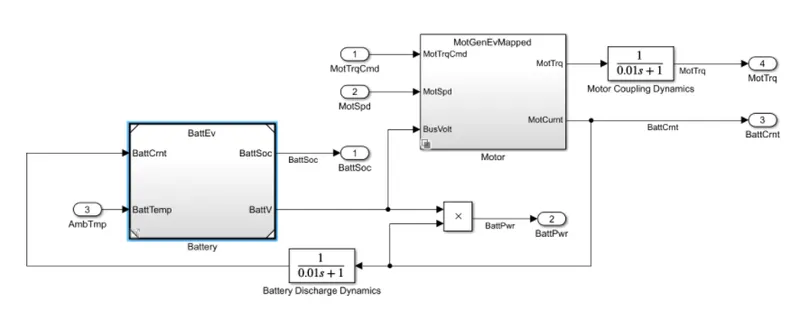
Below is the inside block for Electric plant.
Inputs to these blocks as stated above are Motor trq, speed and Amp tem
Outputs are Battery SOC, Battery current, Motor trq & Battery power
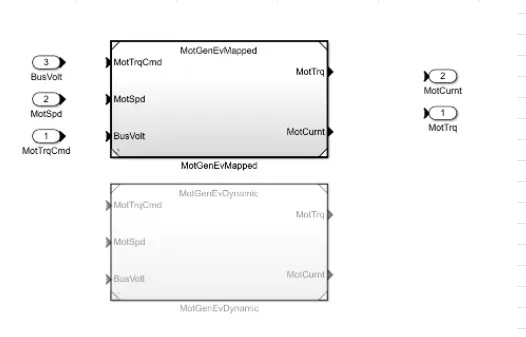
Below is the inside block of Mot Gen Ev mapped
Inputs are Motor trq, speed and Volt
Output are Mot curren and torque
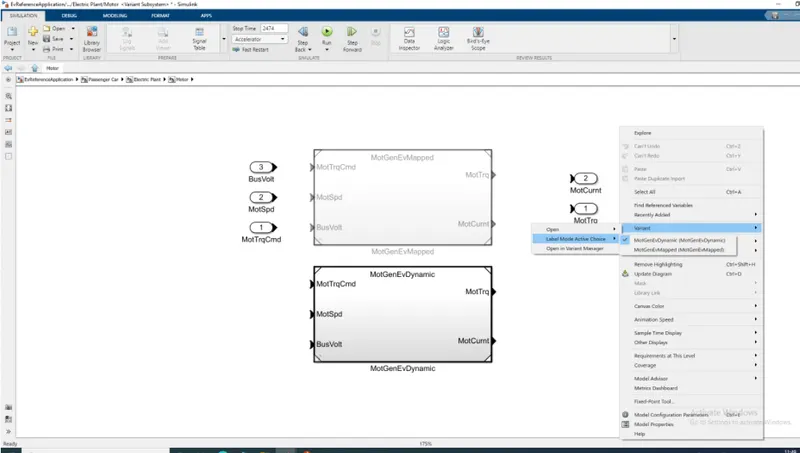
We can change between Mapped and Dynamic mode by right click on somewhere in the model space and select variant and choose the required mode as shown below
------------------------------------------------------------------------------------------------------------------------------------------
How does the model calculate miles per gallon? Which factors are considered to model fuel flow?
MPG stands for miles per gallon and is used to show how far your car can travel for every gallon (or 4.55 litres) of fuel it uses. For example, if you own a car that returns 50mpg and its fuel tank only has one gallon of petrol or diesel in it, you’ll drive 50 miles before the car runs out of fuel.
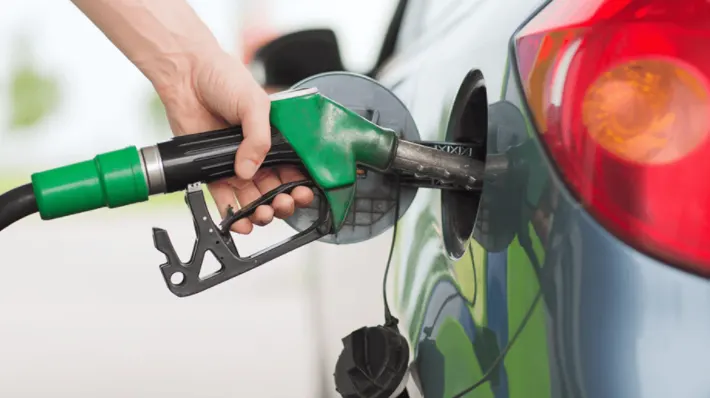
A higher MPG means less fuel is consumed as you’re driving. That means it’ll cost you less to run and (generally speaking) meaning your car is producing fewer emissions as it burns fuel more efficiently.
Litres per 100km (l/100km) is the European standard for fuel consumption. It’s almost a reverse of MPG — the lower the number is better in this case.
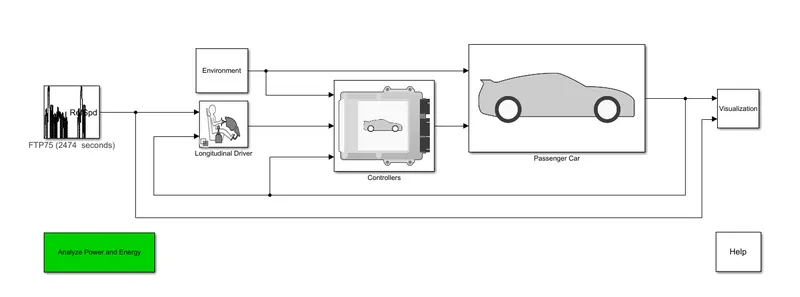
1. Open Electric vehicle reference application in Powertrain blocksets helpwindown.
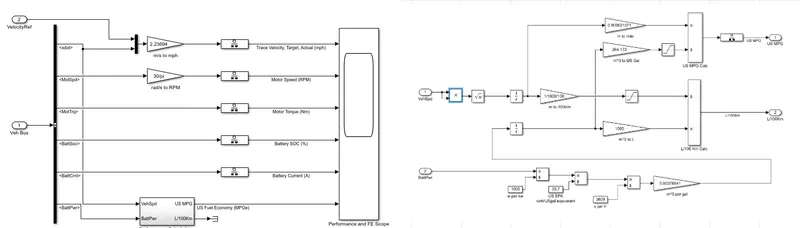
2. Open the Visulizaiton block and then open Performance calcuaiton to see the miles per gallon calculation
Here Vehicle speed and battery power are taken as a input to convert to the MPG and L/100 Km as shown below.
and the same Vehicle speed and battery power are consider for fuel model flow.
--------------------------------------------------------------------------------------------------------------------------------------------
Run the HEV ReferenceApplication with WOT drive cycle. Change the grade and wind velocity in the environment block. Comment on the results.
1. Open Hev ref. application file in power train blockset
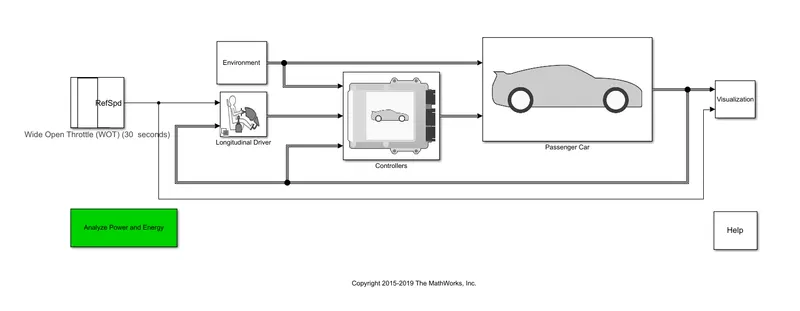
2. And select drive cycle as WOT and then open environment block to check the default value and run the analysis
the default setting has Zero Grade value and Wind velocity as shown below
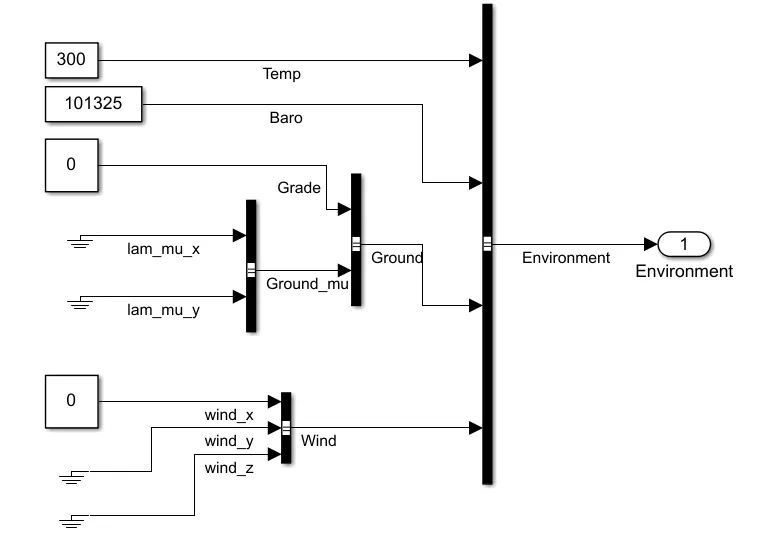
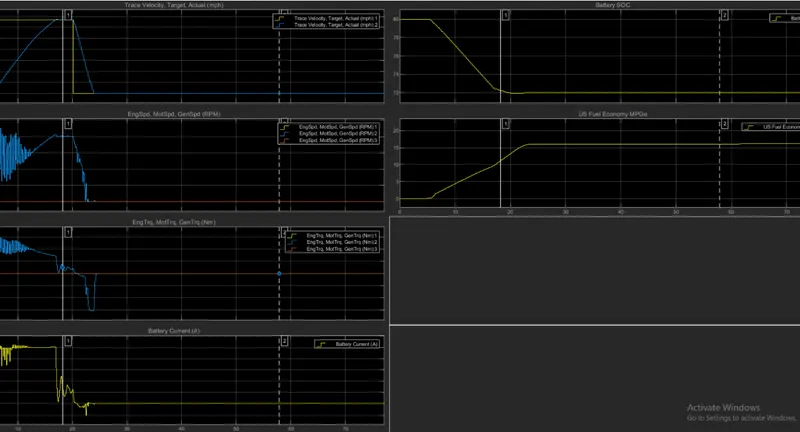
The graph shown for the default values as below
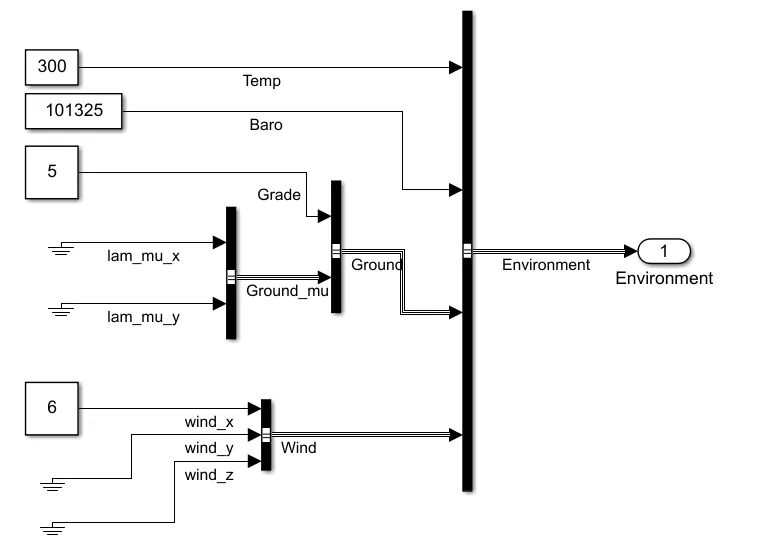
and changing the grade value to 5 and wind velocity to 6 as shown below and run the analysis and capture the result
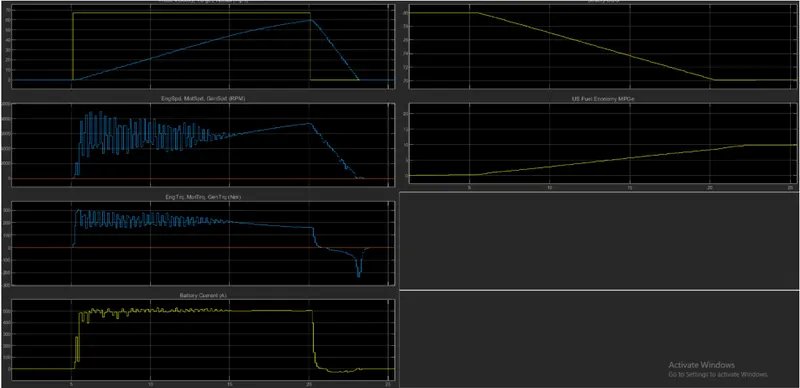
| # | With Zero grade and wind velocity | With 5 grade and 6 wind velocity | Delta |
| Max velocity (MPG) | 67.1 | 59.1 | 8 |
| Battery current(A) @ max velocity | ~240 | ~500 | -260 |
| Battery SOC % | 72 | 70 | 2 |
Form above values we conclue that when Grade and Wind velocity increases, there will be considerable reduction in vehicle performance
like decrease in max velocity , more current consumption which eats more battery charge.
-----------------------------------------------------------------------------------------------------------------------------------------------------------------------------------------------------------
Keeping all other parameters same, compare the simulated results of hybrid and pure electric powertrains
1. Open Electric vehicle application and then change the drive cycle to WOT with default value.
and run the application and caputure the result
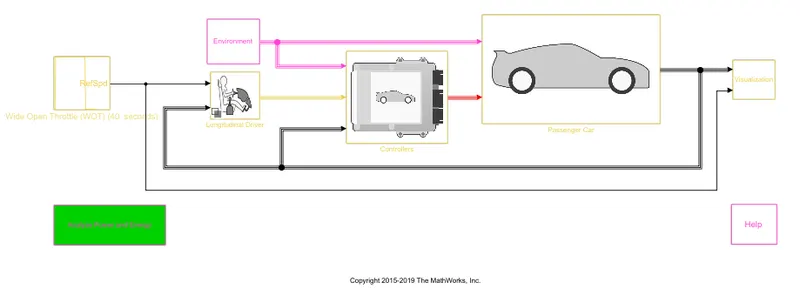
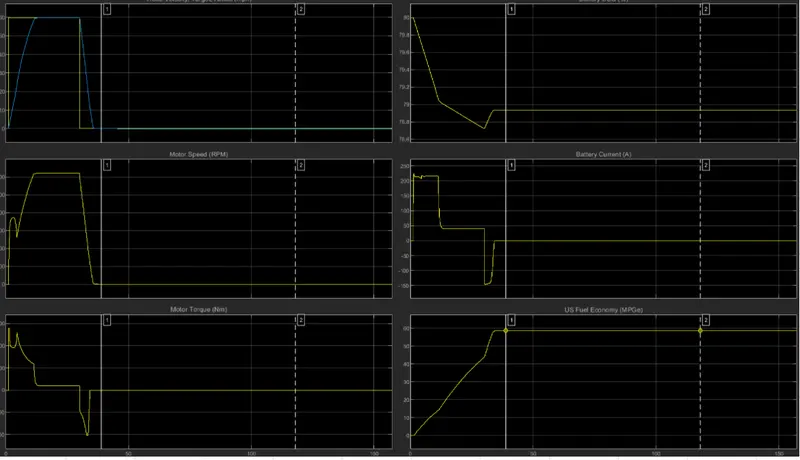
Open the HEV application and change the drive cycle to WOT with the same value given inthe Electric vehicl application and run the analysis and capture the result
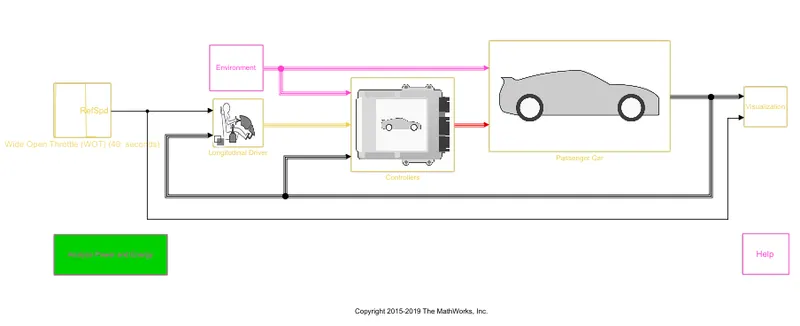
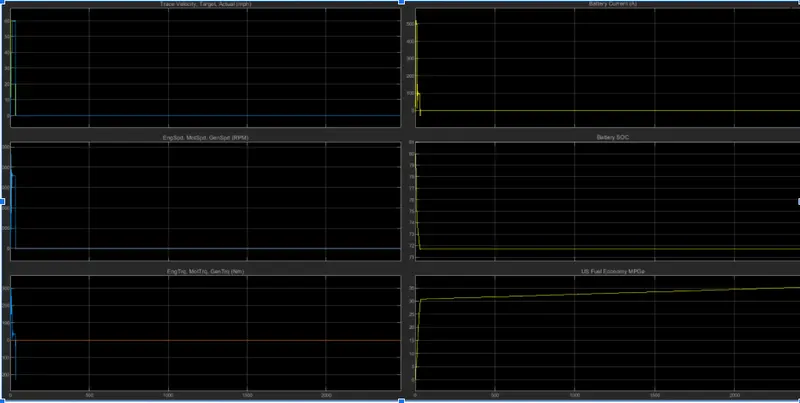
Compariosn of Simuaiton result
| # Description | EV(WOT with 40sec) | HEV(WOT with 40sec) | Comparative observaiton |
| Veloctiy MPH | 59.9 | 60 | No variation observed and the velocity achieved as per drive cycle input |
| Battery SOS | 78.9 | 68 | HEV consumed more battery than EV |
| MPGe | 58.7 | 32.5 | EV is showing highe MPGe rating than HEV |
| Battery current | 213 A to -150A | 550A- 100A | HEV is consumes more power than EV |