%This is the Main program and

clear all
close all
clc

dat=fopen('THERMO.DAT','r');

L1=fgetl(dat);     % To get first line and further using fgetl is auto increment to next line by default
L2=fgetl(dat);
GT=strsplit(L2,' '); % Split the line with space and place the numbers in cells to get its lenth
GT_L=str2num(GT{2});
GT_M=str2num(GT{3});
GT_H=str2num(GT{4});
for i=1:3;
    L=fgetl(dat);  % To skip unwanted lines
end

for i=1:53;        % To run the loop for 53 times to get the coeefiecient in all lines of the species with temperature

L6=fgetl(dat);%Species name & Local Temperatures
L7=fgetl(dat);%Co-efficient 1st line
L8=fgetl(dat);
L9=fgetl(dat);%Co-efficient last line


[Cp,H,S,T_R,Species]= coefficients(L6,L7,L8,L9); % This calls the Coefficients function which give the Cp,H & S values

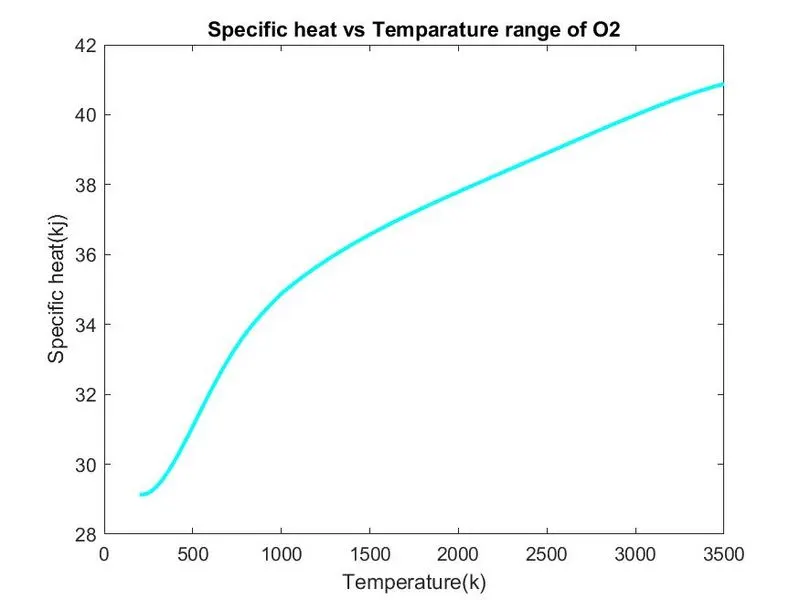
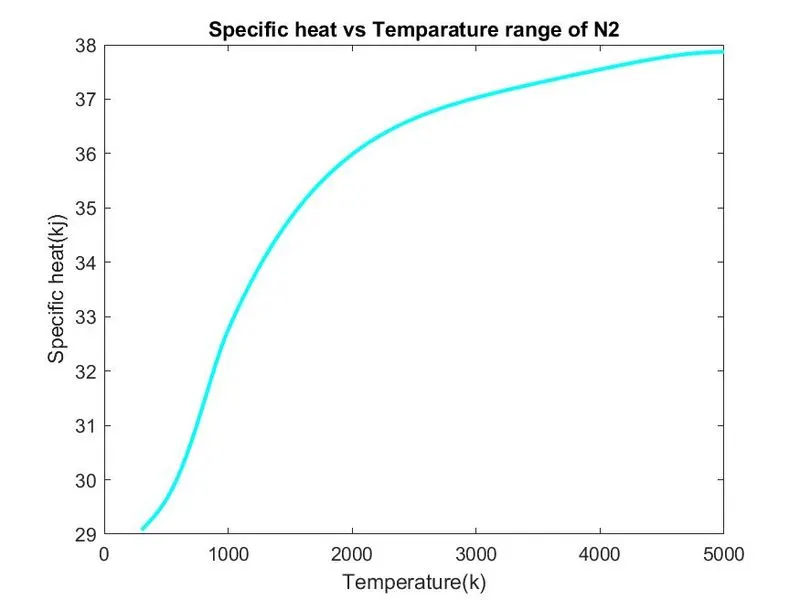
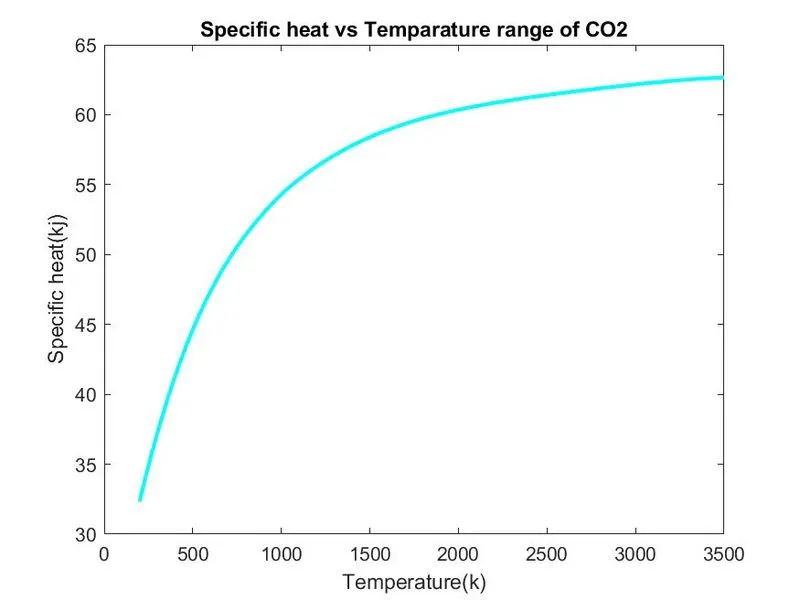
figure(1)
plot(T_R,Cp,'linewidth',2,'color','c');       % Ploting the graph b/w Temperature and CP
xlabel('Temperature(k)');
ylabel('Specific heat(kj)');
title(sprintf('Specific heat vs Temparature range of %s',Species)); % Using sprintf to make the tile as species name
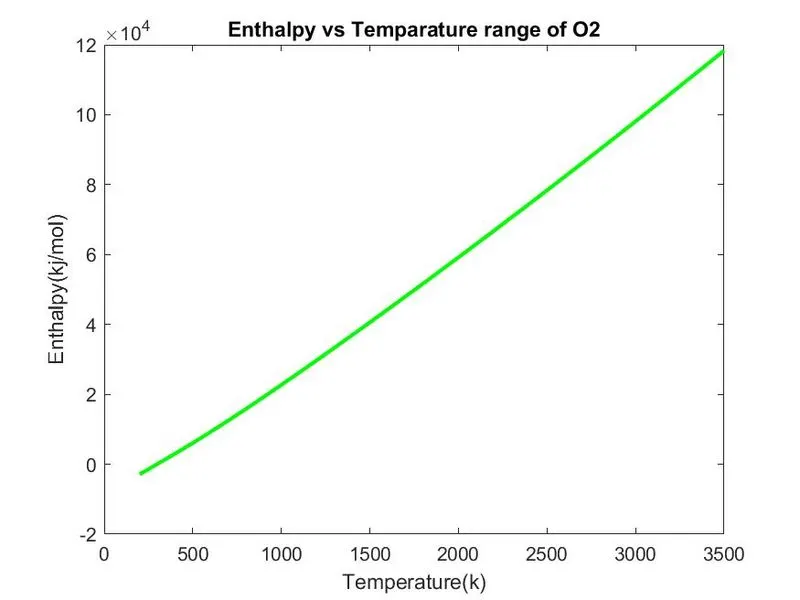
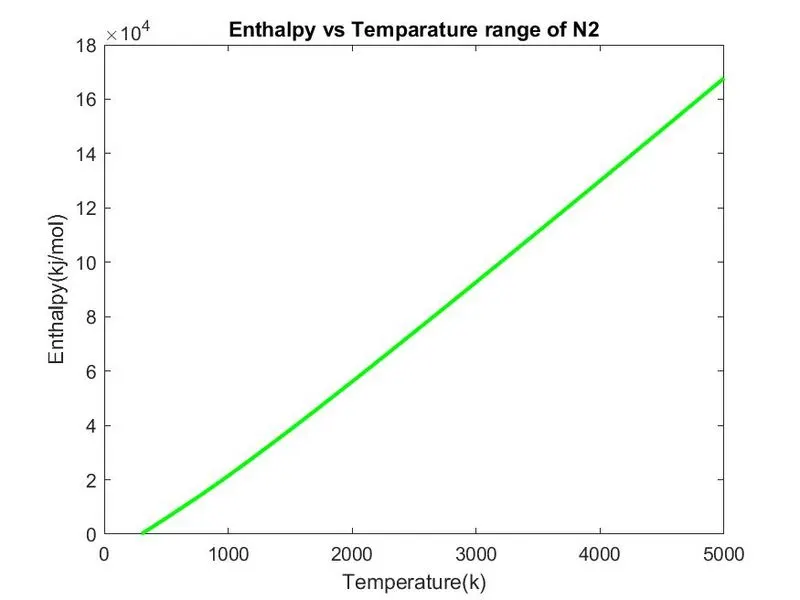
figure(2)
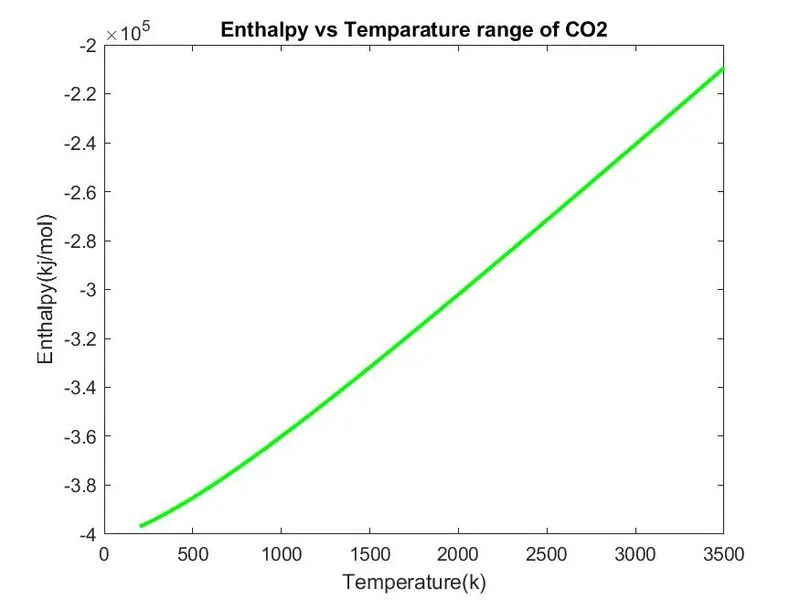
plot(T_R,H,'linewidth',2,'color','g');
xlabel('Temperature(k)');
ylabel('Enthalpy(kj/mol)');
title(sprintf('Enthalpy vs Temparature range of %s',Species));

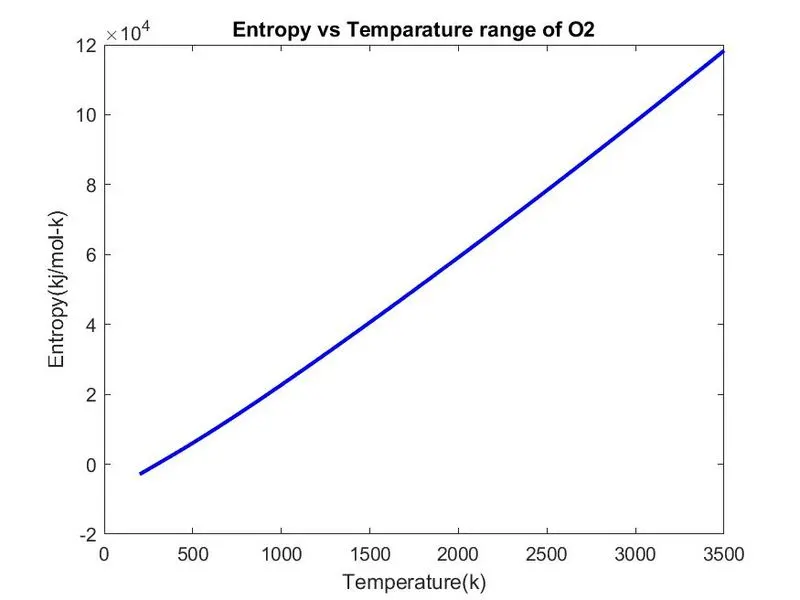
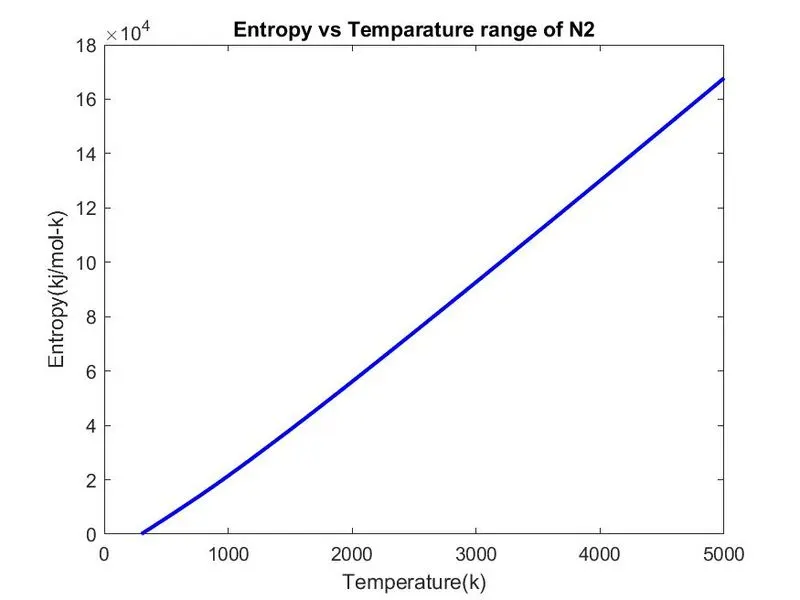
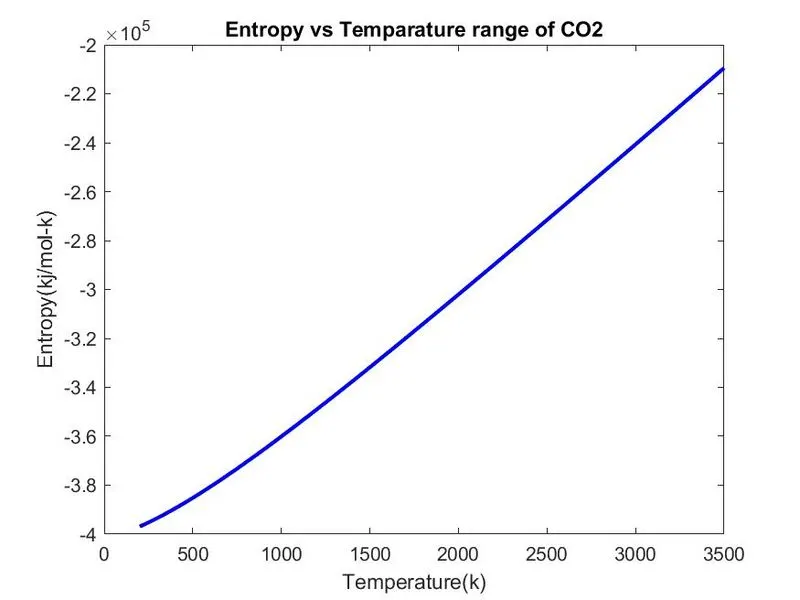
figure(3)
plot(T_R,H,'linewidth',2,'color','b');
xlabel('Temperature(k)');
ylabel('Entropy(kj/mol-k)');
title(sprintf('Entropy vs Temparature range of %s',Species));
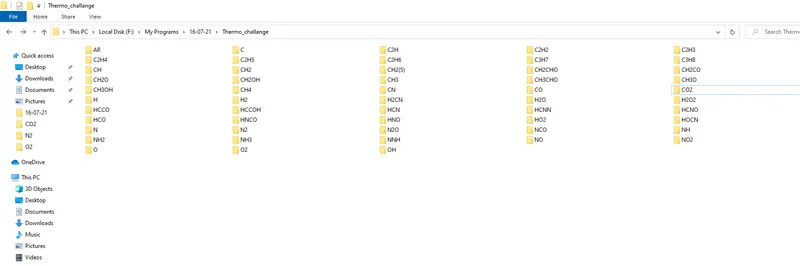
cd('F:\My Programs\16-07-21\Thermo_challange');  % Specify the required folder as current working directery to place all images
mkdir(['',sprintf('%s',Species)]);% create indiviudal folder inside workind directery for the respecive species
cd(sprintf('%s',Species));% Specify the individual folder as current working directery for saving the images in the respective species
saveas(figure(1),'Specific_heat.jpeg');% saving images
saveas(figure(2),'Enthalpy.jpeg');
saveas(figure(3),'Entropy.jpeg');

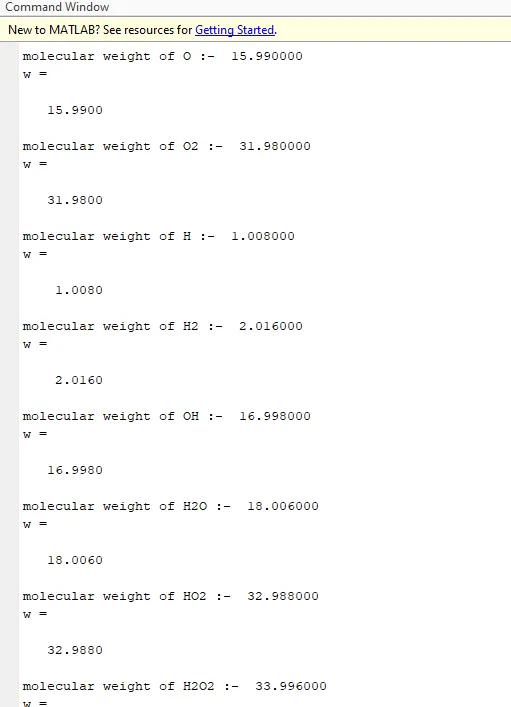
w=molecularweight(Species)% to get molecular weight of species


end
cd('F:\My Programs\16-07-21\Thermo_challange') % Specify the current directery where all images are saved
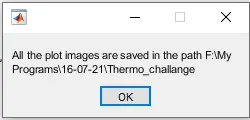
msgbox(sprintf('All the plot images are saved in the path %s',cd))% Once program complete, the user will get promt with the location information of files saved


% THis is the funtion program to extract the coefficients and temperatures
function [Cp,H,S,T_R,Species]= coefficients(L6,L7,L8,L9);%function to get the coeffiecients of all the lines
S1= strsplit(L6,' '); % used strsplit with space to seperate the elements in the line
Species=(S1{1});% used the length of the element to get the species name
L_LT=str2num(S1{end-3}); % used the length of the element to get the local temeperature
L_HT=str2num(S1{end-2});
L_MT=str2num(S1{end-1});

%Extrating the Co-efficient
coeff1=findstr(L7,'E');% used strsplit with E to seperate the elements in the line
coeff2=findstr(L8,'E');
coeff3=findstr(L9,'E');


a1=str2num(L7(1:coeff1(1)+3));% used the length of the element  & range to get the coeefficient
a2=str2num(L7(coeff1(1)+4:coeff1(2)+3));
a3=str2num(L7(coeff1(2)+4:coeff1(3)+3));
a4=str2num(L7(coeff1(3)+4:coeff1(4)+3));
a5=str2num(L7(coeff1(4)+4:coeff1(5)+3));
a6=str2num(L8(1:coeff1(1)+3));
a7=str2num(L8(coeff1(1)+4:coeff1(2)+3));
a8=str2num(L8(coeff1(2)+4:coeff1(3)+3));
a9=str2num(L8(coeff1(3)+4:coeff1(4)+3));
a10=str2num(L8(coeff1(4)+4:coeff1(5)+3));
a11=str2num(L9(1:coeff1(1)+3));
a12=str2num(L9(coeff1(1)+4:coeff1(2)+3));
a13=str2num(L9(coeff1(2)+4:coeff1(3)+3));
a14=str2num(L9(coeff1(3)+4:coeff1(4)+3));

L_Temp=[L_LT L_MT L_HT];% Assigning the variables to Local termparature range
T_R=linspace(L_LT,L_HT,500);
R=8.314;% universal Gas constant
Cp =specfic_heat(a1,a2,a3,a4,a5,a8,a9,a10,a11,a12,T_R,R,L_Temp); % Calculate Cp by calling the Specfic heat function
H= Enthalpy(a1,a2,a3,a4,a5,a6, a8,a9,a10,a11,a12,a13,T_R,R,L_Temp);% Calculate Cp by calling the Enthalpy function
S=Entropy(a1,a2,a3,a4,a5,a6, a8,a9,a10,a11,a12,a13,T_R,R,L_Temp);% Calculate Cp by calling the Entropy function
end


% THis is the funtion program to calculate Cp
function[Cp]= specfic_heat(a1,a2,a3,a4,a5,a8,a9,a10,a11,a12,T_R,R,L_Temp)%This function gets all the variables value from the coefficent function

for i=1:length(T_R)%Loop runs for each Termparture range starting from Low to H
if T_R(i)<=L_Temp(2)%if Termparture is below the average temperature then below formula runs and vice versa

    Cp(i)=R*(a8+(a9*T_R(i))+(a10*(T_R(i).^2))+(a11*(T_R(i).^3))+(a12*(T_R(i).^4)));

else

    Cp(i)=R*(a1+(a2*T_R(i))+(a3*(T_R(i).^2))+(a4*(T_R(i).^3))+(a5*(T_R(i).^4)));

end
end

% THis is the funtion program to calculate Enthalpy
function[H]=Enthalpy(a1,a2,a3,a4,a5,a6, a8,a9,a10,a11,a12,a13,T_R,R,L_Temp)%This function gets all the variables value from the coefficent function

for i=1:length(T_R)%Loop runs for each Termparture range starting from Low to H
if T_R(i)<=L_Temp(2)%if Termparture is below the average temperature then below formula runs and vice versa

    H(i)=R*(a8*(T_R(i))+(a9*((T_R(i).^2)/2))+(a10*((T_R(i).^3)/3))+(a11*((T_R(i).^4)/4))+(a12*((T_R(i).^5)/5))+a13);

else

    H(i)=R*(a1*(T_R(i))+(a2*((T_R(i).^2)/2))+(a3*((T_R(i).^3)/3))+(a4*((T_R(i).^4)/4))+(a5*((T_R(i).^5)/5))+a6);

end
end


% THis is the funtion program to calculate Entropy

function[S]=Entropy(a1,a2,a3,a4,a5,a6, a8,a9,a10,a11,a12,a13,T_R,R,L_Temp)%This function gets all the variables value from the coefficent function

for i=1:length(T_R) %Loop runs for each Termparture range starting from Low to H
if T_R(i)<=L_Temp(2) %if Termparture is below the average temperature then below formula runs and vice versa

    S(i)=R*(a8*log(T_R(i)))+(a9*(T_R(i))+(a10*((T_R(i).^2)/2))+(a11*((T_R(i).^3)/3))+(a12*((T_R(i).^4)/4))+a13);

else

    S(i)=R*(a1*log(T_R(i)))+(a2*(T_R(i))+(a3*((T_R(i).^2)/2))+(a4*((T_R(i).^3)/3))+(a5*((T_R(i).^4)/4))+a6);

end
end