Week-4 Challenge WOT Condition Part-2
- What is the difference between mapped and dynamic model of engine, motor and generator? How can you change model type?
ans:-
- In powertrain blockset provides two types of combustion models
- mapped and dynamic model.
- When you customize a SI or CI reference application, you can use either a dynamic or mapped engine.
Mapped model :-
IMPLEMANTATION:-
- Model uses a set of steady-state lookup tables to characterize engine performance.
- The tables provide overall engine characteristics, including actual torque, fuel flow rate, BSFC, and engine-out exhaust emissions. in this model data is taken from lookup table charaactrises engine/ motor/ genrearator under certain parameters.
- this model repesents macro engine behaviour as set of lookup table(brake torque,fuel flow,air mass flow, exhaust temperature,efficiency and emissions) as a function of commanded load
WHEN TO USE:-
- If you have engine data from a dynamometer or a design tool like GT-POWER.
- For quasi steady-state engine simulations.
DYNAMIC MODEL
IMPLEMANTATION:-
Model decomposes the engine behavior into engine characteristics that are separated into lower-level components.
By combining components in this way, the models capture the dynamic effects.
WHEN TO USE:-
• If you need a more detailed dynamic model and have component-level data.
• To analyze the impact of individual engine components on the overall performance
HOW CAN CHANGE THE MODEL TYPE :-
following steps for changing the model
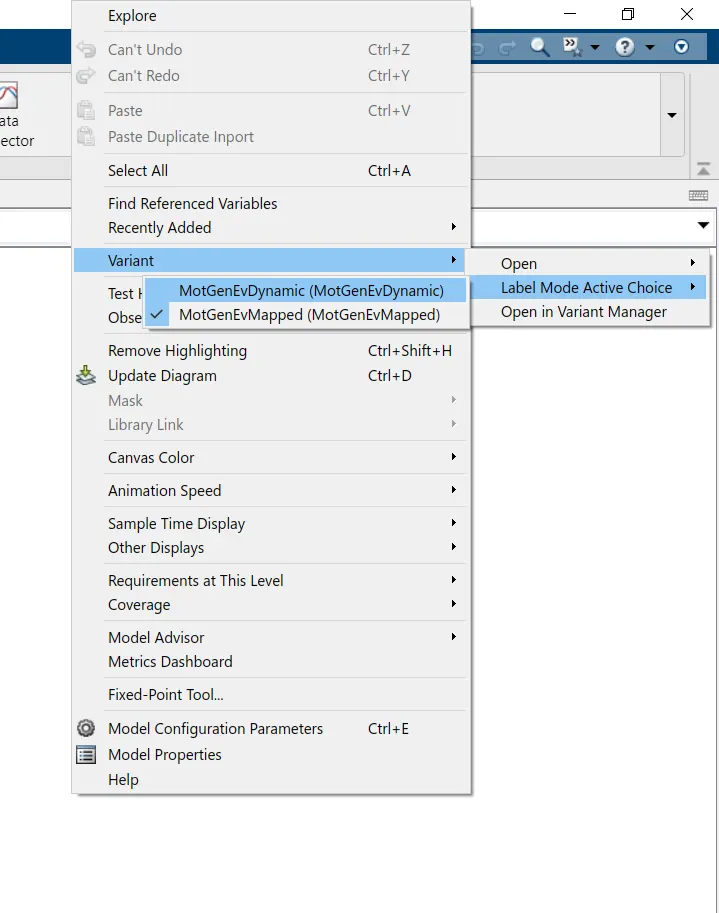
- open the model click on passenger_car/electric_plant/motor/
- right click select varient/label_mode_active_choice/motgenevedynamic
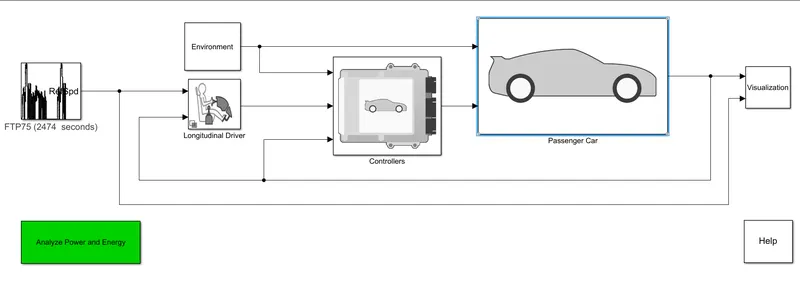
1) click on passenger car
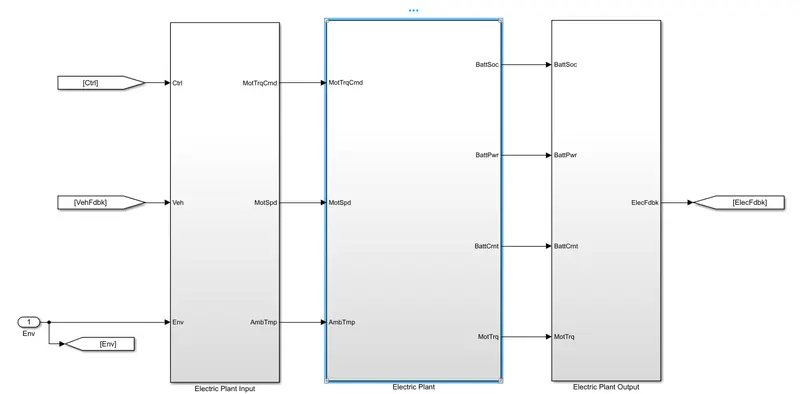
2) select electric_plant
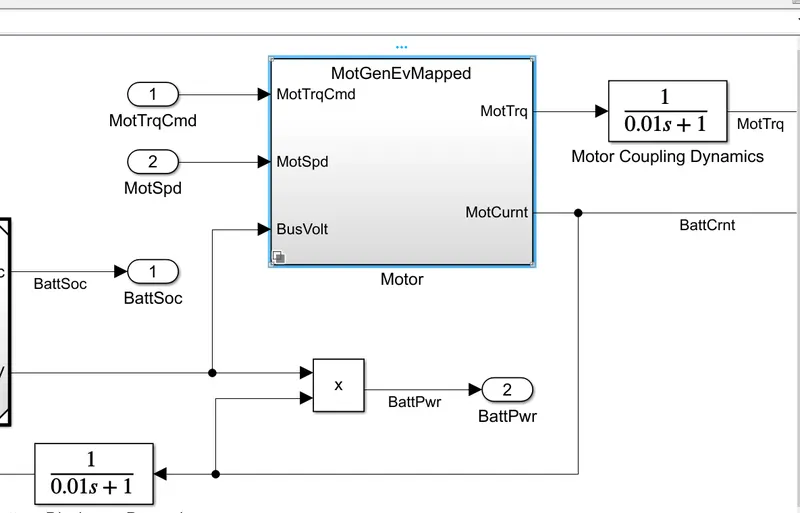
3) select motor
4) right click select varient/label_mode_active_choice/motgenevedynamic
2)How does the model calculate miles per gallon? Which factors are considered to model fuel flow?
MPG is a fuel economy rating determined by how far a car can travel on a gallon of gasoline or diesel
with the calculation of MPG efficiency of a vehicle is determined
MODEL CALCULATION OF MPG :-
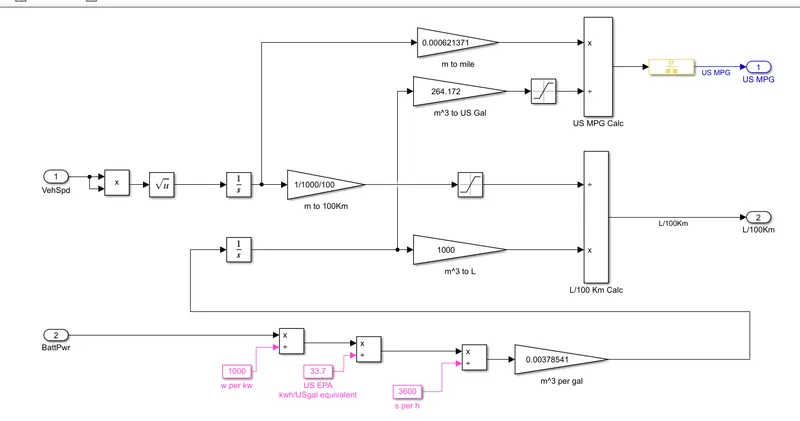
- The model calculate the MPG& L/100, by considering vehicle speed , fuel volume flow and battery power as a input
- the input for the US MPG calculation are vehicle speed in miles & fuel flow volume in gallons.
FACTORS THAT AFFECT THE FUEL ECONOMY:-
- Excessive short trips
- heavy braking & acceleration
- frequent cold weather travel
- high vwhicle weight or towing weight
- speeding
- hill climbing
- bad road
Q3- Run the HEV ReferenceApplication with WOT drive cycle. Change the grade and wind velocity in the environment block. Comment on the results
ANS:-
HEV REFERANCE APPLICATION WITH WIDE OPEN THROTTLE DRIVE CYCLE
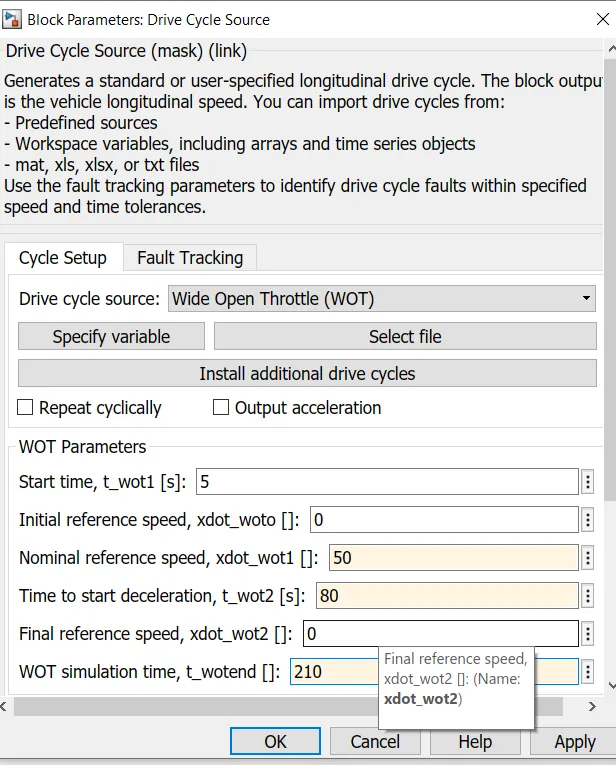
- vehicle is idle for 0-5 sec. and the input speed is 50 mph
- vehicle will start deccelerating after 80secs.
- final speed is 0 mph which will take 5 secs after decceleration start
- model & simulation time is 210 secs
RESULTS:-
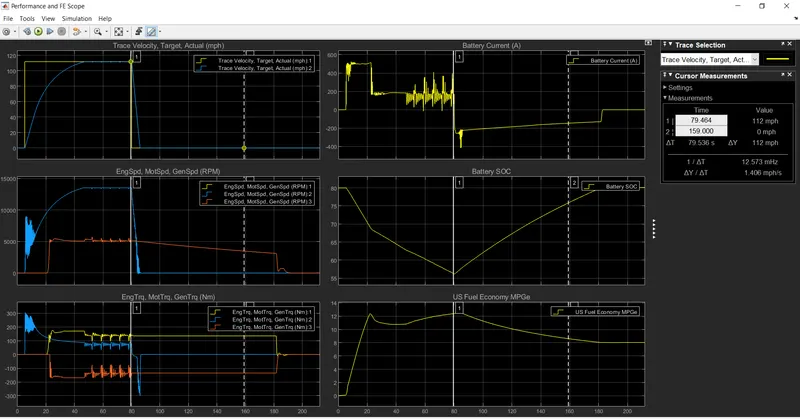
TRACE VELOCITY:-
- time required for maximum velocity of 50mph is 46.53 secs
- after achieving required input velocity, velocity is constant till decceleration (80)
- after that vehicle speed is 0 mph from 85 secs to 210
battery current :-
- consumption of current is high while achieving max velocity
- consumption of current decreased while constant velocity.
- current value goes negative after deceleration
battery SOC:-
- soc is started decreasing till deceleration of 80 secs.
- at the time of decceleration and braking motor is act as a generator.
- KEEPING OTHER ALL PARAMETERS SAME AND JUST CHANGING WIND VELOCITY AND GRADE FROM THE ENVIRONMENT
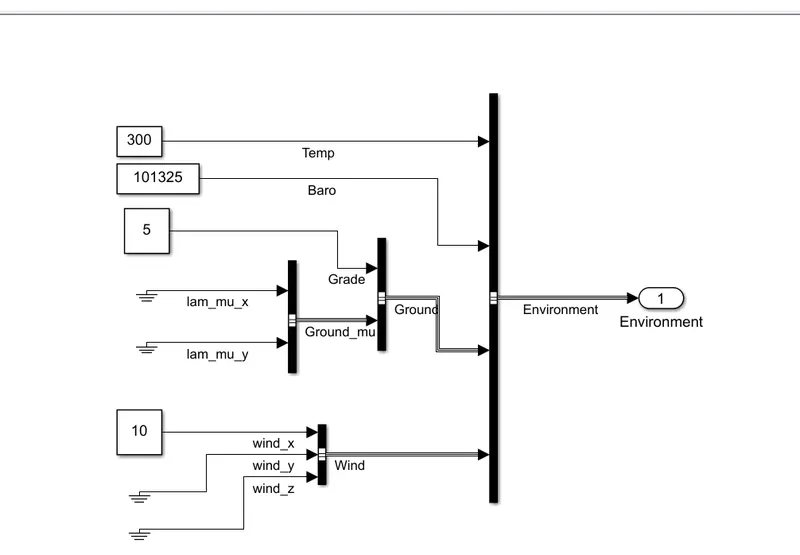
- some values are changed in the environment
- grade is 5 and velocity is 10
- and remaining all parameters are same
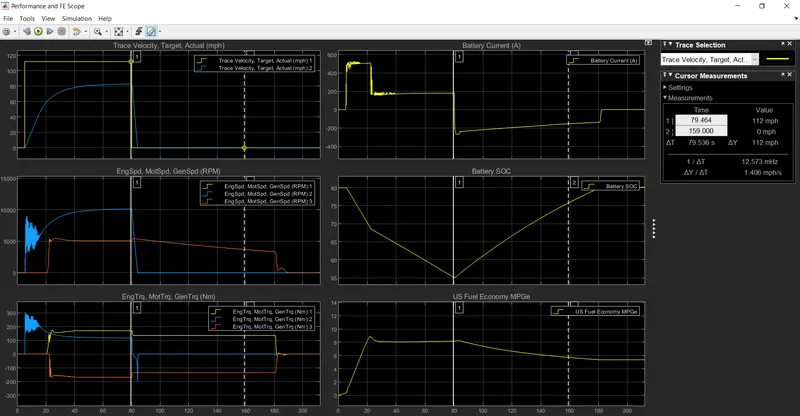
- with this changes in environment required time to achieve maximum speed is greater than no changes in the environment
- this is only the major effect on the result:
- this issue can be overcome by increasing battery current and the engine power.
Q4:-Keeping all other parameters same, compare the simulated results of hybrid and pure electric powertrains.
ANS:-
case1:- HEV multimode reference application.
- open the HEV multimode reference application mode in MATLAB.
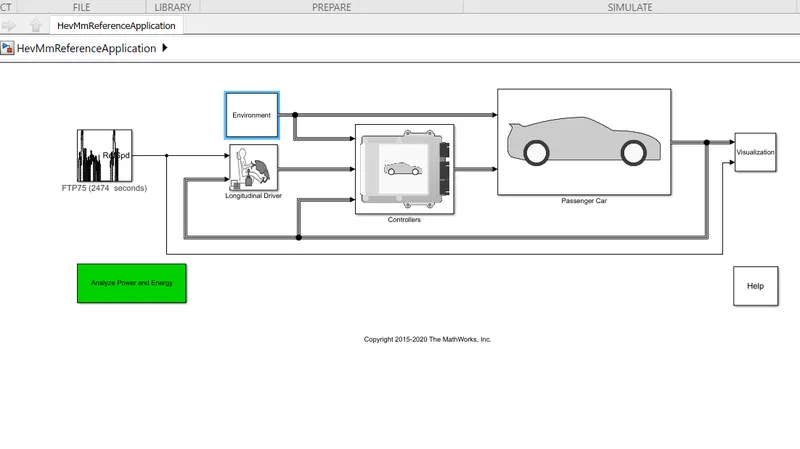
- The model consist of enviroment block, car passenger block, longitudinal driver and visulization subsystem.
- open the enviroment block and change the grade value to 5 and wind velocity to 10.
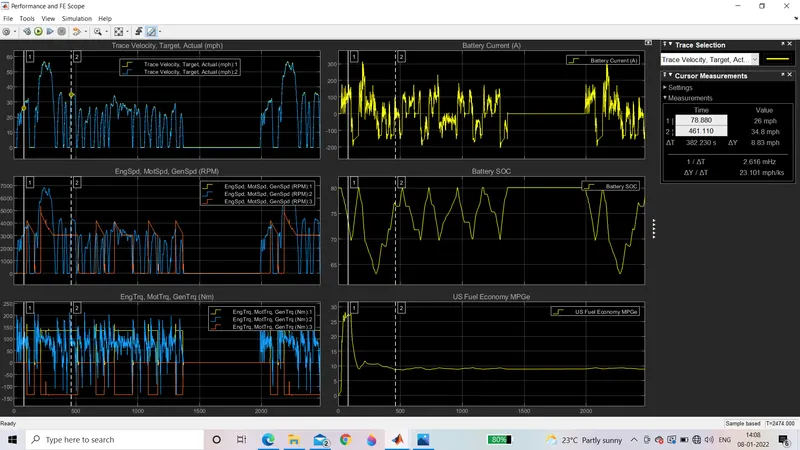
- now run the simulation with 2474 seconds and go to the visulization block to see the graph.
model:-
Result graph:-
case2:- pure electric vehicle reference application.
- open the pure electric vehicle reference application mode in MATLAB.
- The model consist of enviroment block, car passenger block, longitudinal driver and visulization subsystem.
- open the enviroment block and change the grade value to 5 and wind velocity to 10.
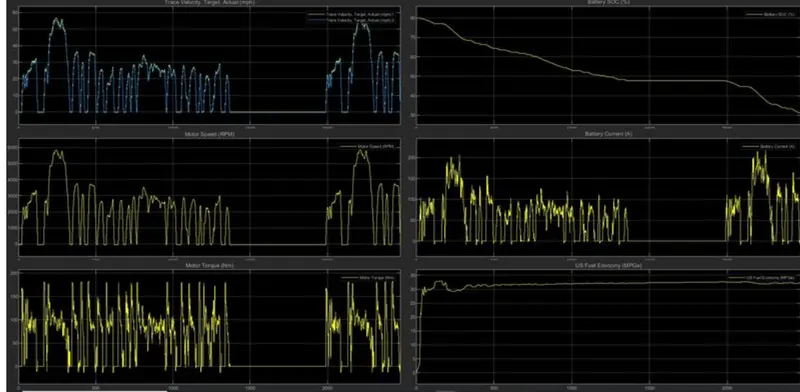
- now run the simulation with 2474 seconds and go to the visulization block to see the graph.
Model:-
RESULT GRAPH:-
Conclusion:-
- battery current is continuosely changing in HEV due to charging and discharging while in pure EV the battery current is continuesly dropping.
- the US fuel economy is high in pure EV compared to HEV, travelling cost is less for EV.
- The motor speed(RPM) is high for HEV compared to EV.