Week-4 Challenge WOT Condition Part-2
- What is the difference between mapped and dynamic model of engine, motor and generator? How can you change model type?
ans. Mapped Models
Mapped Model uses a set of Steady state Look up table for simulation and it's operation.
If the lookup table is present then the simulation becomes easier and it gives results based on the data interpreted.This is also called Global Based Model.
The drawback is more data has to be collected and we need to make some assumptions.
The effect on the engine can be simulated with the array of data interpreted in the system.
The motor specifications such as RPM,Voltage,Power, efficiency,temperature,etc are to be entered for simulation.
Specifications for torque,current,etc and other parameters to be entered for simulation.
Dynamic Models
Dynamic model decomposes the engine behaviour into engine characteristics that are separated into lower level blocks. Combining these blocks together to form a dynamic model.
It operates dynamically depending on the situation of operation detailed data and specifications are not required and the simulation gives the detailed analysis of the components simulated.This is called Real time Based Model.
It cannot be simulated using custom preferences.
The engine performance will be simulated based on the original specifications of that engine and the results are real time.
The actual details would be same as the results obtained.
All the details and specifications would be considered as per the actual and dynamic state of the same would be obtained then.
Matlab Powertrain Blockset
figure1
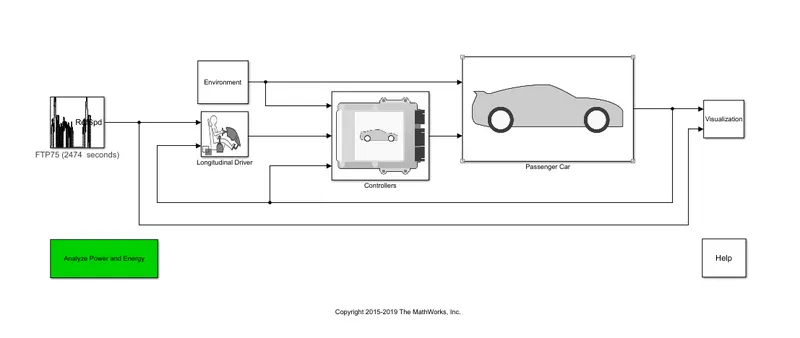
passenger car block
figure2

figure3
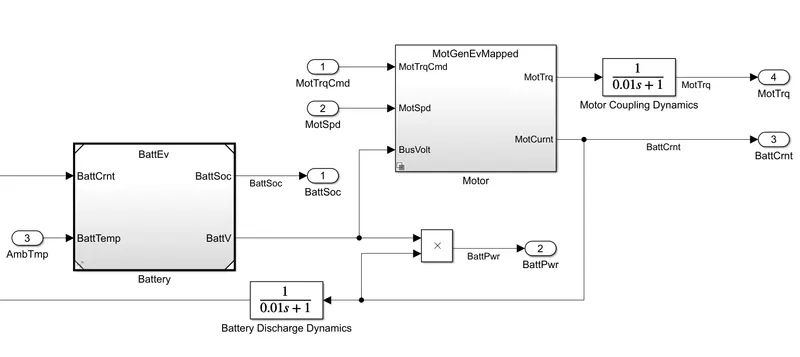
2.How does the model calculate miles per gallon? Which factors are considered to model fuel flow?
ans Miles per gallon(mpg) and miles per gallon equivalent(mpge) for conventional vehicle,the fuel efficiency is calculated via miles per gallon(mpg), however fuel efficiency for hybrid electric vehicles is calculated via miles per gallon equivalent(mpge). mpg is the number of miles your car can drive per gallon of gas. Figuring out an mpge rating is a little more complicated, since engines that can use an alternative source of fuel can't be measured by liquid gallons of fuel, the mpge rating is calculated by figuring out the number of miles a vehicle can go using the same energy content of gas. The epa calculated that 33.7 kilowatt hours of electricity is equivalent to one gallon of gas.
figure4
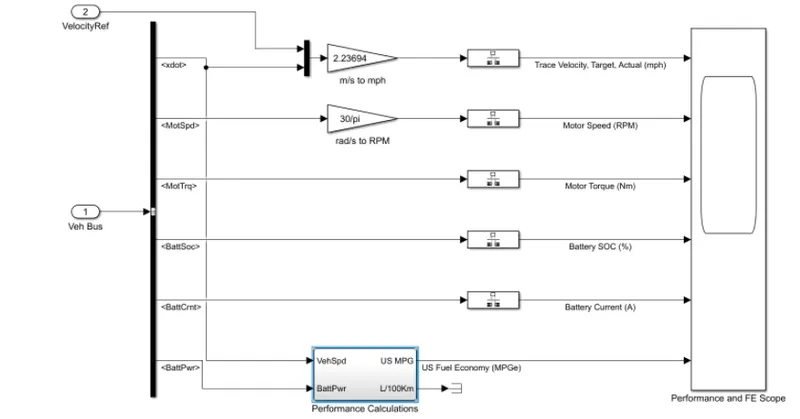
inside this block we will get mpg calculations:
figure5
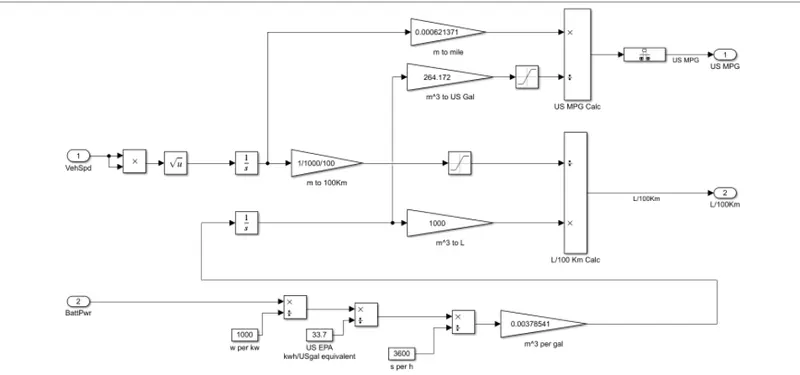
Here three different inputs are taken into considerations:
1.vehicle speed
2.fuel flow
3.battery power
The vehicle speed inputs is in m/s which is converted into miles by multiplying with 0.000621371
similarly the kilogram of fuel is converted into cubic meter by multiplying by 1/(1000*0.739)
this cubic meter value is then converted into gallons by multiplying it with 264.172, the mile value and gallon value is used to find mpg of the vehicle.
now the battery value is initially converted from watts to kwh by dividing with 1000 and then to gallon equivalent by again dividing it with 33.7(since 33.7 kwh = 1 gallon)
then divide the value by 3600 to get in per seconds and multiply by 0.0037854 to get the value in cubic meter per gallons.
3.Run the HEV ReferenceApplication with WOT drive cycle. Change the grade and wind velocity in the environment block. Comment on the results.
ans.
figure6
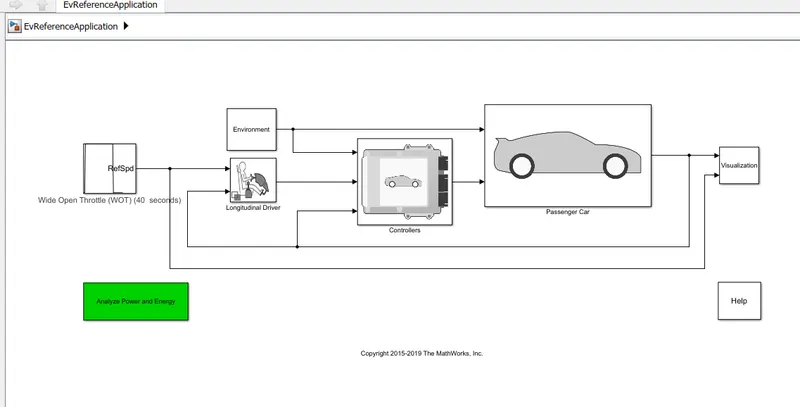
here we have changed drive cycle to wot
figure7
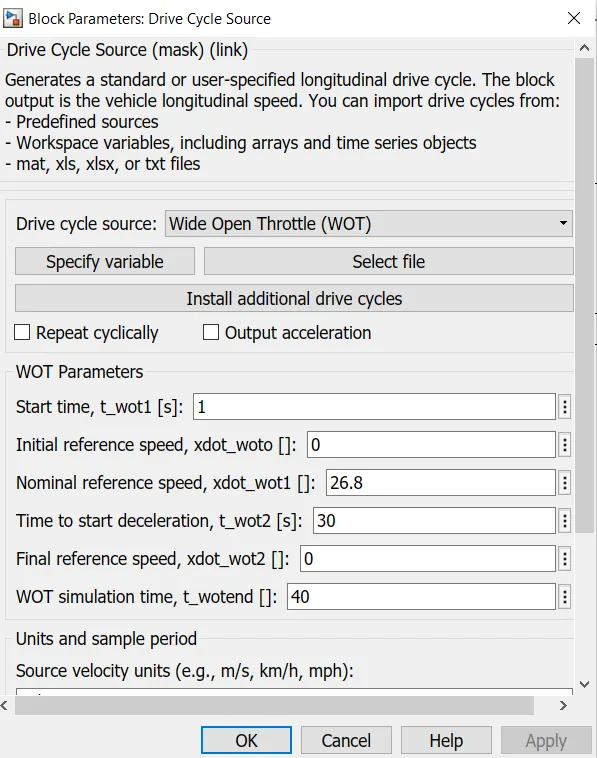
we have change the simulation time to 40sec
figure8
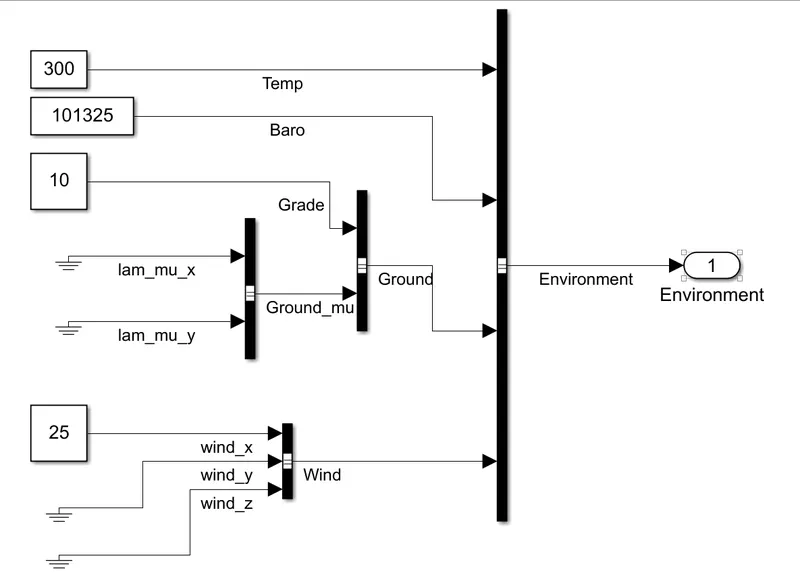
we have also altered environment block and changed wind speed to 25m/s and grade to 10.
we run the system
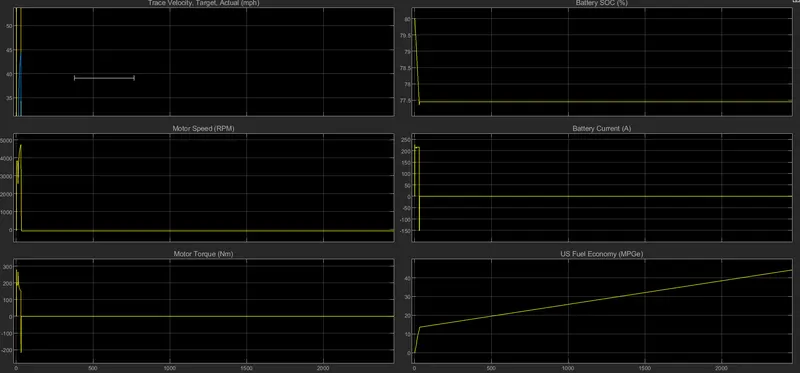
The following result is achieved
figure9
Conclusion:
The result obtained by the graph are as follows:
Plot1
trace velocity = 45mph
time taken to accelerate = 29.034sec
time taken to deccelerate = 2.471sec
Plot2
Motor and engine RPM:
top motor RPM = 5700rpm
Plot3
Motor and engine torque
Maximum motor torque = 290Nm
Plot4
Battery SOC
The battery SOC is coming down from 80 to 75% during acceleration of vehicle and it increases slightly during decelaration due to regenerative braking
plot5
battery current
The battery supply current is at its maximum value of 225 ampere when full throttle is applied by the user it reduces drastically to the value of negative 150 during deccelaration of the vehicle.
Plot6
Fuel economy
Maximum fuel economy achieved = 40
4.Keeping all other parameters same, compare the simulated results of hybrid and pure electric powertrains.
ans.HEV model is as follows
figure10
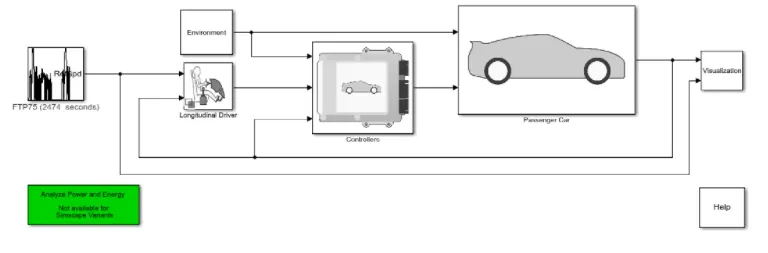
HEV has both an electric motor and a fuel engine to run the vehicle. The electric motor runs the vehicle up to the value of the state of charge of the vehicle reaches below 70 suddenly the engine starts to run the vehicle and once SOC reaches to its value 80 ten the engine stops and electric motor starts working.
Output Plot of the HEV is shown below
figure12
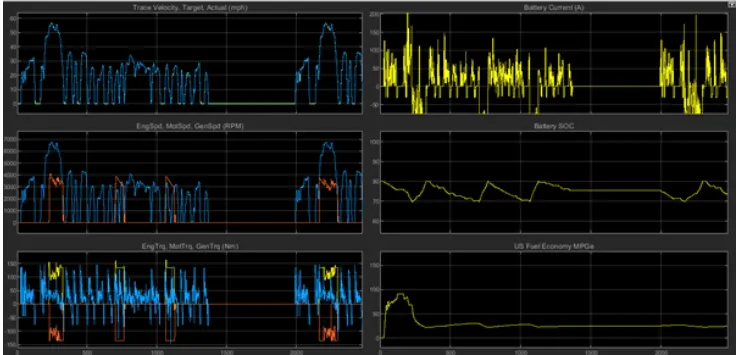
From the plot , the trace velocity actual and target are almost in the same valure, in the second plot of the engine, motor and generator speed. The speed of thee generator is the same as that of the engine and the torque of the generator shown as negative value in the plot it's just because of regenerative braking.HEV gives an RMS values of US Fuel MPG efficiency of 33.
Simulink model of EV powertrain is as follows
figure11
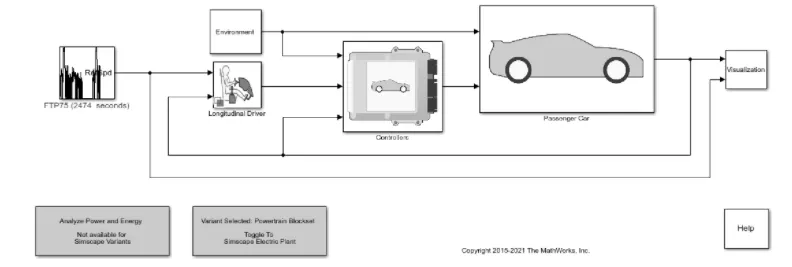
pure EV vehicle runs by electric motor in it.The vehicle runs up to certain level of battery charge it recharges by regenerative braking.
figure13
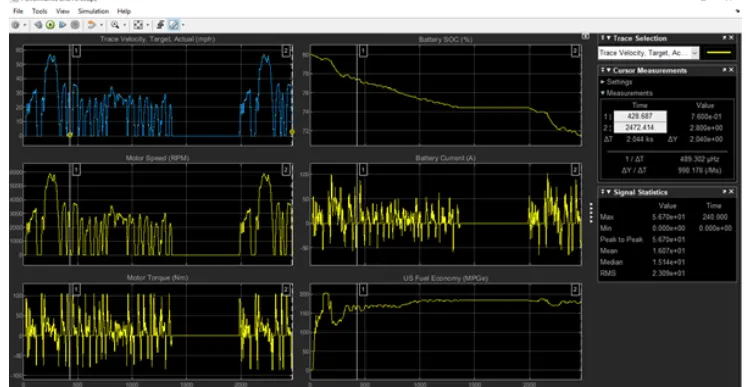
Comparison of Output Values
Sl. no. Plots HEV EV Unit
1 a)Maximum Velocity 56.4 56.1 mph
b)RMS Velocity 23.01 23.09 mph
2 a)Engine Speed Maximum 4121 RPM
b)Engine speed RMS 1285 RPM
3 a)Motor speed Maximum 6771 5872 RPM
b)Motor speed RMS 2759 2391 RPM
4 a)Engine torque maximum 161.9 Nm
b)Engine torque RMS 47.58 Nm
5 a)Motor Torque maximum 146.8 106.9 Nm
b)Motor torque RMS 39.58 31.57 Nm
6 a)Battery SOC maximum 80.2 80 %
b)Battery SOC minimum 69.7 71.48 %
7 a)Battery current Maximum 214 101.3 A
b)Battery current RMS 49.81 21.04 A
8 a)US Fuel economy(MPGe)Max 91.33 203.4
b)US Fuel economy (MPGe)RMS 33.04 174.3